. 2022 Apr 13;96(7):e0188821.
doi: 10.1128/jvi.01888-21. Epub 2022 Mar 23.

GATA3 Inhibits Viral Infection by Promoting MicroRNA-155 Expression

Affiliations

GATA3 Inhibits Viral Infection by Promoting MicroRNA-155 Expression

Jiaxin Li et al. J Virol. .

Abstract

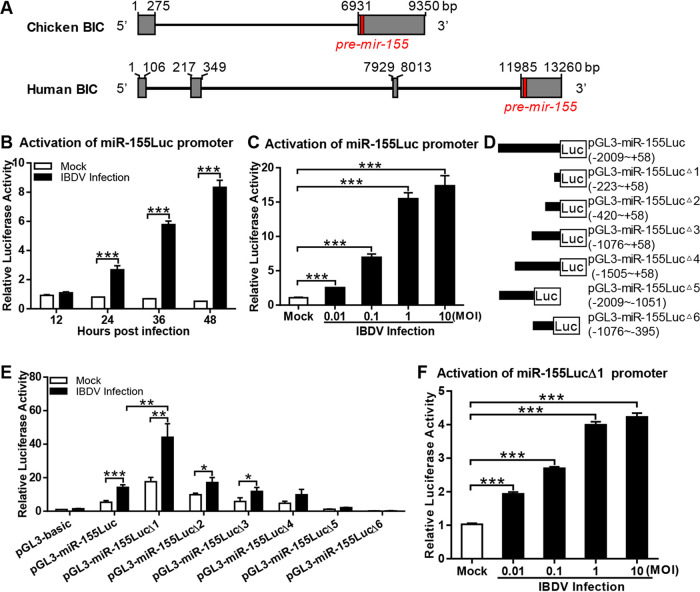
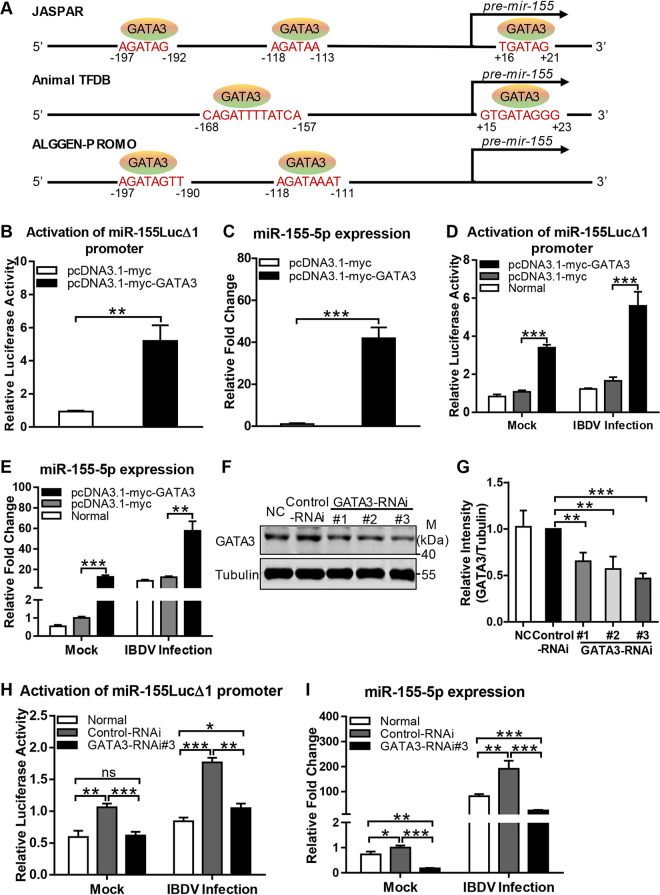
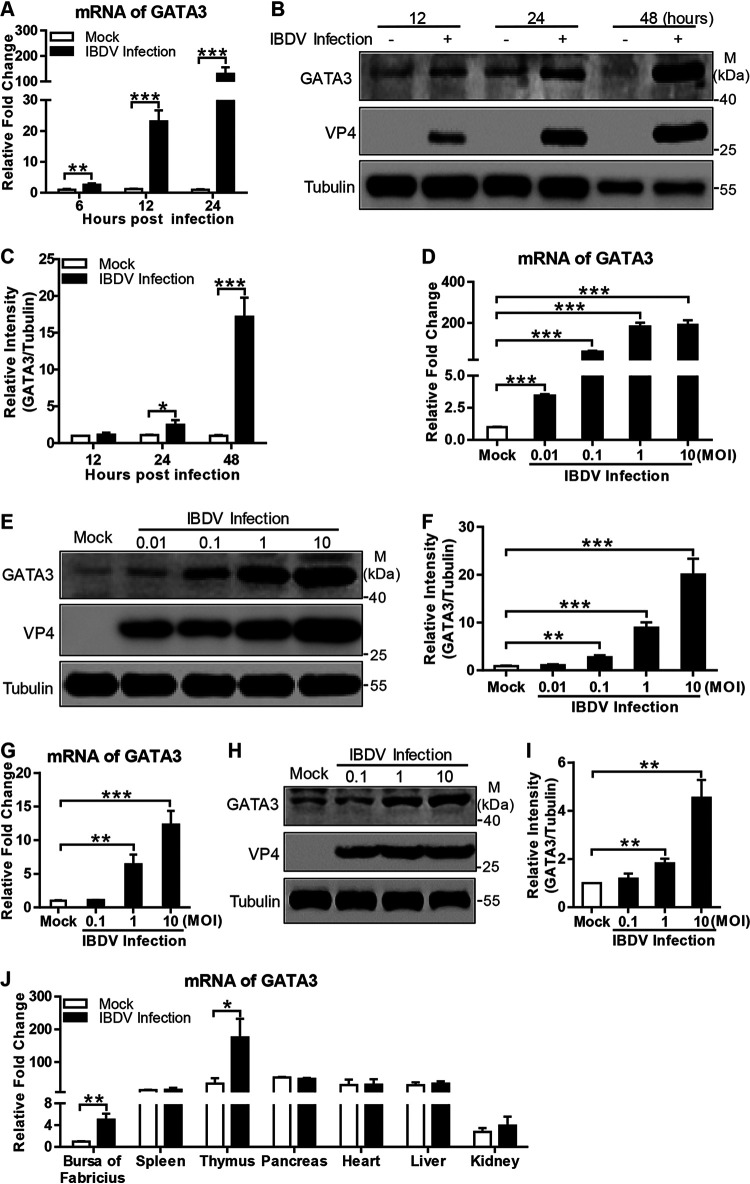
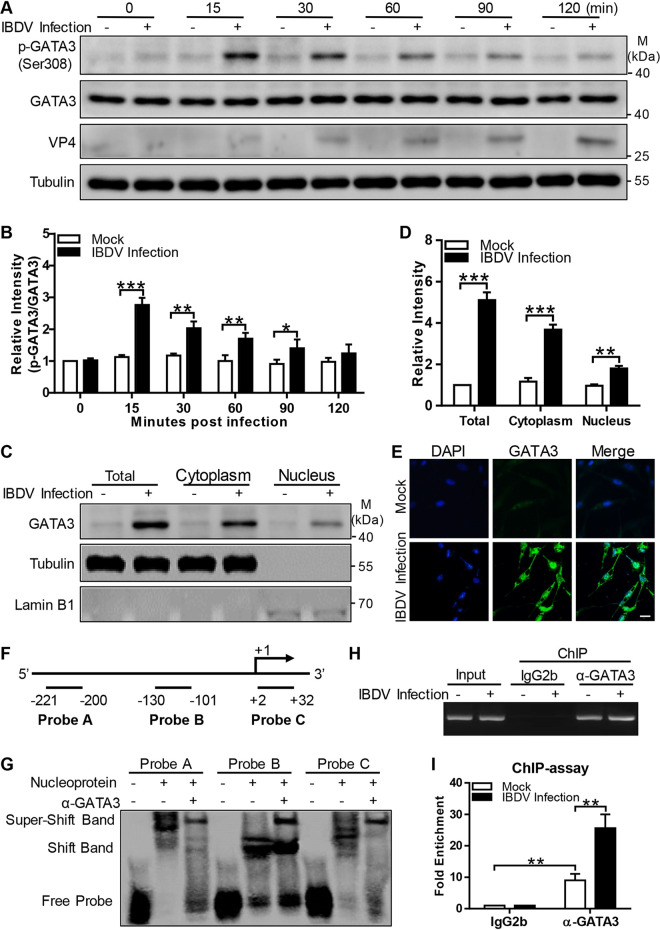
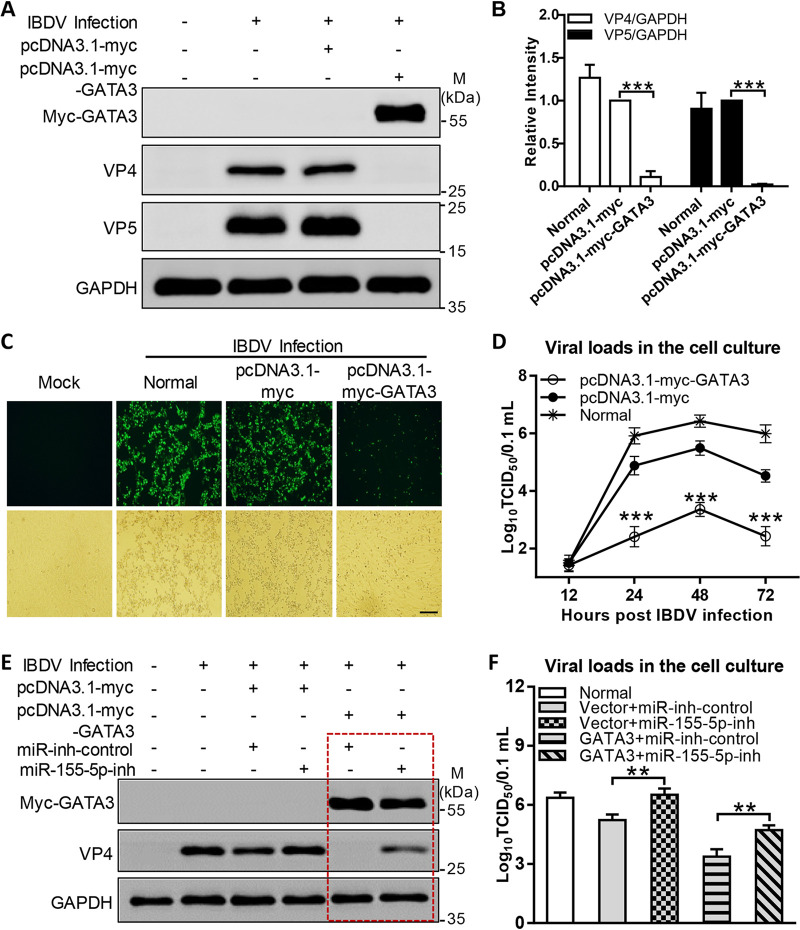
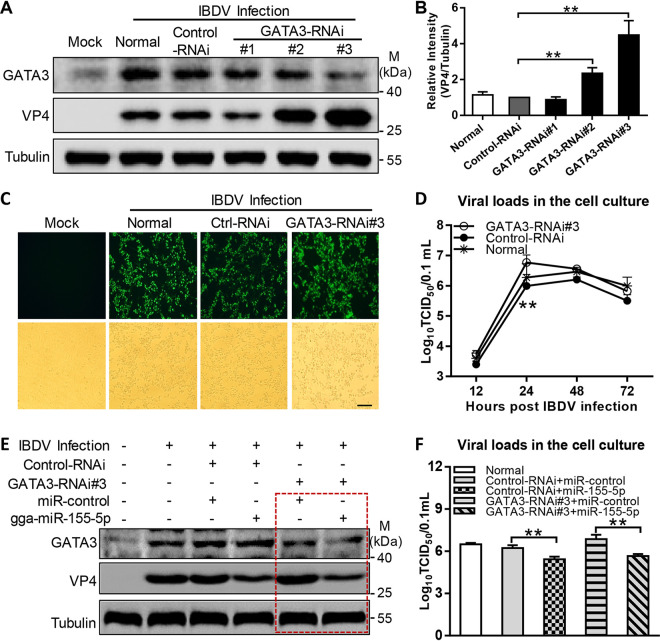
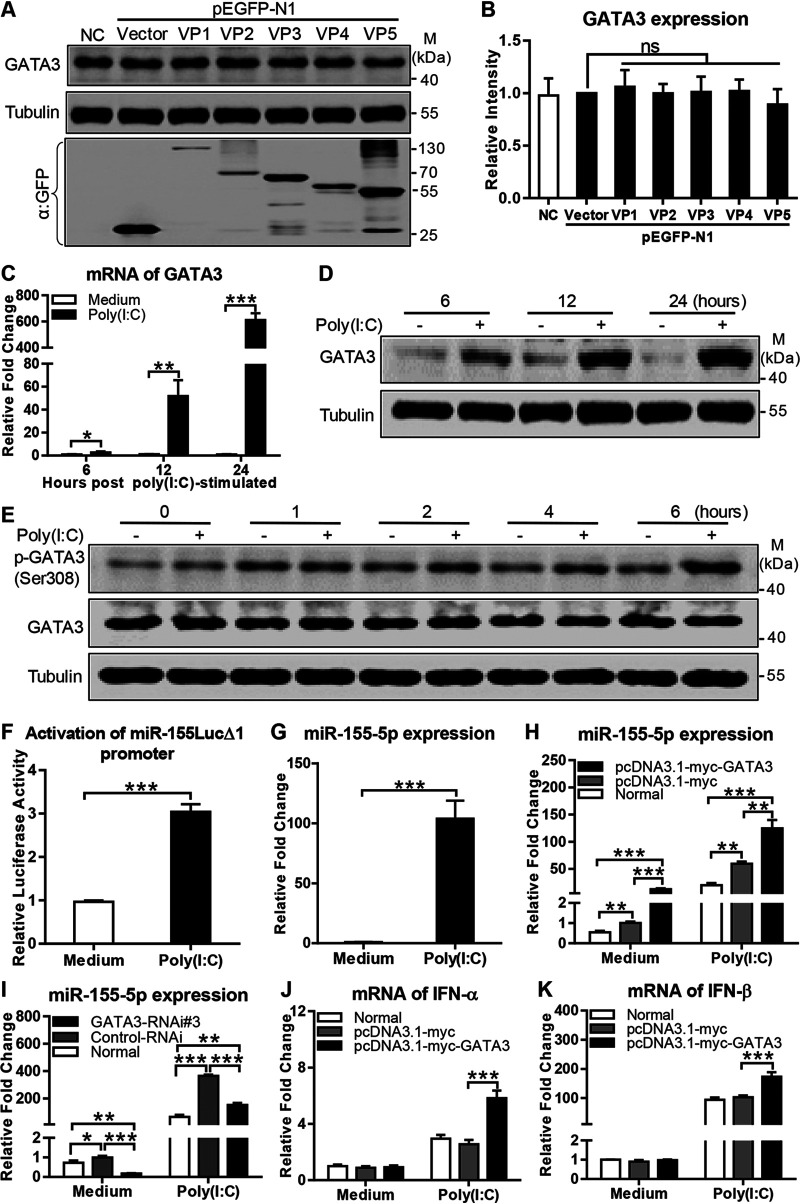
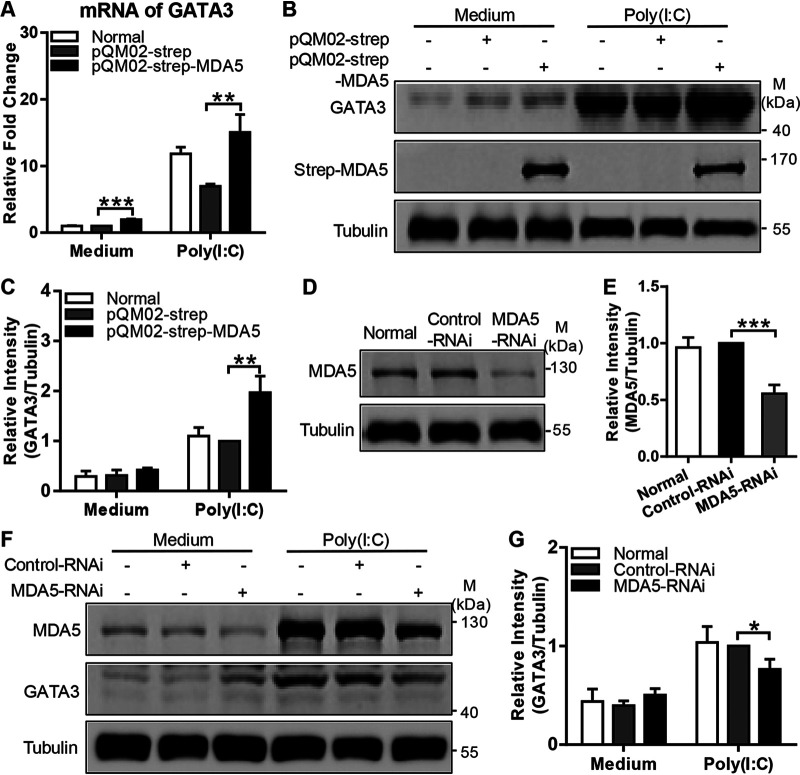
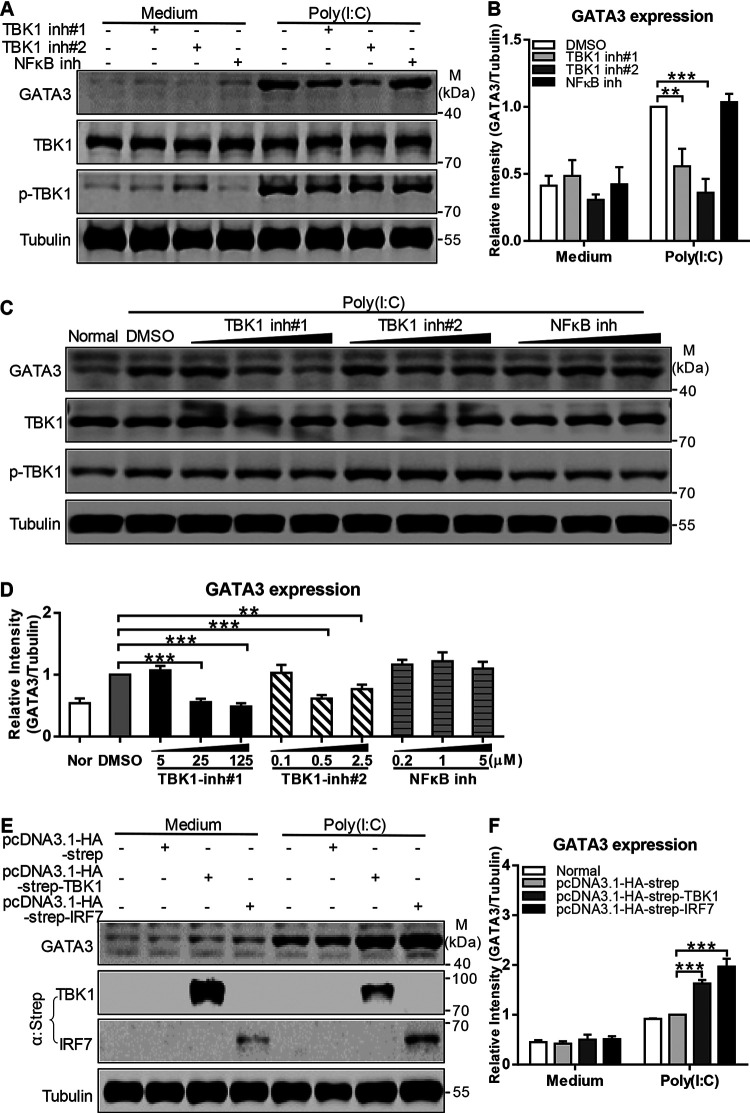
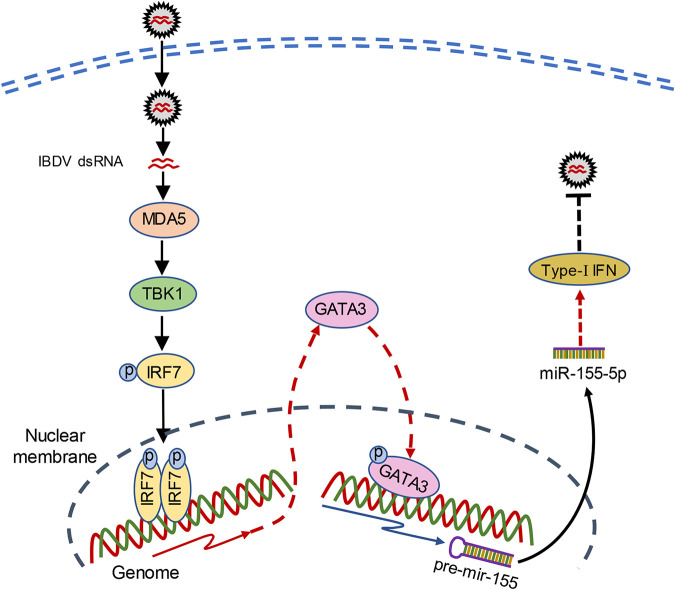
Recognition of viral RNAs by melanoma differentiation associated gene-5 (MDA5) initiates chicken antiviral response by producing type I interferons. Our previous studies showed that chicken microRNA-155-5p (gga-miR-155-5p) enhanced IFN-β expression and suppressed the replication of infectious burse disease virus (IBDV), a double-stranded RNA (dsRNA) virus causing infectious burse disease in chickens. However, the mechanism underlying IBDV-induced gga-miR-155-5p expression in host cells remains elusive. Here, we show that IBDV infection or poly(I:C) treatment of DF-1 cells markedly increased the expression of GATA-binding protein 3 (GATA3), a master regulator for TH2 cell differentiation, and that GATA3 promoted gga-miR-155-5p expression in IBDV-infected or poly(I:C)-treated cells by directly binding to its promoter. Surprisingly, ectopic expression of GATA3 significantly reduced IBDV replication in DF-1 cells, and this reduction could be completely abolished by treatment with gga-miR-155-5p inhibitors, whereas knockdown of GATA3 by RNA interference enhanced IBDV growth, and this enhancement could be blocked with gga-miR-155-5p mimics, indicating that GATA3 suppressed IBDV replication by gga-miR-155-5p. Furthermore, our data show that MDA5 is required for GATA3 expression in host cells with poly(I:C) treatment, so are the adaptor protein TBK1 and transcription factor IRF7, suggesting that induction of GATA3 expression in IBDV-infected cells relies on MDA5-TBK1-IRF7 signaling pathway. These results uncover a novel role for GATA3 as an antivirus transcription factor in innate immune response by promoting miR-155 expression, further our understandings of host response against pathogenic infection, and provide valuable clues to the development of antiviral reagents for public health. IMPORTANCE Gga-miR-155-5p acts as an important antivirus factor against IBDV infection, which causes a severe immunosuppressive disease in chicken. Elucidation of the mechanism regulating gga-miR-155-5p expression in IBDV-infected cells is essential to our understandings of the host response against pathogenic infection. This study shows that transcription factor GATA3 initiated gga-miR-155-5p expression in IBDV-infected cells by directly binding to its promoter, suppressing viral replication. Furthermore, induction of GATA3 expression was attributable to the recognition of dsRNA by MDA5, which initiates signal transduction via TBK1 and IRF7. Thus, it is clear that IBDV induces GATA3 expression via MDA5-TBK1-IRF7 signaling pathway, thereby suppressing IBDV replication by GATA3-mediated gga-miR-155-5p expression. This information remarkably expands our knowledge of the roles for GATA3 as an antivirus transcription factor in host innate immune response particularly at an RNA level and may prove valuable in the development of antiviral drugs for public health.

Keywords: GATA3; IBDV infection; miR-155.


Conflict of interest statement

The authors declare no conflict of interest.

Figures

FIG 1
FIG 1
Activation of gga-miR-155-5p promoter by IBDV infection. (A) Genomic constitution of the BIC gene of chickens and humans. The gray box represents the exon of BIC, the black straight line represents the BIC intron, and the red box represents the pre-miR-155. (B and C) Infection of DF-1 cells with IBDV activated gga-miR-155-5p promoter. DF-1 cells were cotransfected with pGL3-miR-155Luc and pRL-TK. At 12 h posttransfection, the cells were infected with IBDV with an MOI of 0.1 (B) or with different doses (an MOI of 0.01, 0.1, 1, or 10) (C). Cell lysates were prepared, and luciferase reporter gene assays were performed at the indicated time points (12, 24, 36, or 48 h) after IBDV infection (B) or at 24 h after IBDV infection with different doses (C). (D) Schematic diagram of truncated pGL3-miR-155Luc plasmids (from Δ1 to Δ6). (E) DF-1 cells were seeded in 24-well plates and transfected with full-length pGL3-miR-155Luc, truncated pGL3-miR-155Luc (from Δ1 toΔ6) or pGL3-basic as controls. pRL-TK plasmid was added to each transfection as a control. At 12 h posttransfection, the cells were infected with IBDV at an MOI of 0.1. Cell lysates were prepared and luciferase reporter gene assays were performed 24 h after IBDV infection. (F) DF-1 cells were cotransfected with pGL3-miR-155LucΔ1 and pRL-TK, infected with IBDV at the indicated doses, and subjected to luciferase reporter gene assays as described above. The firefly luciferase activities were normalized to the Renilla luciferase activities and plotted relative to mock controls. The data are representative of three independent experiments and presented as means ± the standard deviations (SD). ***, P < 0.001; **, P < 0.01.
FIG 2
FIG 2
GATA3 regulated gga-miR-155-5p expression. (A) Prediction of the potential binding sites of GATA3 in the promoter region (–223 to +58) of gga-miR-155-5p determined using the JASPAR, Animal TFDB, and ALGGEN-PROMO databases. (B) Effect of GATA3 overexpression on pGL3-miR-155LucΔ1 promoter activation. DF-1 cells were cotransfected with pGL3-miR-155LucΔ1 and pcDNA3.1-myc-GATA3 or empty vector as controls. pRL-TK plasmid was added to each transfection as a control. At 24 h posttransfection, cell lysates were prepared, and luciferase reporter gene assays were performed. (C) Effect of GATA3 overexpression on gga-miR-155-5p expression. DF-1 cells were transfected with pcDNA3.1-myc-GATA3 or empty vector as controls. At 24 h posttransfection, total microRNAs (miRNAs) were extracted, and qRT-PCR was performed to detect gga-miR-155-5p transcripts. The expression of U6 snRNA was used as an internal control. (D) Effect of GATA3 overexpression on pGL3-miR-155LucΔ1 promoter activation during IBDV infection. DF-1 cells were treated as described above. At 24 h posttransfection, the cells were infected with IBDV at an MOI of 0.1. At 24 h after infection, cell lysates were prepared, and luciferase reporter gene assays were performed. (E) Effect of GATA3 overexpression on gga-miR-155-5p expression during IBDV infection. DF-1 cells were transfected as described above and infected with IBDV at an MOI of 0.1. At 24 h postinfection, total miRNAs were extracted, and qRT-PCR was performed to detect gga-miR-155-5p transcripts. (F and G) Effect of GATA3-RNAi on endogenous GATA3 expression in DF-1 cells. DF-1 cells were double transfected with siRNA constructs (GATA3-RNAi#1 to RNAi#3) or siRNA controls at a 24-h interval. At 24 h after the second transfection, cell lysates were prepared and examined by Western blotting. Tubulin was used as an internal control. The band intensities for GATA3 in panel F were quantitated by densitometry as shown in panel G. (H) Effect of GATA3 RNAi on pGL3-miR-155Δ1 promoter activation in IBDV-infected cells. DF-1 cells were cotransfected with pGL3-miR-155LucΔ1 and GATA3-RNAi#3 or controls. pRL-TK plasmid was added to each transfection as a control. Double transfections of cells with GATA3-RNAi#3 or controls were performed at a 24-h interval. At 24 h after the second transfection, cells were infected with IBDV at an MOI of 0.1. At 24 h after infection, cell lysates were prepared, and luciferase reporter gene assays were performed. (I) Effect of GATA3 RNAi on the expression of gga-miR-155-5p in IBDV-infected cells. DF-1 cells were transfected with GATA3-RNAi#3 or controls as described above, followed by infection with IBDV at an MOI of 0.1. At 24 h after infection, total miRNAs were extracted, and qRT-PCR was performed to detect gga-miR-155-5p transcripts. The data are representative of three independent experiments and presented as means ± the SD. ***, P < 0.001; **, P < 0.01; *, P < 0.05.
FIG 3
FIG 3
IBDV infection increased GATA3 expression. (A) The mRNA expression of GATA3 increased in IBDV-infected cells. DF-1 cells were mock infected or infected with IBDV at an MOI of 0.1. At different time points (6, 12, and 24 h) after IBDV infection, total RNAs were extracted, and qRT-PCR was performed to detect GATA3 transcripts. The mRNA expression of GAPDH was used as an internal control. (B and C) IBDV infection increased GATA3 protein expression in DF-1 cells. DF-1 cells were infected with IBDV as described above. At different time points (12, 24, and 48 h) after IBDV infection, cell lysates were prepared and examined by Western blotting with anti-GATA3, anti-VP4, and anti-tubulin antibodies. Endogenous tubulin expression was used as an internal control. The band intensities for GATA3 in panel B were quantitated by densitometry as shown in panel C. The relative levels of GATA3 were calculated as the band density of GATA3 divided by that of tubulin. (D) The mRNA expression of GATA3 increased in IBDV-infected cells in a dose-dependent manner. DF-1 cells were mock infected or infected with IBDV at an MOI of 0.01, 0.1, 1, or 10. At 24 h after infection, total RNAs were extracted, and qRT-PCR was performed to detect GATA3 transcripts. The expression of GAPDH was used as an internal control. (E and F) The protein expression of GATA3 increased in IBDV-infected cells in a dose-dependent manner. DF-1 cells were mock infected or infected with IBDV at an MOI of 0.01, 0.1, 1, or 10. At 24 h after infection, cell lysates were prepared and examined by Western blotting with anti-GATA3, anti-VP4, and anti-tubulin antibodies. Endogenous tubulin expression was used as an internal control. The band intensities for GATA3 in panel E were quantitated by densitometry as shown in panel F. The relative levels of GATA3 were calculated as described above for panel C. (G to I) The mRNA and protein expressions of GATA3 increased in DT40 cells after IBDV infection. DT40 cells were mock infected or infected with IBDV at an MOI of 0.1, 1, or 10. At 24 h after infection, total RNAs were extracted and qRT-PCR was performed to detect GATA3 transcripts (G). Cell lysates were prepared and examined by Western blotting with anti-GATA3, anti-VP4, and anti-tubulin antibodies (H). The band intensities for GATA3 in panel H were quantitated by densitometry as shown in panel I. (J) Examination of GATA3 in the tissues of IBDV-infected chickens. Tissue samples were collected from different organs (bursa of Fabricius, spleen, thymus, pancreas, heart, liver, and kidney) of mock-infected (n = 3) or IBDV-infected (n = 3) chickens. Total RNAs were extracted from the tissue samples, and GATA3 transcripts were examined by qRT-PCR. The mRNA expression of GAPDH was used as an internal control. The relative levels of GATA3 mRNA were calculated as the mRNA expression of GATA3 in the tissue sample divided by that of GAPDH in the same sample. The relative fold change of GATA3 expression in each tissue sample was normalized in relative to that of GATA3 in bursa of Fabricius in mock-infected chickens. The data are representative of three independent experiments and are presented as means ± the SD. ***, P < 0.001; **, P < 0.01; *, P < 0.05.
FIG 4
FIG 4
IBDV infection increased phosphorylation, nuclear translocation of GATA3 and its binding to the gga-miR-155-5p promoter. (A and B) IBDV infection enhanced phosphorylation of GATA3 on Ser308 residues. DF-1 cells were mock infected or infected with IBDV at an MOI of 1. Cells were harvested at different time points (0, 15, 30, 60, 90, or 120 min) after IBDV infection, and cell lysates were examined by Western blotting with anti-GATA3, anti-pGATA3 (Ser308), anti-VP4, and anti-tubulin antibodies. Tubulin expression was used as an internal control. The band intensities for p-GATA3 in panel A were quantitated by densitometry as shown in panel B. The relative levels of p-GATA3 were calculated as the band density of p-GATA3 in each sample divided by that of GATA3 in the same sample. (C and D) Examination of GATA3 in the cytoplasm and nuclei of DF-1 cells with IBDV infection. DF-1 cells were infected with IBDV at an MOI of 0.1. At 24 h after infection, total cell lysates and nuclear and cytoplasmic proteins were prepared respectively, and subjected to Western blot assay using anti-GATA3, anti-tubulin, and anti-lamin B1 antibodies. Endogenous tubulin and lamin B1 expression were used as cytoplasmic and nuclear internal controls, respectively. The band intensities for GATA3 in panel C were quantitated by densitometry as shown in panel D. (E) Examination of GATA3 in DF-1 cells with IBDV infection using confocal laser scanning microscopy. DF-1 cells were seeded on 24-well plates and cultured overnight, followed by infection with IBDV at an MOI of 0.1. At 24 h postinfection, cells were fixed and probed with anti-GATA3 antibodies, followed by incubation with FITC-conjugated goat anti-mouse antibodies (green). Cell nuclei were counterstained with DAPI (blue). Cells were observed under a confocal laser scanning microscope. Scale bar, 10 μm. (F) Schematic diagram of the position of the EMSA probe on the gga-miR-155-5p promoter. (G) Determination of the binding region of GATA3 in gga-miR-155-5p promoter by EMSA. The mixtures of nucleoprotein with the indicated probes in the presence or absence of anti-GATA3 MAb were incubated at room temperature for 25 min and then subjected to EMSA using a chemiluminescent EMSA kit. (H and I) Examination of the binding of GATA3 to gga-miR-155-5p promoter by ChIP analysis. DF-1 cells were infected with IBDV as described above and subjected to a ChIP assay using a ChIP kit. The enrichment of GATA3 was analyzed by PCR (H) or qPCR (I) assays. The data are representative of three independent experiments and are presented as means ± the SD. ***, P < 0.001; **, P < 0.01; *, P < 0.05.
FIG 5
FIG 5
Ectopic expression of GATA3 suppressed IBDV replication, and this suppression could be blocked by gga-miR-155-5p inhibitors. (A and B) Overexpression of GATA3 inhibited viral proteins VP4 and VP5 expressions in IBDV-infected cells. DF-1 cells were transfected with pcDNA3.1-myc-GATA3 or empty vector as control. At 24 h posttransfection, cells were infected with IBDV at an MOI of 0.1. At 24 h after infection, cell lysates were prepared and examined by Western blotting with anti-myc, anti-VP4, and anti-VP5 antibodies. Endogenous GAPDH expression was used as an internal control. The band intensities for VP4 and VP5 in panel A were quantitated by densitometry as shown in panel B. The relative levels of VP4 and VP5 were calculated as the band density of VP4 or VP5 divided by that of GAPDH. (C) Detection of IBDV VP4 expression in IBDV-infected cells by IFA. DF-1 cells were treated as in panel A, examined by IFA with anti-VP4 antibody, followed by incubation with FITC-conjugated goat anti-mouse IgG antibodies, and observed under a fluorescence microscope. The pictures in the upper panels were taken under a fluorescence microscope, and those in the lower panels were obtained under a light microscope at 100× magnification. Scale bar, 100 μm. (D) Overexpression of GATA3 suppressed IBDV replication. DF-1 cells were treated as described above for panel A. At different time points (12, 24, 48, and 72 h) after IBDV infection, the viral loads in the cell cultures were determined by TCID50 assays. (E and F) gga-miR-155-5p inhibitors blocked GATA3-induced suppression of IBDV replication. DF-1 cells were cotransfected with pcDNA3.1-myc-GATA3 plus gga-miR-155-5p inhibitors or miRNA inhibitor as control. At 24 h posttransfection, cells were infected with IBDV at an MOI of 0.1. At 24 h after infection, cell lysates were examined by Western blotting as described above (E). The viral loads in the cell cultures were determined by using a TCID50 assay (F). The data are representative of three independent experiments and are presented as means ± the SD. ***, P < 0.001; **, P < 0.01.
FIG 6
FIG 6
Knockdown of GATA3 by RNAi facilitated IBDV replication. (A and B) IBDV VP4 expression increased in cells treated with siRNA against GATA3. DF-1 cells were double transfected with GATA3-siRNA (no. 1 to 3) or siRNA controls at a 24-h interval. At 24 h after the second transfection, cells were infected with IBDV at an MOI of 0.1. At 24 h after infection, cell lysates were prepared and examined by Western blotting with anti-GATA3, anti-VP4, and anti-tubulin antibodies. Endogenous tubulin expression was used as an internal control. The band intensities for GATA3 in panel A were quantitated by densitometry as shown in panel B. The relative levels of VP4 were calculated as the band density of VP4 divided by that of tubulin. (C) Detection of VP4 expression in IBDV-infected cells by IFA. DF-1 cells were treated as described above for panel A. The cells were examined by IFA assay with anti-VP4 MAb, followed by incubation with FITC-conjugated goat anti-mouse IgG antibodies, and observed under a fluorescence microscope. The pictures in the upper panels were taken under a fluorescence microscope, and those in the lower panels were taken under a light microscope at 100× magnification. Scale bar, 100 μm. (D) Knockdown of GATA3 in DF-1 cells by RNAi enhanced IBDV growth. DF-1 cells were treated as described above for panel A. At different time points (12, 24, 48, and 72 h) after IBDV infection, the viral loads in the cell cultures were determined by TCID50 assays. (E and F) Transfection of DF-1 cells with gga-miR-155-5p mimics blocked GATA3 RNAi-mediated enhancement of IBDV replication. DF-1 cells were transfected with GATA3-RNAi-#3, along with gga-miR-155-5p mimics or miRNA controls, followed by infection with IBDV at an MOI of 0.1. At 24 h after infection, cell lysates were prepared and examined by Western blotting as described above (E). The viral loads in the cell cultures were determined by TCID50 assays (F). The data are representative of three independent experiments and are presented as means ± the SD. **, P < 0.01.
FIG 7
FIG 7
GATA3 expression and phosphorylation increased in poly(I:C)-treated cells, and GATA3 was required for gga-miR-155-5p expression. (A and B) IBDV viral protein did not affect GATA3 expression. DF-1 cells were transfected with pEGFP-N1 empty vectors or eukaryotic plasmids expressing viral protein-GFP fusions containing VP1, VP2, VP3, VP4, or VP5 of IBDV. At 24 h posttransfection, the cell lysates were prepared and subjected to a Western blot assay with anti-GATA3 and anti-GFP MAb. The band densities for GATA3 in panel A were quantitated by densitometry as shown in panel B. (C and D) Treatment of DF-1 cells with poly(I:C) induced GATA3 expression. DF-1 cells were transfected with poly(I:C) at a final concentration of 2 μg/mL. At different time points (6, 12, and 24 h) after poly(I:C) treatment, GATA3 mRNAs were examined by qPCR (C), and GATA3 proteins were examined by Western blotting with anti-GATA3 antibody (D). (E) Treatment of cells with poly(I:C) enhanced phosphorylation of GATA3 on Ser308 residues. DF-1 cells were treated with poly(I:C) as described above. At different time points (0, 1, 2, 4, and 6 h) after poly(I:C) treatment, cell lysates were prepared and examined by Western blotting with anti-p-GATA3 (Ser308), anti-GATA3, and anti-tubulin antibodies. Tubulin expression was used as an internal control. (F) Treatment of cells with poly(I:C) enhanced activation of gga-miR-155-5p promoter. DF-1 cells were cotransfected with pGL3-miR-155LucΔ1 and pRL-TK. At 12 h posttransfection, cells were treated with poly(I:C) as described above. At 24 h after poly(I:C) treatment, cell lysates were prepared, and luciferase reporter gene assays were performed. The firefly luciferase activities were normalized to the Renilla luciferase activities and plotted relative to the controls. (G) Treatment of cells with poly(I:C) enhanced gga-miR-155-5p expression. DF-1 cells were treated with poly(I:C) as described above. At 24 h after poly(I:C) treatment, total miRNAs were extracted, and qRT-PCR was performed to detect gga-miR-155-5p transcripts. The expression of U6 snRNA was used as an internal control. (H) Overexpression of GATA3 enhanced gga-miR-155-5p expression in poly(I:C)-treated cells. DF-1 cells were transfected with pcDNA3.1-myc-GATA3 or empty vector as controls. At 24 h posttransfection, cells were treated with poly(I:C) as described above. At 24 h after poly(I:C) treatment, total miRNAs were extracted, and qRT-PCR was performed to detect gga-miR-155-5p transcripts. (I) Knockdown of GATA3 by RNAi reduced gga-miR-155-5p expression in poly(I:C)-treated cells. DF-1 cells were double transfected with GATA3-RNAi#3 or controls at a 24-h interval. At 24 h after the second transfection, cells were treated with poly(I:C) as described above. At 24 h after poly(I:C) treatment, gga-miR-155-5p transcripts were examined as described above for panel G. (J and K) Ectopic expression of GATA3 promoted the expression of IFN-α and IFN-β in DF-1 cells after poly(I:C) treatment. DF-1 cells were transfected with pcDNA3.1-myc-GATA3 or empty vector as controls. At 24 h posttransfection, cells were treated with poly(I:C) at a final concentration of 2 μg/mL. IFN-α/β mRNAs were examined by qRT-PCR 12 h after poly(I:C) treatment. The data are representative of three independent experiments and are presented as means ± the SD. ***, P < 0.001; **, P < 0.01; *, P < 0.05.
FIG 8
FIG 8
MDA5 was required for poly(I:C)-induced GATA3 expression. (A to C) Overexpression of MDA5 increased GATA3 expression in poly(I:C)-treated cells. DF-1 cells were transfected with pQM02-strep-MDA5 or empty vector as controls. At 24 h after transfection, cells were treated with poly(I:C) at a final concentration of 2 μg/mL. GATA3 mRNAs were measured by qRT-PCR at 6 h after poly(I:C) treatment (A), and GATA3 proteins were by Western blot assay with anti-GATA3, anti-strep, and anti-tubulin antibodies at 24 h after poly(I:C) treatment (B), endogenous GAPDH mRNA (A), and tubulin protein (B) were used as internal controls respectively. The band intensities for GATA3 in panel B were quantitated by densitometry as shown in panel C. The relative levels of GATA3 were calculated as the band density of GATA3 divided by that of tubulin. (D and E) Effects of knocking down MDA5 by RNAi on endogenous MDA5 expression in DF-1 cells. DF-1 cells were double transfected with siRNA constructs (MDA5-RNAi) at a 24-h interval. At 48 h after the second transfection, cell lysates were prepared and subjected to Western blot assay with anti-MDA5 and anti-tubulin antibodies. Endogenous tubulin expression was used as an internal control. The band intensities for MDA5 in panel D were quantitated by densitometry as shown in panel E. (F and G) Knockdown of MDA5 reduced GATA3 expression in poly(I:C)-treated cells. DF-1 cells were double transfected with MDA5-RNAi or RNAi controls at a 24-h interval. At 24 h after the second transfection, cells were treated with poly(I:C) as described above for panel A. The cells were harvested at 24 h after poly(I:C) treatment and subjected to Western blot assay with anti-GATA3, anti-MDA5, and anti-tubulin antibodies. Endogenous tubulin expression was used as an internal control. The band intensities for GATA3 in panel F were quantitated by densitometry as shown in panel G. The relative levels of GATA3 were calculated as described above for panel C. The data are representative of three independent experiments and are presented as means ± the SD. ***, P < 0.001; **, P < 0.01; *, P < 0.05.
FIG 9
FIG 9
TBK1 and IRF7 were required for poly(I:C)-induced GATA3 expression. (A and B) TBK1 inhibitors blocked poly(I:C)-induced GATA3 expression. DF-1 cells were treated with two TBK1 inhibitors: #1, Amlexanox (20 μM); #2, TBK1/IKKε-IN-2 (500 nM), or NF-κB inhibitor BAY 11-7082 (2uM) or DMSO as controls for 2 h, followed by treatment with poly(I:C) at a final concentration of 2 μg/mL. At 24 h after poly(I:C) treatment, GATA3 expression was examined by Western blotting with anti-GATA3 antibody. The band intensities for GATA3 in panel A were quantitated by densitometry as shown in panel B. The relative levels of GATA3 were calculated as the band density of GATA3 divided by that of tubulin. (C and D) DF-1 cells were treated with two TBK1 inhibitors: #1, Amlexanox (5, 25, and 125 μM), and #2, TBK1/IKKε-IN-2 (0.1, 0.5, and 2.5 μM), or NF-κB inhibitor BAY 11-7082 (0.2, 1, and 5 μM) or DMSO as controls for 2 h, followed by treatment with poly(I:C) at a final concentration of 2 μg/mL. At 24 h after poly(I:C) treatment, GATA3 expression was examined by Western blotting with anti-GATA3 antibody. The band intensities for GATA3 in panel C were quantitated by densitometry as shown in panel D. (E and F) Overexpression of TBK1 and IRF7 in DF-1 cells enhanced poly(I:C)-induced GATA3 expression. DF-1 cells were transfected with pcDNA3.1-HA-strep-TBK1, pcDNA3.1-HA-strep-IRF7, or pcDNA3.1-HA-strep. At 24 h after transfection, cells were treated with poly(I:C) as described above for panel A. At 24 h after poly(I:C) treatment, cell lysates were prepared and subjected to Western blot assay with anti-GATA3 and anti-tubulin antibodies. Endogenous tubulin was used as an internal control. The band intensities for GATA3 in panel E were quantitated by densitometry as shown in panel F. The relative levels of GATA3 were calculated as described above for panel B. The data are representative of three independent experiments and are presented as means ± the SD. ***, P < 0.001; **, P < 0.01.
FIG 10
FIG 10
Treatment of DF-1 cells with IFN-β did not affect GATA3 expression. (A) Examination of IFN-β expression in cell culture supernatants and whole-cell lysates by Western blotting with anti-strep and anti-tubulin antibodies. (B) Purification, quantitation, and determination of IFN-β. Chicken IFN-β was purified from the supernatant of pQM01-strep-IFN-β-transfected 293T cell cultures with affinity chromatography using a Strep-tag column and quantitated by SDS-PAGE (the red arrow in panel B points to the protein band of purified IFN-β), with a reference to BSA on the same SDS-PAGE, and determined by Western blotting (WB) with anti-strep antibodies. (C and D) Effect of IFN-β treatment on GATA3 expression in DF-1 cells. DF-1 cells were treated with IFN-β at different concentrations (0, 0.01, 0.1, 1, and 10 μg/mL). At 24 h after IFN-β treatment, cell lysates were prepared and subjected to Western blot analysis with anti-GATA3 or anti-tubulin antibodies. Endogenous tubulin expression was used as internal control. The band intensities for GATA3 in panel C were quantitated by densitometry as shown in panel D. ns, no significant difference as analyzed by Student t test.
FIG 11
FIG 11
Graphic model for the antivirus role of GATA3 in host response against IBDV infection. Recognition of viral dsRNA in host cells by cellular MDA5 initiates host response against IBDV infection by activating TBK1-IRF7 signaling pathway and promoting GATA3 expression. GATA3 promotes gga-miR-155-5p expression by directly binding to its promoter, suppressing IBDV replication via gga-miR-155-5p-mediated enhancement of type I-IFN expression.

Similar articles

Cited by

References

    1. Bartel D. 2004. MicroRNAs: genomics, biogenesis, mechanism, and function. Cell 116:281–297. 10.1016/s0092-8674(04)00045-5. - DOI - PubMed
    1. Qiu H, Liu N, Luo L, Zhong J, Tang Z, Kang K, Qu J, Peng W, Liu L, Li L, Gou D. 2016. MicroRNA-17–92 regulates myoblast proliferation and differentiation by targeting the ENH1/Id1 signaling axis. Cell Death Differ 23:1658–1669. 10.1038/cdd.2016.56. - DOI - PMC - PubMed
    1. Lu J, Getz G, Miska E, Alvarez-Saavedra E, Lamb J, Peck D, Sweet-Cordero A, Ebert B, Mak R, Ferrando A, Downing J, Jacks T, Horvitz H, Golub T. 2005. MicroRNA expression profiles classify human cancers. Nature 435:834–838. 10.1038/nature03702. - DOI - PubMed
    1. Fu M, Wang B, Chen X, He Z, Wang Y, Li X, Cao H, Zheng S. 2018. MicroRNA gga-miR-130b suppresses infectious bursal disease virus replication via targeting of the viral genome and cellular suppressors of cytokine signaling 5. J Virol 92:e01646-17. 10.1128/JVI.01646-17. - DOI - PMC - PubMed
    1. Lam I, Chow J, Lau C, Chan V. 2018. MicroRNA-mediated immune regulation in rheumatic diseases. Cancer Lett 431:201–212. 10.1016/j.canlet.2018.05.044. - DOI - PubMed

MeSH terms

LinkOut - more resources