. 2022 Mar 2;63(3):21.
doi: 10.1167/iovs.63.3.21.

Functional and Structural Development of Mouse Cone Photoreceptor Ribbon Synapses

Affiliations

Functional and Structural Development of Mouse Cone Photoreceptor Ribbon Synapses

Adam Davison et al. Invest Ophthalmol Vis Sci. .

Abstract

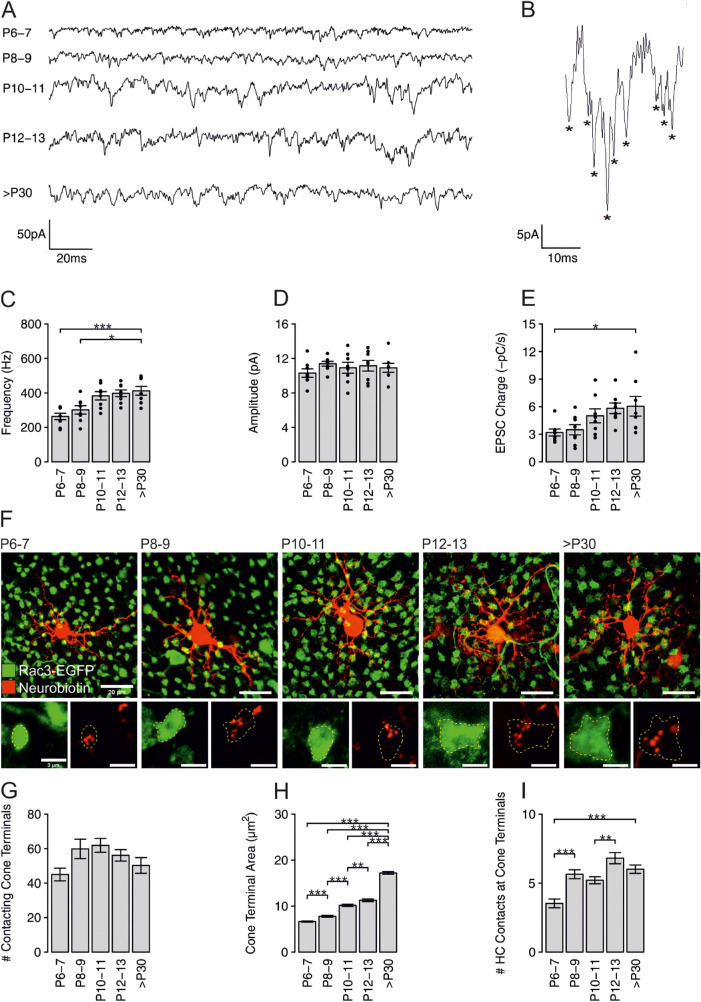
Purpose: Cone photoreceptors of the retina use a sophisticated ribbon-containing synapse to convert light-dependent changes in membrane potential into release of synaptic vesicles (SVs). We aimed to study the functional and structural maturation of mouse cone photoreceptor ribbon synapses during postnatal development and to investigate the role of the synaptic ribbon in SV release.

Methods: We performed patch-clamp recordings from cone photoreceptors and their postsynaptic partners, the horizontal cells during postnatal retinal development to reveal the functional parameters of the synapses. To investigate the occurring structural changes, we applied immunocytochemistry and electron microscopy.

Results: We found that immature cone photoreceptor terminals were smaller, they had fewer active zones (AZs) and AZ-anchored synaptic ribbons, and they produced a smaller Ca2+ current than mature photoreceptors. The number of postsynaptic horizontal cell contacts to synaptic terminals increased with age. However, tonic and spontaneous SV release at synaptic terminals stayed similar during postnatal development. Multiquantal SV release was present in all age groups, but mature synapses produced larger multiquantal events than immature ones. Remarkably, at single AZs, tonic SV release was attenuated during maturation and showed an inverse relationship with the appearance of anchored synaptic ribbons.

Conclusions: Our developmental study suggests that the presence of synaptic ribbons at the AZs attenuates tonic SV release and amplifies multiquantal SV release. However, spontaneous SV release may not depend on the presence of synaptic ribbons or voltage-sensitive Ca2+ channels at the AZs.


Conflict of interest statement

Disclosure: A. Davison, None; K. Gierke, None; J.H. Brandstätter, None; N. Babai, None

Figures

Figure 1.
Figure 1.
Postnatal changes in EPSCs recorded from HCs and in HC and cone photoreceptor synaptic terminal connectivity. (A) Representative EPSC traces at different developmental stages. HCs were held at a Vh of −60 mV. (B) Zoomed in view of tonic EPSCs recorded from a matured HC. Asterisks indicate EPSC events. (C) The mean frequency of tonic EPSCs. Significance was determined by one-way ANOVA test (P < 0.001, n = 8 cells). Tukey's multiple comparisons test (>P30 vs. P6–P7: P < 0.001, >P30 vs. P8–P9: P = 0.01). (D) Mean amplitude of tonic EPSCs. Significance was determined by one-way ANOVA test (P = 0.953, n = 8 cells). (E) The mean charge transfer rate of tonic EPSCs (−pC/s). Significance was determined by the Kruskal–Wallis test (P = 0.0077, n = 8 cells). Post hoc Mann–Whitney U test (>P30 vs. P6–P7: P = 0.023). (F) Immunofluorescence staining of horizontal retinal slices with labelling of individual HCs loaded with neurobiotin (red) and EGFP-labelled cone photoreceptor terminals (green). Dashed yellow lines outline cone photoreceptor terminals. (G) The mean number of contacting cone photoreceptor terminals per HC. Significance was determined by one-way ANOVA test (P = 0.0695, n = 6–9 cells). (H) The mean cone photoreceptor terminal area. Significance was determined by the Kruskal–Wallis test (P < 0.001, n = 142–149 terminals). Post hoc Mann–Whitney U test (P < 0.001 for all age groups vs. >P30, P6–P7 vs. P8–P9: P < 0.001, P8–P9 vs. P10–P11: P < 0.001, P10–P11 vs. P12–P13: P = 0.0098). (I) The mean number of HC contacts at cone photoreceptor terminals. Significance was determined by Kruskal-Wallis test (P < 0.001, n = 51–119 terminals). Post hoc Mann–Whitney U test (P6–P7 vs. P8–P 9: P < 0.001, >P30 vs. P6–P 7: P < 0.001, P10–P 11 vs. P12–P 13: P = 0.0037).
Figure 2.
Figure 2.
Postnatal changes in tonic and spontaneous vesicle release recorded from cone photoreceptors. (A) Representative traces of IAGlu events recorded from developing cone photoreceptors held at a Vh of −40 mV. (B) Zoomed in view of IAGlu events at >P30. Asterisks indicate synaptic events. (C) Representative trace of a recurrent, large amplitude IAGlu event at >P30. (D) The mean frequency of events. Significance was determined by one-way ANOVA test (P = 0.262, n = 4–8 cells). (E) The mean amplitude of events. Significance was determined by one-way ANOVA test (P = 0.998, n = 4–8 cells). (F) Cumulative probability plot of the event amplitude (bin width = 1 pA). (G) The mean charge transfer rate of events. Significance was determined by one-way ANOVA test (P = 0.110, n = 4–8 cells). (H) The mean charge transfer of multiquantal events. Significance was determined by the Kruskal–Wallis test (P = 0.001, n = 4–8 cells). Post hoc Mann–Whitney U test (>P30 vs. P6–P7: P = 0.0052, >P30 vs. P8–P9: P = 0.0052, >P30 vs. P10–P11: P = 0.0052, >P30 vs. P12–P13: P = 0.0101). (I) Representative traces of IAGlu events recorded from developing cone photoreceptors at a Vh of –65 mV. (J) The mean frequency of events. Significance was determined by the Kruskal–Wallis test (P = 0.283, n = 4–8 cells). (K) The mean amplitude of events. Significance was determined by the Kruskal–Wallis test (P = 0.515, n = 4–8 cells).
Figure 3.
Figure 3.
Postnatal changes in cone photoreceptor ICa. (A) Example cone photoreceptor ICa at the different developmental stages during a voltage ramp protocol from −80 mV to +40 mV, with a speed of 0.1875 mV/ms. (B) The mean amplitude of ICa. Significance was determined by the Kruskal–Wallis test (P < 0.001, n = 5–12 cells). Post hoc Mann–Whitney U tests (>P30 vs. P6–P7: P = 0.0011, >P30 vs. P8–P9: P < 0.001, >P30 vs. P10–P11: P < 0.001, P6–P7 vs. P8–P9: P = 0.0475, P8–P9 vs. P10–P11: P = 0.0292). (C) The mean half-maximal activation of the ICa (V50). Significance was determined by the one-way ANOVA test (P < 0.001, n = 5–12 cells). Tukey's test for multiple comparisons (P6–P7 vs. P8–P9: P < 0.001, >P30 vs. P6–P7: P < 0.001, >P30 vs. P8–P9: P < 0.001, >P30 vs. P10–P11: P = 0.0024, >P30 vs. P12–P13: P < 0.001). (D) The mean ICa slope. Significance was determined by the Kruskal–Wallis test (P < 0.001, n = 5–12 cells). Post hoc Mann–Whitney U tests (P6–P7 vs. P8–P9: P = 0.0032, >P30 vs. P6–P7: P = 0.0244, >P30 vs. P8–P9: P = 0.0032).
Figure 4.
Figure 4.
Postnatal changes in AZ and synaptic ribbon architecture in cone photoreceptor synaptic terminals. (A, B) Immunofluorescence staining of horizontal retinal slices, labelling for cone photoreceptor terminals (green) and (A) the α1f subunit of Cav1.4 voltage-gated Ca2+ channels (red) or (B) synaptic ribbons (ribeye A domain, red), at the different developmental stages. Dashed yellow lines represent the border of individual cone photoreceptor terminals. (C) The mean number of AZs. Significance was determined by the Kruskal–Wallis test (P < 0.001, n = 30–38 terminals). Post hoc Mann–Whitney U tests (P < 0.001 for P30 vs. all other age groups, P6 vs. P8, P = 0.0056, P8 vs. P10: P < 0.001). (D) The mean AZ area per cone photoreceptor terminal. Significance was determined by one-way ANOVA test (P < 0.001, n = 30–38 terminals). Tukey's tests for multiple comparisons (P < 0.001 for P30 vs. all other age groups, P6 vs. P8: P = 0.004, P8 vs. P10: P = 0.044). (E) Mean number of synaptic ribbons per cone photoreceptor terminal. Significance was determined by the Kruskal–Wallis test (P < 0.001, n = 29–34 terminals). Post hoc Mann–Whitney U tests (P < 0.001 for P30 vs. all other age groups, P8 vs. P10: P = 0.0095). (F) The mean length of the synaptic ribbons. Significance was determined by the Kruskal–Wallis test (P < 0.001, n = 164–360 ribbons). Post hoc Mann–Whitney U tests (P < 0.001 for P30 vs. all other age groups, P8 vs. P10: P < 0.001).
Figure 5.
Figure 5.
Ultrastructural analysis of synaptic ribbon development. (A) Representative electron micrographs of cone photoreceptor terminals at the different developmental stages. Yellow arrows indicate attached synaptic ribbons, red arrows indicate free-floating synaptic ribbons. (–) Mean percentage of attached synaptic ribbons. Significance was determined by one-way ANOVA test (P < 0.001, n = 3–4 animals). Post hoc Tukey's tests for multiple comparisons (P < 0.001 for P30 vs. all other age groups).
Figure 6.
Figure 6.
Correlations of the synaptic parameters during development. Data points are the measured synaptic parameters in the examined age groups (P6–P7, P8–P9, P10–P11, P12–P13, and >P30). The standard error of the mean of the x axis and y axis variables are included on all plots. All correlation tests were performed using the Pearson's correlation test. (AC) Cone photoreceptor terminal area plotted against different synaptic parameters. Number of synaptic ribbons (A) (P < 0.001, r = 0.993), ICa (B, P = 0.009, r = 0.960), and AZ area per cone photoreceptor terminal (C) (P = 0.008, r = 0.965). (D) Plot of ICa against the number of AZs per cone photoreceptor terminal (P = 0.0307, r = 0.912). (E12) Plot of tonic SV release per cone photoreceptor against different synaptic parameters. ICa (E1) (P = 0.032, r = 0.911), number of AZs per cone photoreceptor terminal (E2) (P = 0.003, r = 0.983). (F12) Plot of spontaneous SV release per cone photoreceptor against different synaptic parameters. ICa (F1) (P = 0.377, r = 0.512), number of AZs per cone photoreceptor terminal (F2) (P = 0.468, r = 0.432). (G) Plot of multiquantal charge transfer against number of attached synaptic ribbons (P = 0.00168, r = 0.987). (H1) Plot of number of attached synaptic ribbons per cone terminal against tonic SV release (black) and Ica amplitude per AZ (red). (H2) Plot of tonic SV release against attached ribbon content per cone.

Similar articles

Cited by

References

    1. Matthews G, Fuchs P.. The diverse roles of ribbon synapses in sensory neurotransmission. Nat Rev Neurosci. 2010; 11: 812–822. - PMC - PubMed
    1. Bartoletti TM, Jackman SL, Babai N, Mercer AJ, Kramer RH, Thoreson WB.. Release from the cone ribbon synapse under bright light conditions can be controlled by the opening of only a few Ca2+ channels. J Neurophysiol. 2011; 106: 2922–2935. - PMC - PubMed
    1. Feigenspan A, Babai N.. Functional properties of spontaneous excitatory currents and encoding of light/dark transitions in horizontal cells of the mouse retina. Eur J Neurosci. 2015; 42: 2615–2632. - PubMed
    1. Korenbrot JI. Speed, sensitivity, and stability of the light response in rod and cone photoreceptors: facts and models. Prog Retina Eye Res. 2012; 31: 442–466. - PMC - PubMed
    1. Thoreson WB. Transmission at rod and cone ribbon synapses in the retina. Pflug Arch Eur J Phy. 2021; 473: 1469–1491. - PMC - PubMed

Publication types