. 2022 Mar 15;149(6):dev199743.
doi: 10.1242/dev.199743. Epub 2022 Mar 23.

In vitro culture of ovine embryos up to early gastrulating stages

Affiliations

In vitro culture of ovine embryos up to early gastrulating stages

Priscila Ramos-Ibeas et al. Development. .

Abstract

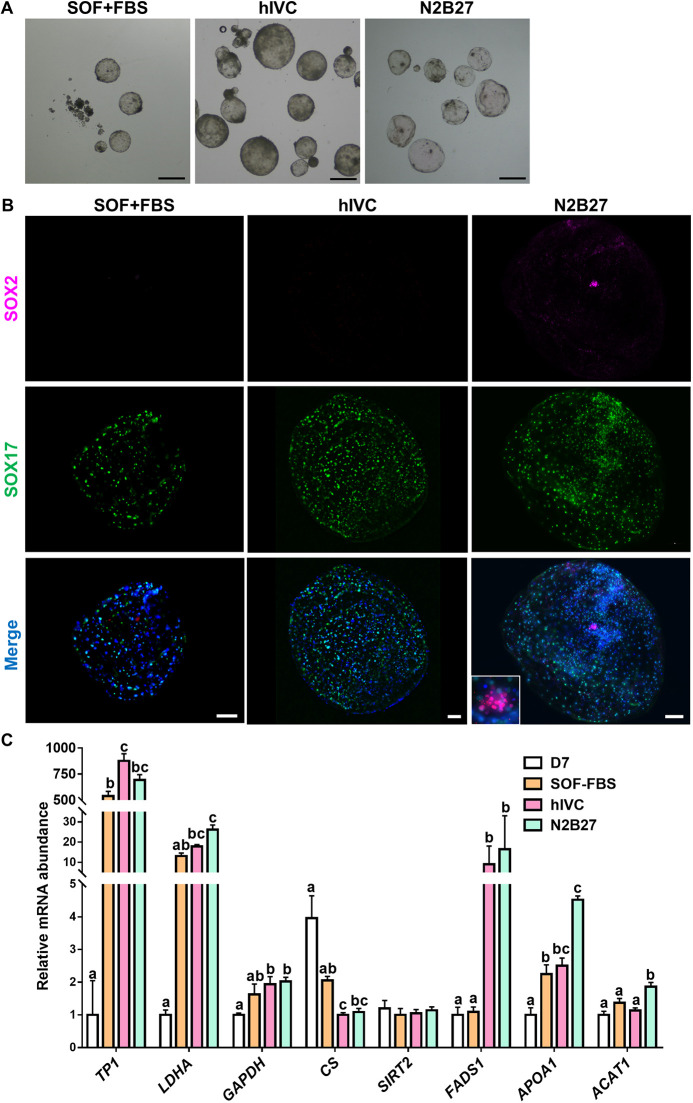
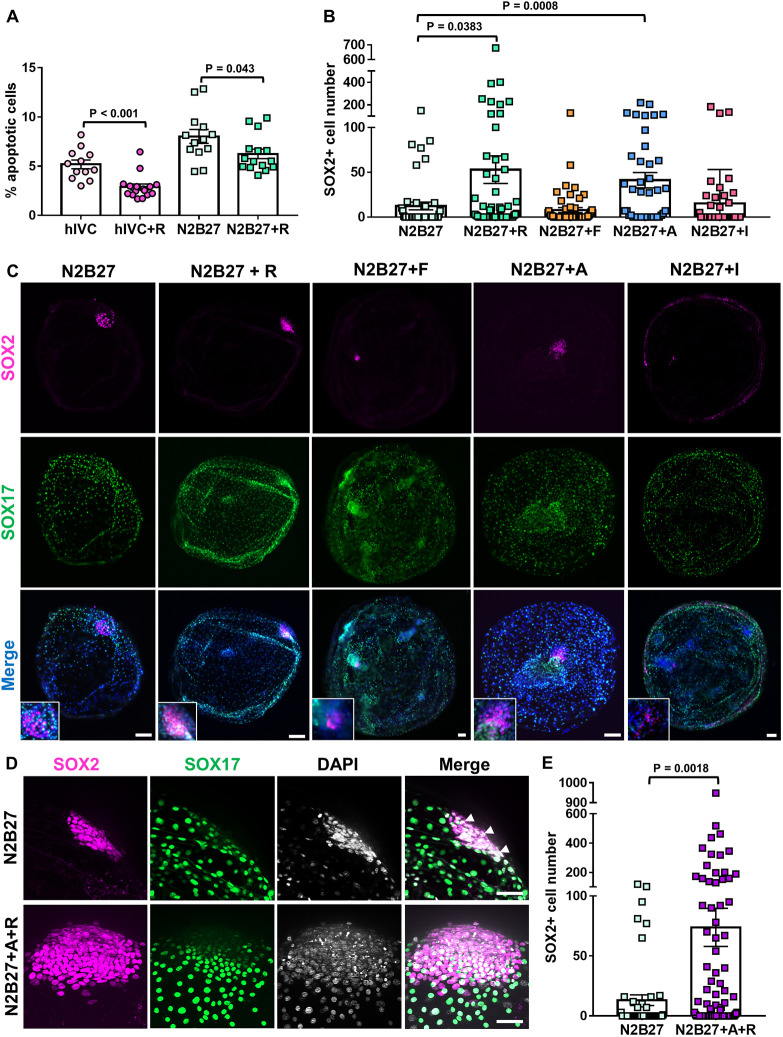
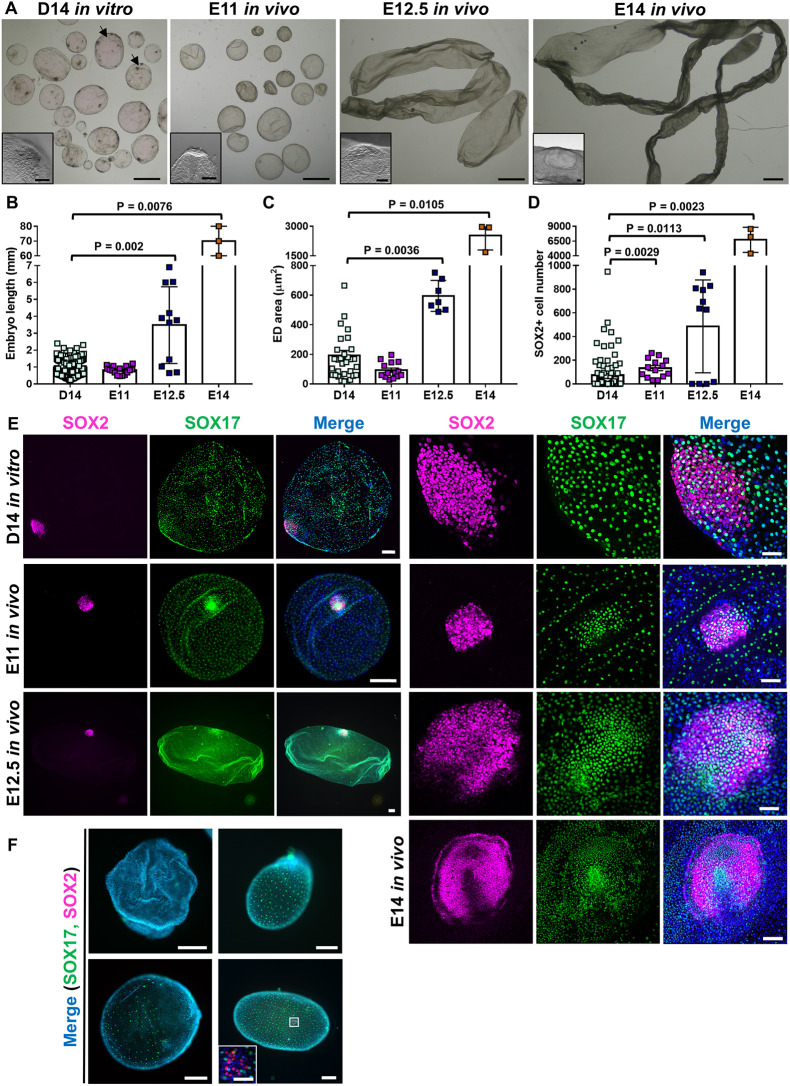
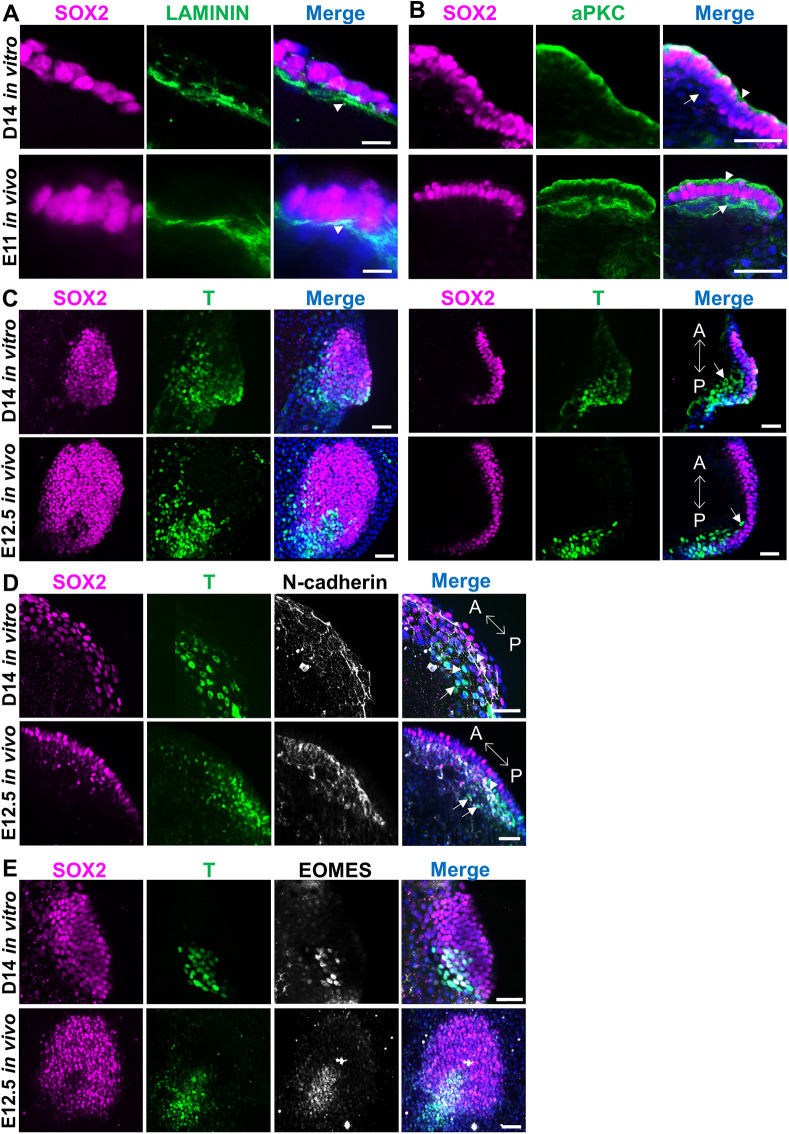
Developmental failures occurring shortly after blastocyst hatching from the zona pellucida constitute a major cause of pregnancy losses in both humans and farm ungulates. The developmental events occurring following hatching in ungulates include the proliferation and maturation of extra-embryonic membranes - trophoblast and hypoblast - and the formation of a flat embryonic disc, similar to that found in humans, which initiates gastrulation prior to implantation. Unfortunately, our understanding of these key processes for embryo survival is limited because current culture systems cannot sustain ungulate embryo development beyond hatching. Here, we report a culture system that recapitulates most developmental landmarks of gastrulating ovine embryos: trophoblast maturation, hypoblast migration, embryonic disc formation, disappearance of the Rauber's layer, epiblast polarization and mesoderm differentiation. Our system represents a highly valuable platform for exploring the cell differentiation, proliferation and migration processes governing gastrulation in a flat embryonic disc and for understanding pregnancy failures during the second week of gestation. This article has an associated 'The people behind the papers' interview.

Keywords: In vitro; Embryo; Gastrulation; Ovine; Post-hatching culture.


Conflict of interest statement

Competing interests The authors declare no competing or financial interests.

Figures

Fig. 1.
Fig. 1.
Post-hatching development in vitro in basal media. (A) Representative brightfield images of D14 embryos cultured in SOF+FBS, hIVC or N2B27. (B) Complete hypoblast migration is achieved in most D14 embryos, but epiblast development is impaired in SOF+FBS and hIVC media. Staining for SOX2 (epiblast) and SOX17 (hypoblast); inset shows magnification of the epiblast. Scale bars: 1 mm (A); 100 µm (B). (C) Relative mRNA abundance in D7 and D14 embryos cultured in SOF+FBS, hIVC or N2B27. Different letters indicate significant differences (one-way ANOVA; P<0.05). Bars represent mean±s.e.m.
Fig. 2.
Fig. 2.
Epiblast development is improved by activin A and ROCKi supplementation. (A) ROCKi significantly reduced apoptosis in embryos cultured in hIVC. hIVC, n=12; hIVC+R, n=16; N2B27, n=13; N2B27+R, n=15; Mann–Whitney Rank Sum test. (B) SOX2+ epiblast cells of embryos cultured in N2B27 (n=49), N2B27+R (n=79), N2B27+F (n=51), N2B27+A (n=46) or N2B27+I (n=46); one-way ANOVA, Kruskal–Wallis test. (C) Representative embryos stained for SOX2 (epiblast) and SOX17 (hypoblast). Insets show magnifications of the epiblast. (D) Representative EDs with (N2B27) and without (N2B27+A+R) Rauber's layer stained for SOX2 (epiblast) and SOX17 (hypoblast). Arrowheads indicate trophoblast cells covering the epiblast in embryos cultured in N2B27. (E) SOX2+ epiblast cells of embryos cultured in N2B27 (n=48) or N2B27+A+R (n=88); Mann–Whitney Rank Sum test. A, 20 ng/ml activin A; I, 100 ng/ml IGF1; F, 20 ng/ml bFGF; R, ROCK inhibitor (10 μM Y-27632). Bars represent mean±s.e.m. Scale bars: 100 µm (C); 50 µm (D).
Fig. 3.
Fig. 3.
Comparison between in vitro and in vivo post-hatching embryos. (A) Representative in vitro-produced D14 embryos cultured in N2B27+A+R and E11, E12.5 and E14 in vivo-derived embryos. Insets show magnifications of the ED. Arrows point to in vitro embryos with several dark areas. (B) Embryo length (mm) of in vitro-produced D14 embryos cultured in N2B27+A+R (n=131) and E11 (n=16), E12.5 (n=11) and E14 (n=3) in vivo-derived embryos. (C) ED area (µm2) of in vitro-produced D14 embryos cultured in N2B27+A+R (n=32) and E11 (n=14), E12.5 (n=7) and E14 (n=3) in vivo-derived embryos. (D) SOX2+ epiblast cells in in vitro-produced D14 embryos cultured in N2B27+A+R (n=88) and E11 (n=14), E12.5 (n=11) and E14 (n=3) in vivo-derived embryos. Bars represent mean±s.e.m.; one-way ANOVA, Kruskal–Wallis test. (E) Representative in vitro-produced D14 embryo cultured in N2B27+A+R and E11 and E12.5 in vivo-derived embryos. Panels on the right show magnifications of EDs from D14 in vitro and E11, E12.5 and E14 in vivo embryos. Staining for SOX2 (epiblast) and SOX17 (hypoblast). (F) E12.5 in vivo-derived embryos showing developmental arrest or delay, stained for SOX2 (epiblast) and SOX17 (hypoblast). Inset shows sparse epiblast cells. Scale bars: 1 mm (A); 100 µm (insets in A); 200 µm for E (left) and F; 100 µm for E14 ED in F (right); 50 µm for D14, E11 and E12.5 EDs in E (right) and for magnification in F.
Fig. 4.
Fig. 4.
Epiblast and mesoderm development in in vitro and in vivo post-hatching embryos. (A) Basement membrane formation under the epiblast in D14 in vitro and E11 in vivo embryos. Laminin accumulation can be seen on the basal side of SOX2+ epiblast cells (arrowheads). Maximum projections (z-sections 6-8 in Fig. S5A and 7 and 8 in Fig. S5B). (B) Polarization of SOX2+ epiblast cells in D14 in vitro and E11 in vivo embryos revealed by apical localization of aPKC (arrowheads). Arrow points to hypoblast cells. Maximum projections (z-sections 4 and 5 in Fig. S5C and 4 and 5 in Fig. S5D). (C) EDs in a D14 in vitro and in an E12.5 in vivo embryo initiating gastrulation and showing mesoderm cells in the posterior part, stained for T. Images on the left are maximum projections (z-sections 1-16 in Fig. S6A and 1-21 in Fig. S6B). Images on the right show a section of the intermediate part of the structure. Double arrow indicates anterior-posterior (A-P) axis. Arrows point to migrating mesoderm cells. (D) EDs in a D14 in vitro and in an E12.5 in vivo embryo showing mesoderm cells stained for T and expression of the EMT marker N-cadherin. Maximum projections (z-sections 1-11 in Fig. S7A and 1-8 in Fig. S7B). Arrows point to migrating mesoderm cells, arrowheads point to N-cadherin-positive cells and double arrow indicates A-P axis. (E) EDs in a D14 in vitro and in an E12.5 in vivo embryo showing mesoderm cells stained for T and EOMES; maximum projections. Scale bars: 10 µm (A); 50 µm (B-E).
Fig. 5.
Fig. 5.
Trophoblast development in in vitro and in vivo post-hatching embryos. (A,B) Binucleate trophoblast cells are indicated by arrows in a D14 in vitro embryo (A) and an E12.5 in vivo embryo (B). GATA3 (trophoblast) and F-actin (cellular membranes) staining. Scale bars: 20 µm.
Fig. 6.
Fig. 6.
Transcriptional analysis of in vitro and in vivo post-hatching embryos by RNA-seq. (A) Venn diagram for DEGs identified for E11 versus E12.5 in vivo; E11 in vivo versus D14 in vitro; and E12.5 in vivo versus D14 in vitro (shrunken FC>2; Padj<0.01). (B) Heatmap of expression levels of selected lineage-specific genes (log2-normalized gene counts). EPI, epiblast; HYPO, hypoblast; TE, trophectoderm.

Similar articles

Cited by

References

    1. Alberio, R., Croxall, N. and Allegrucci, C. (2010). Pig epiblast stem cells depend on activin/nodal signaling for pluripotency and self-renewal. Stem Cells Dev. 19, 1627-1636. 10.1089/scd.2010.0012 - DOI - PMC - PubMed
    1. Alexopoulos, N. I., Vajta, G., Maddox-Hyttel, P., French, A. J. and Trounson, A. O. (2005). Stereomicroscopic and histological examination of bovine embryos following extended in vitro culture. Reprod. Fertil. Dev. 17, 799-808. 10.1071/RD04104 - DOI - PubMed
    1. Artus, J., Hue, I. and Acloque, H. (2020). Preimplantation development in ungulates: a ‘ménage à quatre’ scenario. Reproduction 159, R151-R172. 10.1530/REP-19-0348 - DOI - PubMed
    1. Bedzhov, I. and Zernicka-Goetz, M. (2014). Self-organizing properties of mouse pluripotent cells initiate morphogenesis upon implantation. Cell 156, 1032-1044. 10.1016/j.cell.2014.01.023 - DOI - PMC - PubMed
    1. Bedzhov, I., Leung, C. Y., Bialecka, M. and Zernicka-Goetz, M. (2014). In vitro culture of mouse blastocysts beyond the implantation stages. Nat. Protoc. 9, 2732-2739. 10.1038/nprot.2014.186 - DOI - PubMed

Publication types