. 2022 Apr 4;221(4):e202106160.
doi: 10.1083/jcb.202106160. Epub 2022 Mar 23.

mTORC2 suppresses cell death induced by hypo-osmotic stress by promoting sphingomyelin transport

Affiliations

mTORC2 suppresses cell death induced by hypo-osmotic stress by promoting sphingomyelin transport

Yumiko Ono et al. J Cell Biol. .

Abstract

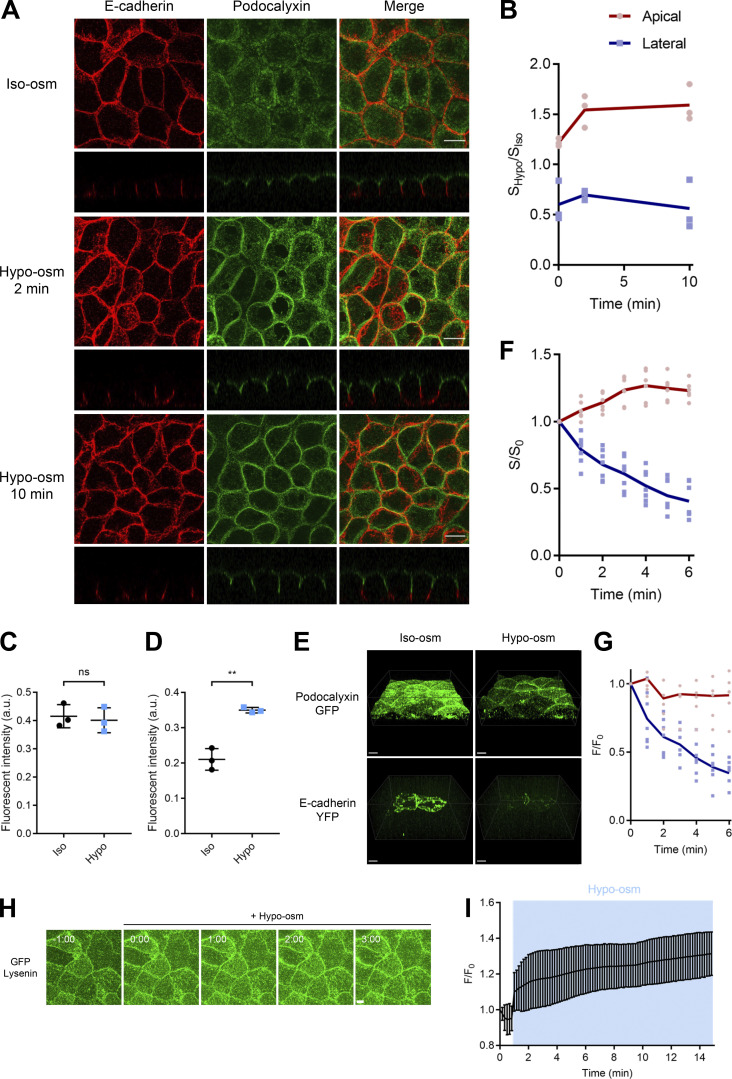
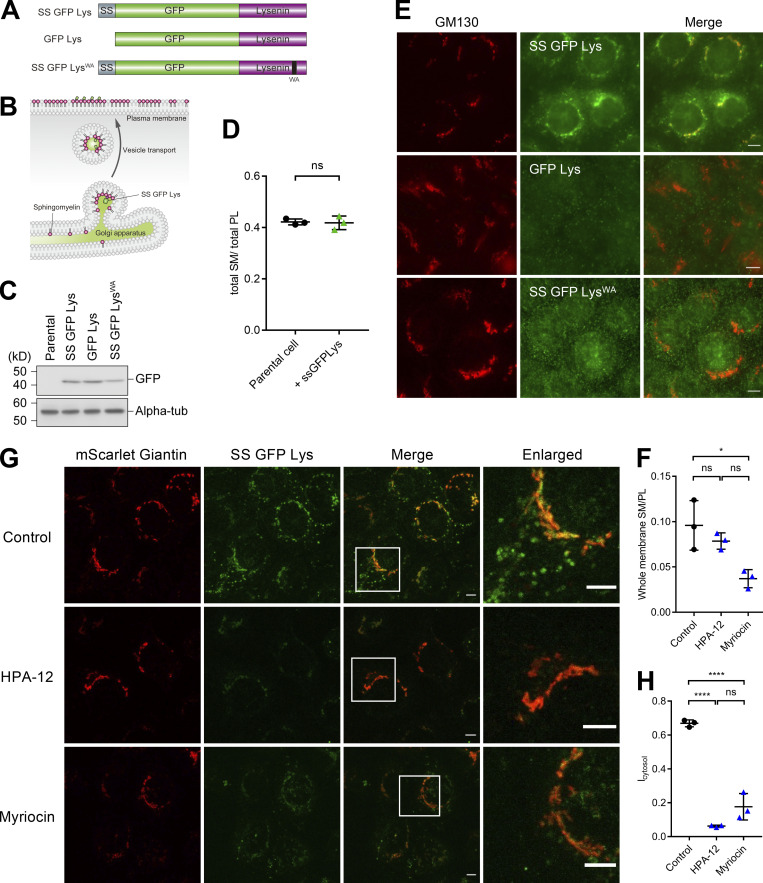
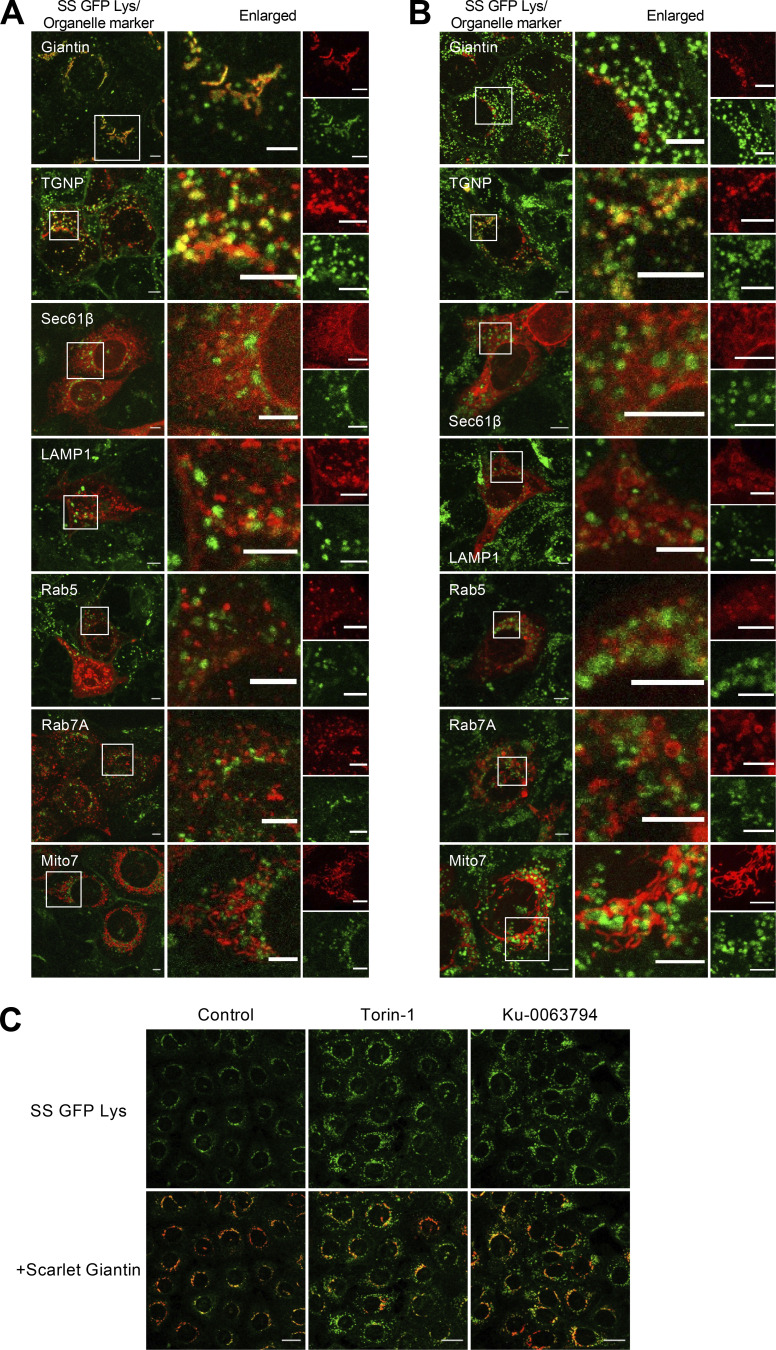
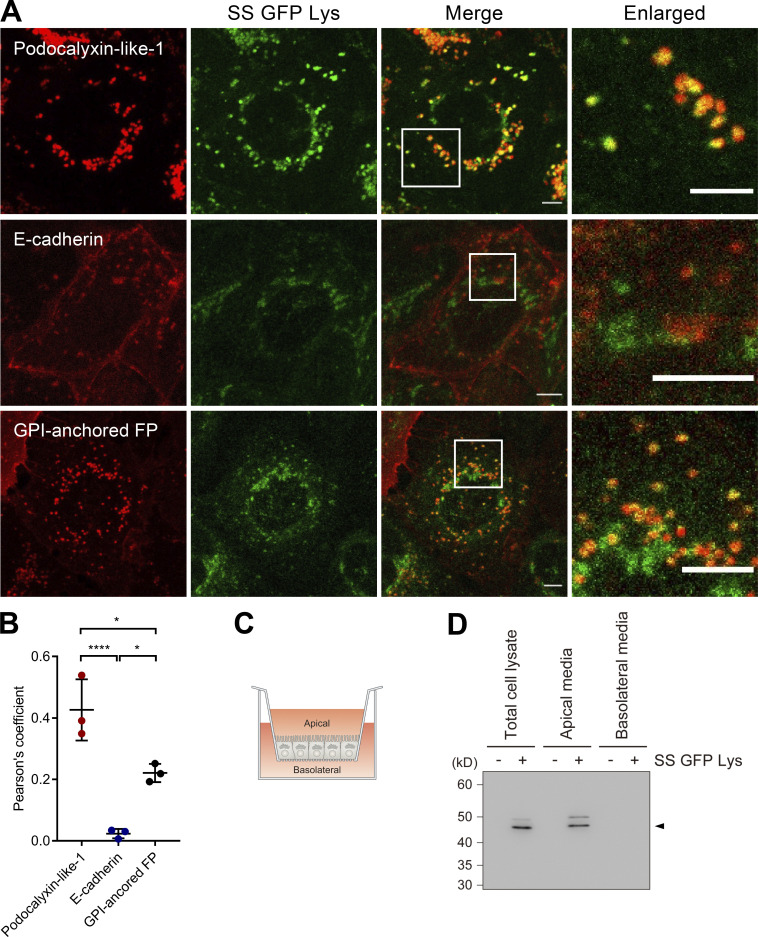
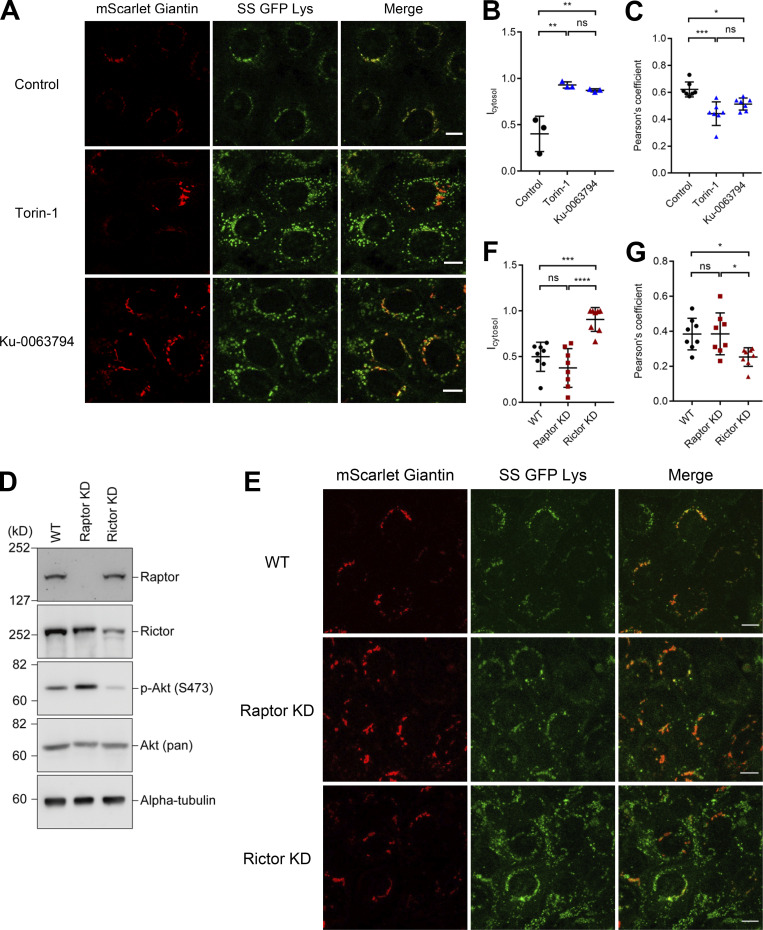
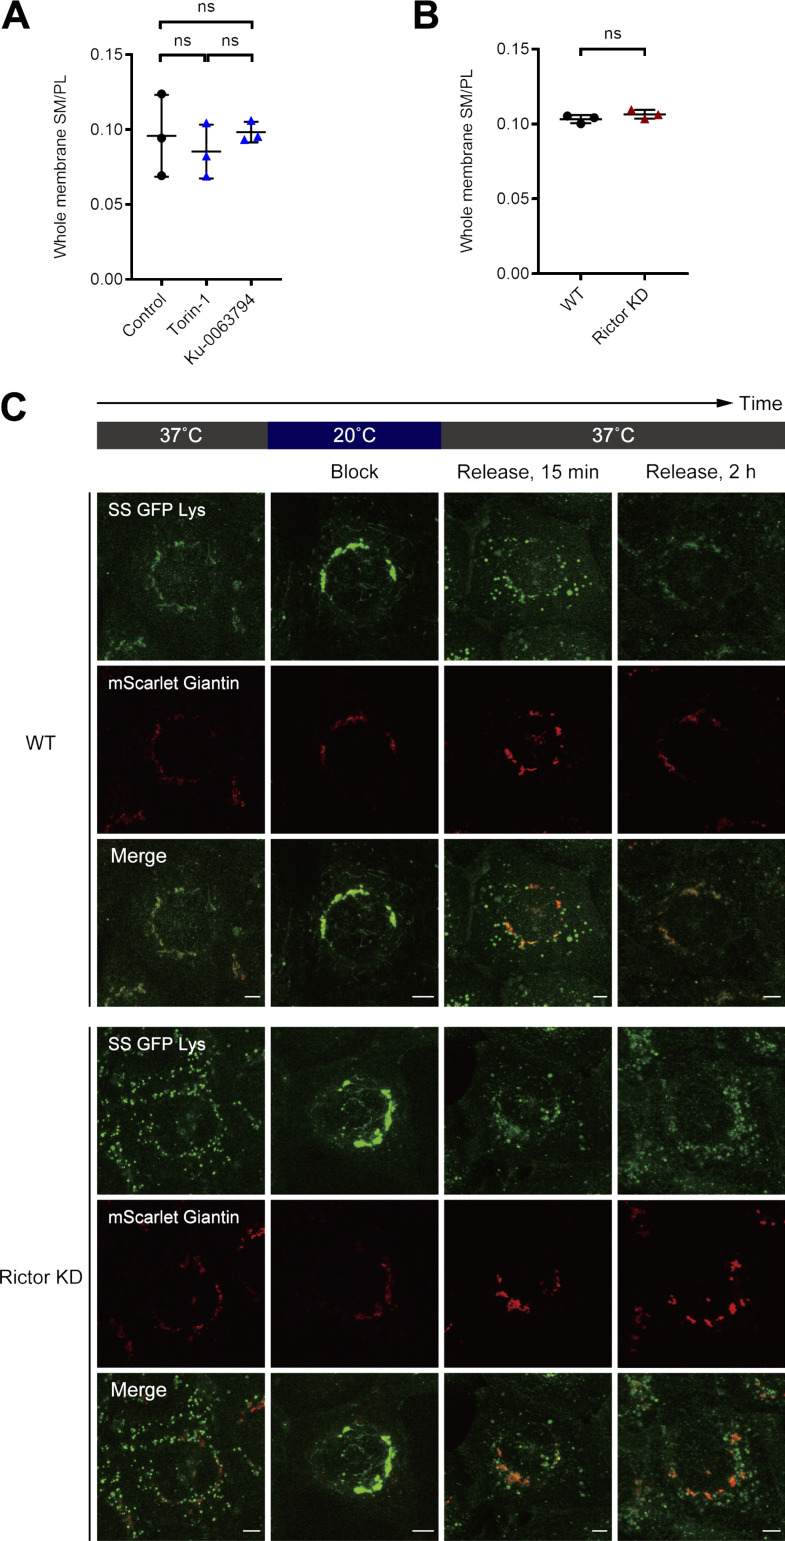
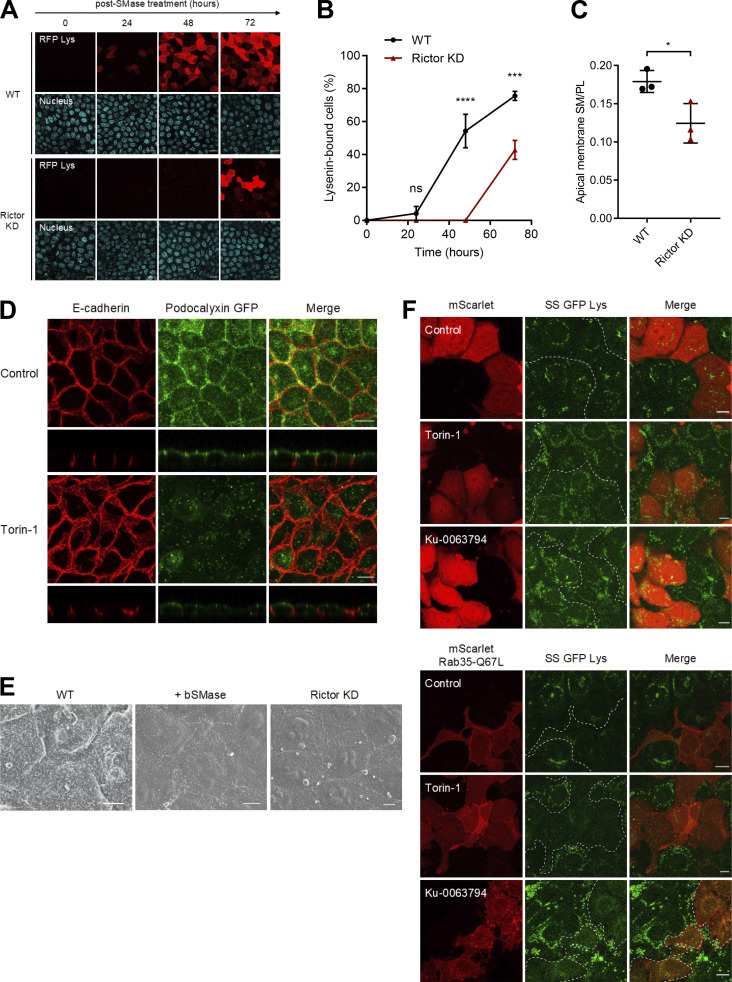
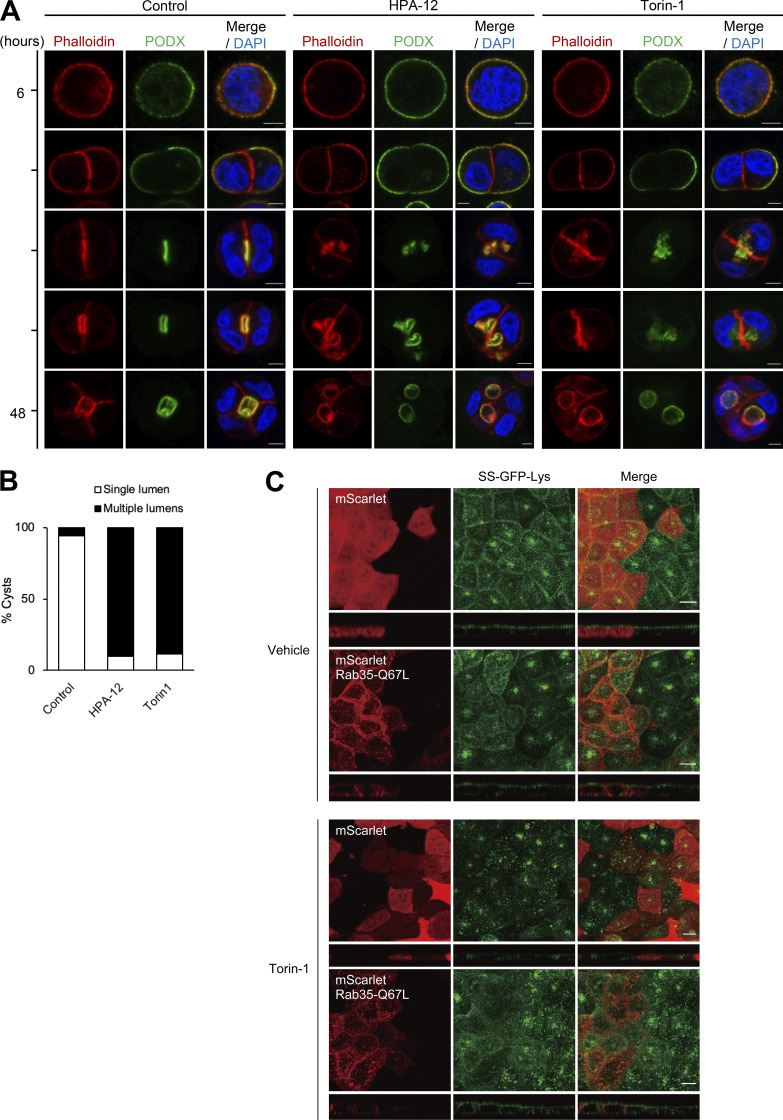
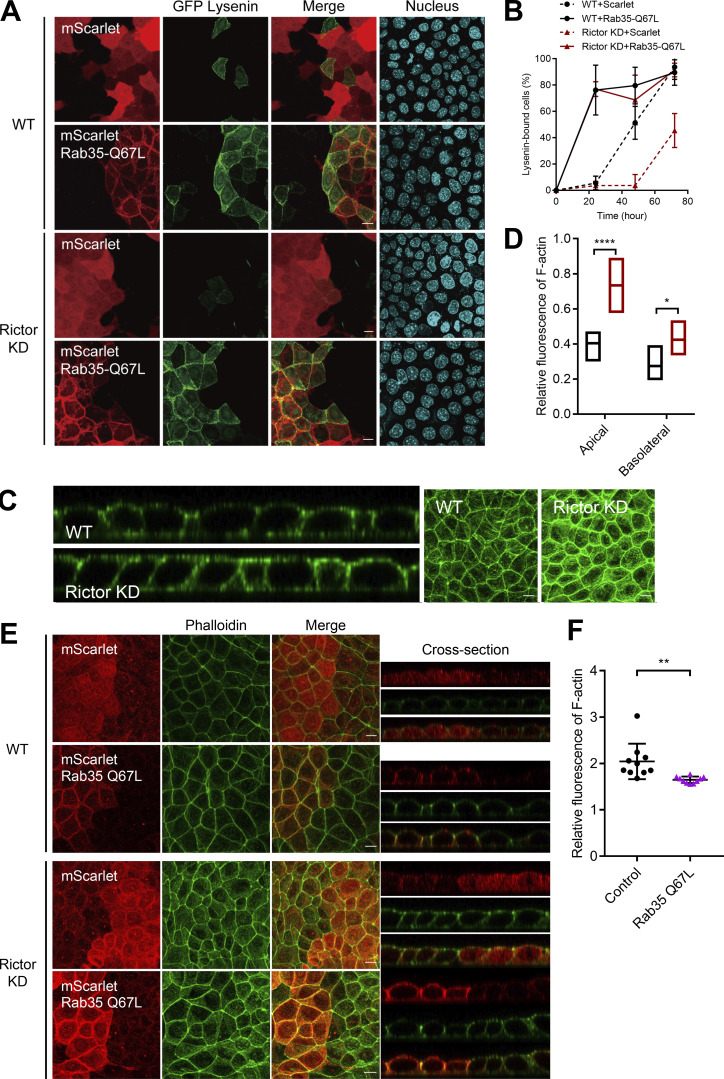
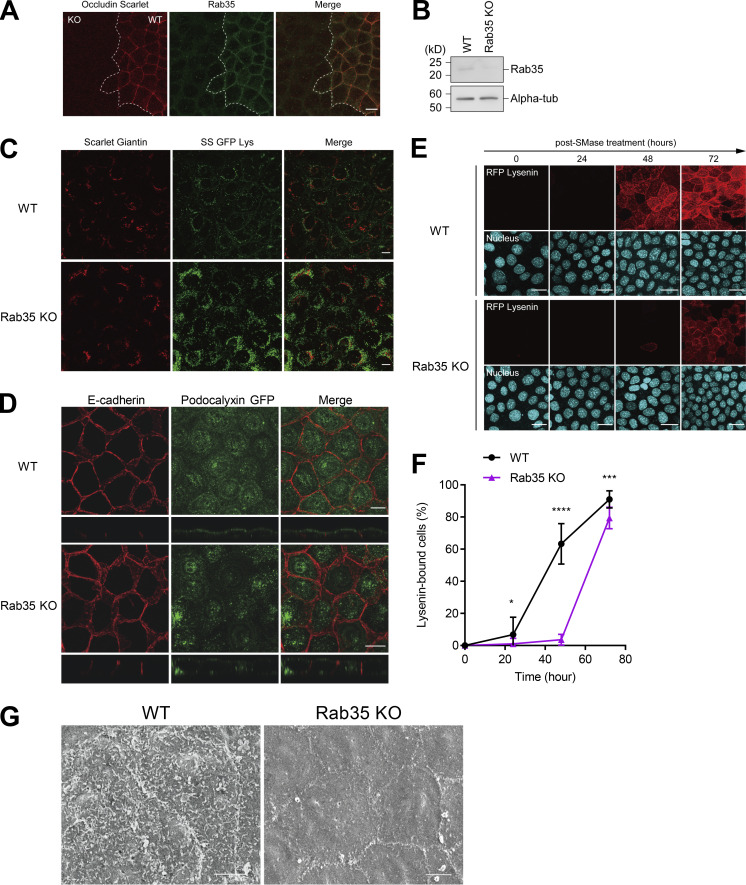
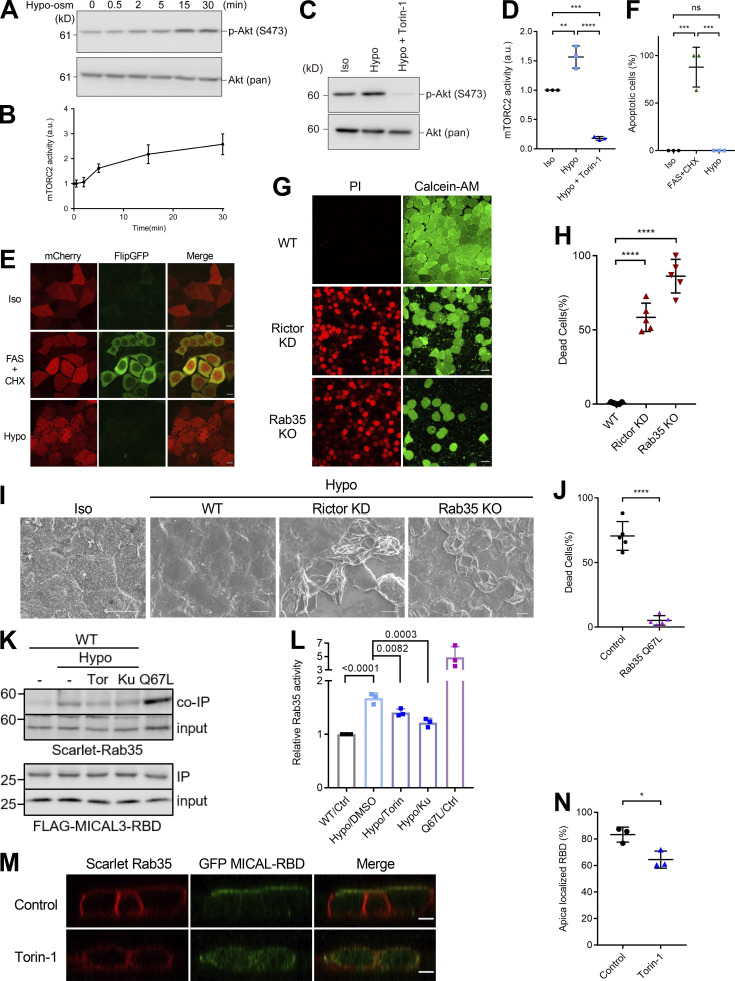
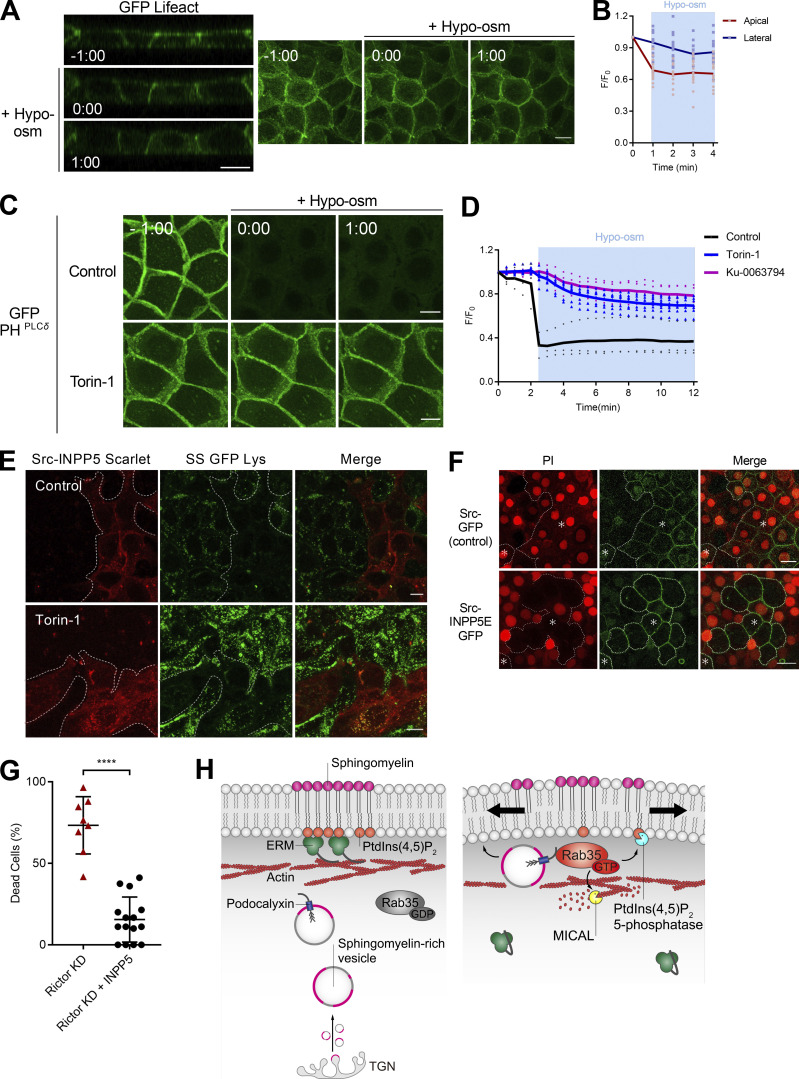
Epithelial cells are constantly exposed to osmotic stress. The influx of water molecules into the cell in a hypo-osmotic environment increases plasma membrane tension as it rapidly expands. Therefore, the plasma membrane must be supplied with membrane lipids since expansion beyond its elastic limit will cause the cell to rupture. However, the molecular mechanism to maintain a constant plasma membrane tension is not known. In this study, we found that the apical membrane selectively expands when epithelial cells are exposed to hypo-osmotic stress. This requires the activation of mTORC2, which enhances the transport of secretory vesicles containing sphingomyelin, the major lipid of the apical membrane. We further show that the mTORC2-Rab35 axis plays an essential role in the defense against hypotonic stress by promoting the degradation of the actin cortex through the up-regulation of PI(4,5)P2 metabolism, which facilitates the apical tethering of sphingomyelin-loaded vesicles to relieve plasma membrane tension.


Figures

Figure 1.
Figure 1.
Selective expansion of apical membrane of epithelial cells induced by hypo-osmotic stress. (A) Wild-type MDCK cells were treated with hypo-osmotic buffer (150 mOsm/liter) for indicated times. Cells were stained with anti-GP135/podocalyxin mAb (green) and anti-E-cadherin mAb (red). Scale bar, 10 µm. (B) Quantification of the changes of apical plasma membrane area stained with anti-GP135/podocalyxin mAb (red line) and lateral plasma membrane area stained with anti-E-cadherin mAb (blue line). The ratio of surface area under hypo-osmotic stress (SHypo) to surface area under iso-osmotic stress (SIso) from N = 3 independent experiments were plotted. Surface rendering of the plasma membrane area (S) by each antibody staining was performed using Imaris 9.6 software (Bitplane, Inc.). (C) Quantification of E-cadherin fluorescence intensities in (A) under iso-osmotic and hypo-osmotic (2 min) conditions. N = 3 independent experiments; error bar, SD; ns, not significant by Student’s t test. (D) Quantification of podocalyxin fluorescence in A under iso-osmotic and hypo-osmotic (2 min) conditions. N = 3 independent experiments; error bar, SD; **, P = 0.0016 by Student’s t test. (E) EpH4 cells expressing GFP-tagged podocalyxin or YFP-tagged E-cadherin were treated with hypo-osmotic buffer (150 mOsm/liter) for 6 mins. Scale bar, 7 µm. (F) Quantification of the change of the surface area positive for GFP-tagged podocalyxin (red line) or YFP-tagged E-cadherin (blue line). The ratio of surface area at indicated time (S) to surface area at time point = 0 (S0) were plotted from N = 6 independent experiments for GFP-tagged podocalyxin and N = 7 independent experiments for YFP-tagged E-cadherin. Surface rendering of the plasma membrane area (S) by each antibody staining was performed using Imaris 9.6 software (Bitplane, Inc.). (G) Time course change in the ratio of fluorescence intensity (F) under hypo-osmotic stress to fluorescence intensity at time point = 0 (F0) of GFP-tagged podocalyxin (red line) or YFP-tagged E-cadherin (blue line) from data obtained with (Fig. 1 E). (H) Time-lapse imaging of EpH4 cells stained with purified GFP-Lysenin. Hypo-osmotic buffer (150 mOsm) containing the same concentration of purified GFP-Lysenin as in iso-osmotic medium was added at time 0:00. Scale bar, 5 µm. (I) Time course change in the fluorescence intensities of GFP-Lysenin normalized to the value at t = 0 min. Cells cultured in iso-osmotic medium were exposed to 150 mOsm medium at t = 1 min. Frames were taken every 10 s. Means with standard deviations from N = 3 independent experiments are shown.
Figure S1.
Figure S1.
Changes of subcellular localization of caveolins after hypo-osmotic stress (related to Fig. 1). (A) Wild-type EpH4 cells stained with anti-Claudin-3 pAb and anti-Caveolin-1 mAb. The lower panels show the snapshots in the z-axis direction. Scale bar, 10 µm. (B) Wild-type EpH4 cells stably expressed cGFP-tagged Caveolin-2. The lower pictures show the snapshot in the z-axis direction. Scale bar, 5 µm. (C) Time-lapse imaging of EpH4 cells stably expressing Caveolin-2-GFP. Hypo-osmotic buffer (150 mOsm/liter) was added at time 0:00. Scale bar, 5 µm. (D) Fluorescence intensities normalized to the value at t = 0 min and shown as the mean line. N = 3 independent experiments. (E) Wild-type MDCK cells stained with anti-Caveolin-1 mAb. The lower panels show the snapshots in the z-axis direction. Scale bar, 10 µm. (F) Wild-type MDCK cells treated with hypo-osmotic buffer (150 mOsm/liter) for indicated time were fixed and stained with anti-Claudin-3 pAb and anti-Caveolin mAb. Scale bar, 10 µm. (G) Quantification of the ratio of fluorescence signal of caveolin-1 staining of the apical membrane to that of the basolateral membrane in wild-type MDCK cells treated with hypo-osmotic buffer (150 mOsm/liter) for indicated time. N = 4 independent experiments; error bar, SD; ns, not significant by one-way ANOVA with Tukey’s post-hoc test.
Figure 2.
Figure 2.
Visualization of transport vesicles to apical membrane containing sphingomyelin. (A) A schematic diagram of the construct to visualize intracellular trafficking of sphingomyelin. SS means the preprotrypsin signal peptide (MSALLILALVGAAVAFPVD). (B) SS-GFP-Lys is expected to reside in the Golgi apparatus or the transport vesicles budding from TGN due to the binding to sphingomyelin synthesized and accumulated in the Golgi apparatus. When transport vesicles were fused with the plasma membrane, SS-GFP-Lys is released into the medium. (C) Total cell lysate of EpH4 cells stably expressing SS-GFP-Lys, GFP-Lys, and SS-GFP-LysWA were resolved by SDS-PAGE and immunoblotted with anti-GFP mAb and anti-alpha-tubulin mAb. (D) Total lipids were extracted from parental EpH4 cells and EpH4 cells expressing SS-GFP-Lys by Bligh and Dyer method. The ratio of the amount of sphingomyelin (mg/dl) to the total amount of phospholipids (mM) were plotted for both samples. N = 3 from independent experiments; error bar, SD; ns, not significant by Student’s t test. (E) EpH4 cells stably expressing SS-GFP-Lys, GFP-Lys, and SS-GFP-LysWA were fixed and stained with anti-GM130 mAb (red). Only SS-GFP-Lys co-localized with GM130. Scale bar, 10 μm. (F) EpH4 cells were treated with DMSO (control) or 40 µM HPA-12 or 50 μM Myriocin for 36 h. Then, total lipids were extracted by Bligh and Dyer method and the amount of total phospholipids (mM) and sphingomyelin (mg/dl) were quantified. N = 3 from independent experiments; error bar, SD; *, P = 0.0162; and ns, not significant by one-way ANOVA with Tukey’s post-hoc test. (G) EpH4 cells stably expressing both SS-GFP-Lys and mScarlet-Giantin were treated with DMSO (control) or 40 µM HPA-12 or 50 μM Myriocin for 36 h. Scale bar, 5 μm. (H) The quantification of the cytoplasmic SS-GFP-Lys vesicles in cells treated with DMSO (control) or 40 µM HPA-12 or 50 μM Myriocin for 36 h. Icytosol was calculated as (total area of SS-GFP-Lys − the area of SS-GFP-Lys that is colocalized with Giantin)/Total area of GFP. N = 3 from independent experiments; error bar, s.d.; ****, P < 0.0001; and ns, not significant by one-way ANOVA with Tukey’s post-hoc test. Source data are available for this figure: SourceData F2.
Figure S2.
Figure S2.
Examination of co-localization of SS-GFP-Lys containing vesicles with various organelle marker proteins (related to Fig. 3 and Fig. 4). (A) EpH4 cells expressing SS-GFP-Lys were transfected with mScarlet-Giantin, mCherry-TGNP, mCherry-Sec61β, mRFP-LAMP1, mCherry-Rab5, mCherry-Rab7A and mCherry-Mito-7 expression vectors. Scale bar, 5 μm. (B) EpH4 cells expressing SS-GFP-Lys and the proteins as described in A were treated with 250 nM Torin-1 for 24 h. Scale bar, 5 μm. (C) Treatment with inhibitors of mammalian target of rapamycin signal pathway increased the number of SS-GFP-Lys positive vesicles. Low magnification images of Fig. 4 A. Scale bar, 10 µm.
Figure 3.
Figure 3.
SS-GFP-Lys is transported together with podocalyxin to the apical membrane. (A) EpH4 cells stably expressing SS-GFP-Lys were transfected with one of GPI-mScarlet, E-cadherin-mCherry, or Podocalyxin-like-1-mScarlet (PODXL1-mScarlet). Living cells were observed with a confocal microscope at 37°C. GPI-mScarlet and PODXL1-mScarlet showed co-localization with SS-GFP-Lys dots, but E-cadherin-mCherry did not. Scale bar, 5 μm. (B) The degree of co-localization between SS-GFP-Lys and one of GPI-mScarlet, E-cadherin-mCherry, or PODXL1-mScarlet was analyzed by Pearson’s correlation coefficient in colocalization (ImageJ). N = 3 independent experiments; error bar, SD; ***, P = 0.0005; *, P(Podocalyxin-like-1) = 0.0143; and *, P(E-cadherin) = 0.0170 by one-way ANOVA with Tukey’s post-hoc test. (C) EpH4 cells stably expressing SS-GFP-Lys were cultured on a two-chamber filter and grown to confluence. After 48 h of culture, the medium of the apical side and that of the basolateral side were collected and concentrated 30-fold. (D) Samples obtained as in Fig. 3 C were resolved by SDS-PAGE and immunoblotted with anti-GFP mAb. Arrowhead indicates the expected molecular weight of SS-GFP-Lys. Source data are available for this figure: SourceData F3.
Figure 4.
Figure 4.
Inhibition of the mTORC2 pathway impairs apical transport of sphingomyelin. (A) EpH4 cells stably expressing SS-GFP-Lys and mScarlet-Giantin were treated with DMSO (Control), 250 nM Torin-1, or 3 μM Ku-0063794 for 12 h. Treatment with mTOR inhibitors increases the dot-like cytoplasmic SS-GFP-Lys vesicles without changing morphology of the Golgi apparatus. Scale bar, 10 μm. (B) Quantification of the cytoplasmic SS-GFP-Lys vesicles in cells treated with DMSO (Control), 250 nM Torin-1 or 3 μM Ku-0063794 for 24 h. N = 3 independent experiments; error bar, SD; **, P(Torin-1) = 0.0029; **, P(Ku-0063794) = 0.0052; and ns, not significant by one-way ANOVA with Tukey’s post-hoc test. (C) Quantification of Pearson’s correlation coefficient between SS-GFP-Lys and Giantin in cells treated with DMSO (Control), 250 nM Torin-1, or 3 μM Ku-0063794 for 12 h. N = 7 from independent experiments; error bar, SD; ***, P = 0.0002; *, P = 0.0157; and ns, not significant by one-way ANOVA with Tukey’s post-hoc test. (D) Total cell lysates of wild-type EpH4 cells (WT), Raptor knockdown (KD) and Rictor KD EpH4 cells were resolved by SDS-PAGE and immunoblotted with indicated antibodies. In Rictor KD cells, the level of Akt (Ser 473) phosphorylation are reduced as compared to wild-type EpH4 cells as described previously (Guertin et al., 2006). (E) Raptor or Rictor was knocked down in EpH4 cells stably expressing SS-GFP-Lys and mScarlet-Giantin. The cytoplasmic dots of SS-GFP-Lys were significantly increased in Rictor KD cells. Scale bar, 10 μm. (F) Quantification of the cytoplasmic SS-GFP-Lys vesicles in WT cells, Raptor KD cells and Rictor KD cells. (N = 8 from independent experiments; error bar, SD, one-way ANOVA; ***, P = 0.0003; ****, P < 0.0001). (G) Quantification of Pearson’s correlation coefficient between SS-GFP-Lys and Giantin in WT cells, Raptor KD cells and Rictor KD cells. N = 8 independent experiments; error bar, SD; *, P(WT) = 0.0243; *, P(Raptor KD) = 0.0232; and ns, not significant by one-way ANOVA with Tukey’s post-hoc test. Source data are available for this figure: SourceData F4.
Figure S3.
Figure S3.
Loss of mTORC2 activity did not affect biosynthesis of sphingomyelin or formation of transport vesicles of sphingomyelin from TGN (related to Fig. 4). (A) Wild-type EpH4 cells were treated with DMSO (Control), 250 nM Torin-1 (mTOR inhibitor) or 3 μM Ku-0063794 (mTOR inhibitor) for 72 h. Total cellular lipids were extracted by Bligh and Dyer method. The total amount of phospholipid (mM) and the amount of sphingomyelin (mg/dl) were quantified. N = 3 independent experiments; error bar, SD; *, P = 0.0140; and ns, not significant by one-way ANOVA with Tukey’s post-hoc test. (B) Total phospholipids of wild type EpH4 cells (WT) and Rictor KD cells were extracted by Bligh and Dyer method. Total amount of phospholipids (mM) and the amount of sphingomyelin (mg/dl) were quantified. N = 3 from independent experiments; error bar, SD; ns, not significant by Student’s t test. (C) Wild-type EpH4 cells (WT) and Rictor KD cells (Rictor KD) co-expressing SS-GFP-Lys and mScarlet-mGiantin were cultured at 20°C for 2 h to block export from the TGN. This incubation resulted in depletion of cytoplasmic signals of SS-GFP-Lys and accumulation of SS-GFP-Lys in the Golgi apparatus. Release of the 20°C block by incubating the cells at 37°C for just 15 min resulted in the reappearance of SS-GFP-Lys containing vesicles in the cytoplasm. No significant difference was observed in the number of SS-GFP-Lys positive vesicles from Golgi bodies between wild-type EpH4 cells and Rictor KD cells. Scale bar, 5 μm.
Figure 5.
Figure 5.
Suppression of mTORC2 pathway reduces the amount of sphingomyelin in the apical membrane and impairs microvilli formation. (A) Wild type EpH4 cells and Rictor KD cells were treated with bSMase to degrade sphingomyelin at the apical membrane. Then, bSMase was washed out and cultured in a normal medium, and the recovery rate of sphingomyelin to the apical membrane of each cell was evaluated by the number of cells to which His-RFP-Lysenin binds. Scale bar, 20 μm. (B) The time-course change of number of cells stained with His-RFP-Lysenin after washing out bSMase in wild-type EpH4 cells and Rictor KD cells. N ≥ 3 independent experiments; error bar, SD; ****, P < 0.0001; ***, P < 0.0003; and ns, not significant by Student’s t test. (C) The apical membrane fractions of wild-type EpH4 cells and Rictor KD cells were isolated and the amount of sphingomyelin (mg/dl)/total phospholipid (mM) were quantified. N = 3 independent experiments; error bar, SD; *, P = 0.0327 by Student’s t test. (D) Wild-type EpH4 cells stably expressing podocalyxin-GFP were treated with either DMSO (control) or 250 nM Torin-1 for 24 h. Cells were stained with anti-GFP mAb and anti-E-cadherin mAb. Scale bar, 10 µm. (E) Scanning electron microscopy of wild-type EpH4 cells, bSMase treated wild-type EpH4 cells and Rictor KD cells. Scale bar, 5 µm. (F) EpH4 cells stably expressing SS-GFP-Lys were transfected with either mScarlet only or mScarlet-tagged-Rab35 dominant active mutant (Q67L) expression vectors and treated with DMSO (Control), 250 nM Torin-1 or 3 µM Ku-0063794 for 24 h. Transfected cells are indicated by the white-dotted line. Scale bar, 10 μm.
Figure S4.
Figure S4.
mTORC2 plays essential roles in the epithelial cyst formation by promoting apical transport of vesicles containing sphingomyelin and podocalyxin. (A) Representative immunofluorescence images showing development of apical lumen in wild-type MDCK cysts incubated with DMSO (Control), 40 µM HPA-12 or 1 µM Torin-1. After plating indicated time, cysts were fixed and stained with phalloidin (red), mAb against GP135/podocalyxin (green) and DAPI (blue). Scale bar, 5 μm. (B) Quantification of cysts with normal lumens or multiple lumens in cells treated with indicated inhibitors at 48 h. (Control, N = 490; HPA-12, N = 507; Torin-1, N = 510 cysts from five independent experiments). (C) EpH4 cells stably expressing GFP-podocalyxin were transfected with mScarlet only or mScarlet-tagged-Rab35 dominant active mutant (Q67L) expression vectors and treated with 250 nM Torin-1 or 3 µM Ku-0063794 for 24 h. Transfected cells are indicated by the white-dotted line. Scale bar, 10 μm.
Figure 6.
Figure 6.
Activation of Rab35 promotes apical transport of sphingomyelin via reduction of actin cortex of apical membrane. (A) EpH4 wild-type (WT) cells and Rictor KD cells stably expressing either mScarlet only or mScarlet-tagged-Rab35 Q67L were treated with bSMase. bSMase was washed out and cells were cultured in normal medium for an additional 24 h. Recovery of sphingomyelin at the apical membrane was imaged by recombinant GFP-Lysenin. Scale bar, 10 μm. (B) Time course change in the number of GFP-Lysenin-positive cells at the apical membrane was quantified. N ≥ 3 independent experiments; error bar, SD. (C) EpH4 wild-type (WT) cells and Rictor KD cells were stained with phalloidin. Scale bar, 10 μm. (D) Quantification of the fluorescent intensity of phalloidin at the apical and basolateral membrane in wild-type EpH4 cells (black) and Rictor KD cells (red). N = 5 from independent experiments; error bar, SD, two-way ANOVA; *, P = 0.0476; ****, P < 0.0001. (E) EpH4 wild-type (WT) cells and Rictor KD cells stably expressing either mScarlet only or mScarlet-Rab35 Q67L were stained with phalloidin. Scale bar, 10 μm. (F) Quantification of the fluorescence intensities of phalloidin at the apical membrane in mScarlet only expressing Rictor KD cells and mScarlet-Rab35 Q67L expressing Rictor KD cells. N = 10 independent experiments; error bar, SD; **, P = 0.0048 by Student’s t.test.
Figure S5.
Figure S5.
Rab35 is required for the apical transport of sphingomyelin. (A) Wild-type EpH4 cells stably expressing Scarlet-Occludin and Rab35 KO cells were cultured together and stained with anti-Rab35 antibody (Green). Scale bar, 10 µm. (B) Total cell lysate of Rab35 KO cells was resolved by SDS-PAGE and immunoblotted with anti-Rab35 mAb and anti-alpha-tubulin mAb. (C) Subcellular localization of SS-GFP-Lys expressed in wild-type EpH4 cells and Rab35 KO cells. Scale bar, 10 µm. (D) Subcellular localization of GFP-tagged podocalyxin expressed in wild-type EpH4 cells and Rab35 KO cells. Scale bar, 10 µm. (E) EpH4 wild-type (WT) cells and Rab35 KO cells were treated with bSMase. bSMase was washed out and cells were cultured in normal medium for the indicated times. Recovery of sphingomyelin at the apical membrane was evaluated by staining with RFP-Lysenin. Scale bar, 20 μm. (F) Quantification of the number of RFP-Lysenin-positive cells at the apical membrane based on E. N ≥ 12 independent experiments; error bar, SD; *, P = 0.1008; ***, P = 0.0001; and ****, P < 0.0001 by Student’s t test. (G) Scanning electron microscopy of wild-type EpH4 cells and Rab35 KO cells. Scale bar, 5 µm. Source data are available for this figure: SourceData FS5.
Figure 7.
Figure 7.
mTORC2–Rab35 activity is required for the adaptation to increased apical plasma membrane tension under hypo-osmotic stress. (A and B) mTORC2 activity under hypo-osmotic condition (150 mOsm/liter) were assessed by phosphorylation level of Akt Ser473 in EpH4 cells. N = 6 independent experiments. (C) Total cell lysates of wild-type EpH4 cells under iso- (Iso) and hypo-osmotic (Hypo) conditions, the latter treated with either DMSO or Torin-1 were resolved by SDS-PAGE and immunoblotted with indicated antibodies. (D) Quantification of C. N = 3 independent experiments; error bar, SD; **, P = 0.0019; ***, P = 0.0002; and ****, P < 0.0001 by one-way ANOVA with Tukey’s post-hoc test. (E) EpH4 cells expressing a GFP-based fluorogenic caspase-3 reporter, FlipGFP(casp3)-T2A-mCherry (Zhang et al., 2019), were treated with either iso- (Iso) or hypo-osmotic (Hypo) buffer. Cells treated with anti-Fas-antibody serve as the positive control for apoptosis. Scale bar, 10 µm. (F) Quantification of the rate of cells that undergo apoptosis under the conditions described in E. N = 3 independent experiments; error bar, SD; ***, P = 0.0003 and ns, not significant by one-way ANOVA with Tukey’s post-hoc test. (G) Wild-type EpH4 cells (WT), Rictor KD cells, and Rab35 KO cells were treated with hypo-osmotic buffer (30 mOsm/liter) for 30 min and stained with PI (red; nucleus of dead cells) and Calcein-AM (green; cytosol of live cells) to evaluate live and dead cells. Scale bar, 20 µm. (H) Quantification of the ratio of dead cells to total cells under the conditions described in G. N = 5 independent experiments; error bar, SD; ****, P < 0.0001 by one-way ANOVA with Tukey’s post-hoc test. (I) Scanning electron microscopy wild-type EpH4 cells under iso-osmotic buffer (Iso) and wild-type (WT), Rictor KD and Rab35 KO cells treated with hypo-osmotic buffer (30 mOsm/liter) for 10 min. Scale bar, 10 µm. (J) Quantification of the ratio of live cells to total cells in Rictor KD cells stably expressing mScarlet only or mScarlet-Rab35 Q67L and stained with Calcein-AM. Cells were treated with hypo-osmotic buffer (30 mOsm/liter) for 40 min. N = 5 independent experiments; error bar, SD; ****, P < 0.0001 by Student’s t test. This data is related to Videos 3 and 4. (K) Immunoblot of active, GTP-Rab35 purified by pull-down with the Rab-binding domain (RBD) of the Rab35 effector MICAL-3 in samples prepared from EpH4 cells stably expressing either wild-type or Q67L mScarlet-Rab35. Cells were maintained in iso-osmotic medium (-) and exposed to hypo-osmotic medium (Hypo, 150 mOsm/liter) for 2 min before lysis. (L) Quantification of K. N = 3 independent experiments; error bar, SD; P values indicated are from one-way ANOVA with Tukery’s post-hoc test. Data from Q67L was considered as outliers and excluded from comparison. (M) Localization of the GFP-tagged RBD of MICAL-3 in wild-type EpH4 cells stably expressing wild-type mScarlet-Rab35 treated with DMSO (Control) or 250 nM Torin-1 for 24 h. Scale bar, 5 µm. (N) Quantification of M. N = 3 independent experiments; error bar, SD; *, P = 0.0189 by Student’s t test. Source data are available for this figure: SourceData F7.
Figure 8.
Figure 8.
Reduction of PI(4,5)P2 by the activation of mTORC2–Rab35 axis is essential for the adaptation to hypo-osmotic stress. (A and B) Time-lapse imaging and quantification of EpH4 cells stably expressing GFP-Lifeact. Hypo-osmotic buffer (150 mOsm/liter) was added at time 0:00. Fluorescence intensities at apical membranes and basolateral membranes normalized to the value at t = 0 min and shown as the mean line. Scale bar, 10 µm. N = 15 independent experiments. (C and D) Time-lapse imaging and quantification of EpH4 cells stably expressing GFP-PHPLCδ. hypo-osmotic buffer (150 mOsm/liter) was added at time 0:00. The decrease of GFP-PHPLCδ signal in the apical membrane due to hypotonic stress was suppressed by the treatment with either 250 nM Torin-1 or 3 µM Ku-0063794 for 24 h. Scale bar, 10 µm. Fluorescence intensities normalized to the value at t = 0 min and shown as the mean line. N ≥ 3 independent experiments. (E) EpH4 cells expressing SS-GFP-Lys and Src-INPP5E-Scarlet were treated with DMSO (Control) or 250 nM Torin-1 for 24 h. Scale bar, 10 µm. (F and G) Representative images and quantification of Rictor KD cells expressing Src-GFP (control) vector or Src-INPP5E-GFP were treated with hypo-osmotic buffer (30 mOsm/liter) for 30 min and stained with PI (red; nucleus of dead cells) and NucBlue (total cell). N ≥ 8 independent experiments; error bar, SD; ****, P < 0.0001 by Student’s t test. (H) mTORC2 and Rab35 buffer plasma membrane tension by reducing the actin cortex and increasing transport of apical membrane components in order to protect against cell death by rupturing during hypo-osmotic challenge.

Similar articles

Cited by

References

    1. Berchtold, D., Piccolis M., Chiaruttini N., Riezman I., Riezman H., Roux A., Walther T.C., and Loewith R.. 2012. Plasma membrane stress induces relocalization of Slm proteins and activation of TORC2 to promote sphingolipid synthesis. Nat. Cell Biol. 14:542–547. 10.1038/ncb2480 - DOI - PubMed
    1. Berchtold, D., and Walther T.C.. 2009. TORC2 plasma membrane localization is essential for cell viability and restricted to a distinct domain. Mol. Biol. Cell. 20:1565–1575. 10.1091/mbc.e08-10-1001 - DOI - PMC - PubMed
    1. Bryant, D.M., Datta A., Rodríguez-Fraticelli A.E., Peränen J., Martín-Belmonte F., and Mostov K.E.. 2010. A molecular network for de novo generation of the apical surface and lumen. Nat. Cell Biol. 12:1035–1045. 10.1038/ncb2106 - DOI - PMC - PubMed
    1. Bryant, D.M., Roignot J., Datta A., Overeem A.W., Kim M., Yu W., Peng X., Eastburn D.J., Ewald A.J., Werb Z., and Mostov K.E.. 2014. A molecular switch for the orientation of epithelial cell polarization. Dev. Cell. 31:171–187. 10.1016/j.devcel.2014.08.027 - DOI - PMC - PubMed
    1. Dai, J., and Sheetz M.P.. 1995. Regulation of endocytosis, exocytosis, and shape by membrane tension. Cold Spring Harb. Symp. Quant. Biol. 60:567–571. 10.1101/sqb.1995.060.01.060 - DOI - PubMed

Publication types

MeSH terms

Substances