. 2022 Mar 25;8(12):eabj9949.
doi: 10.1126/sciadv.abj9949. Epub 2022 Mar 23.

A transcriptomics-guided drug target discovery strategy identifies receptor ligands for lung regeneration

Affiliations

A transcriptomics-guided drug target discovery strategy identifies receptor ligands for lung regeneration

Xinhui Wu et al. Sci Adv. .

Abstract

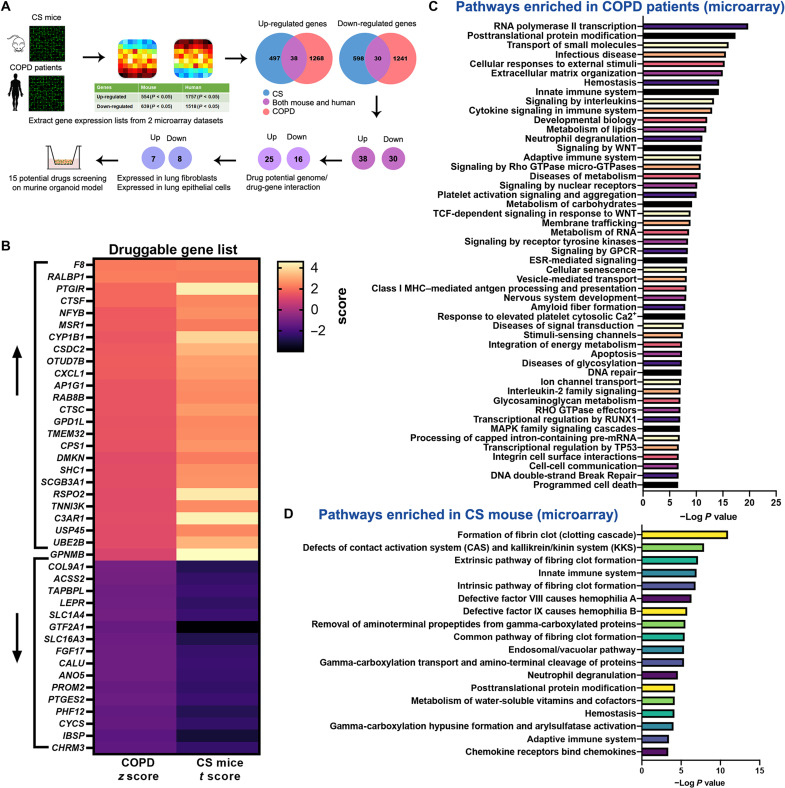
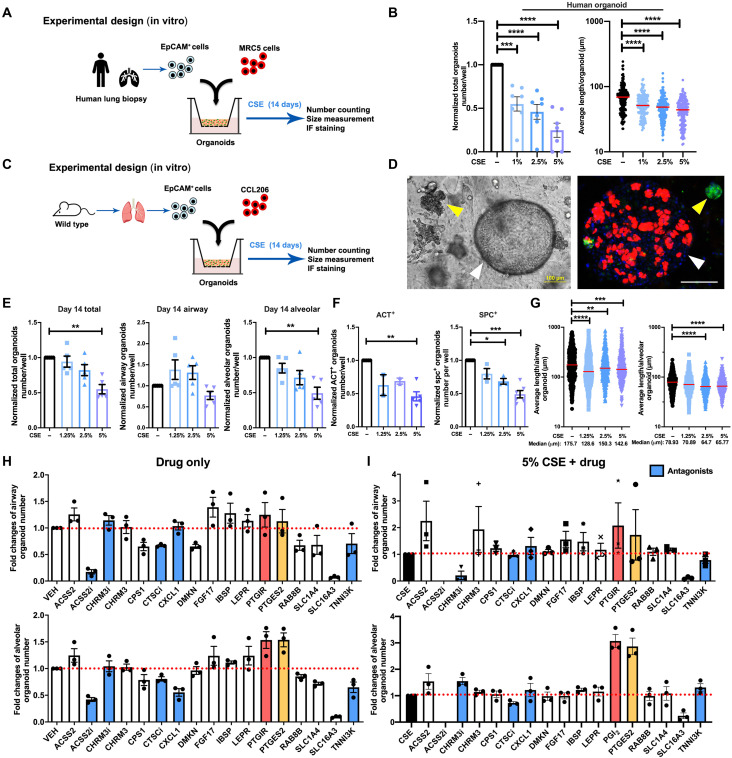
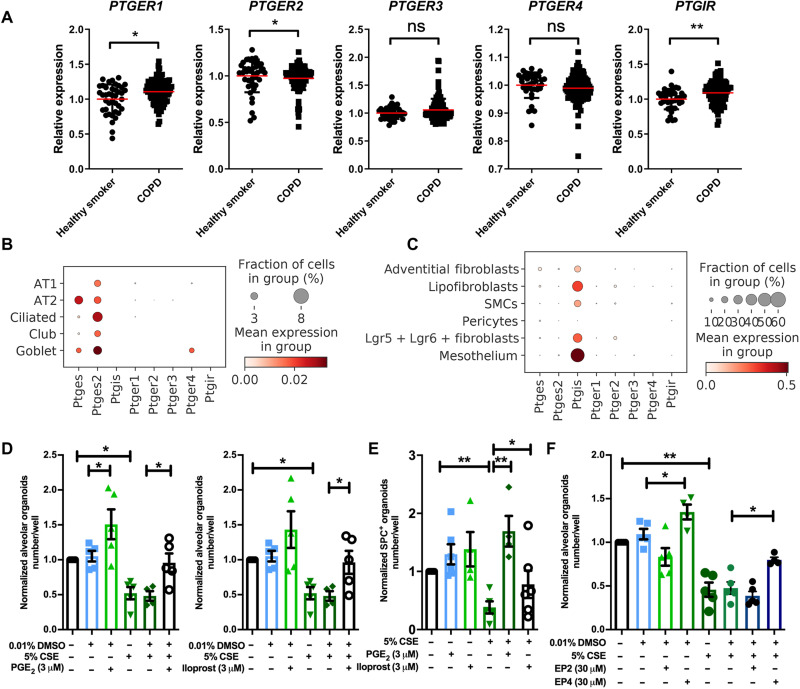
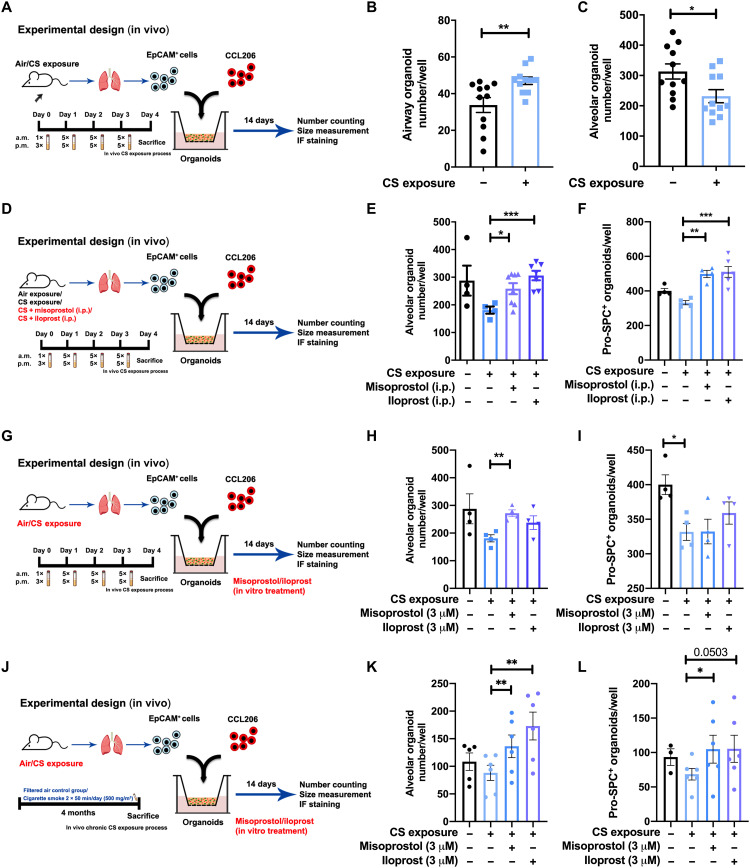
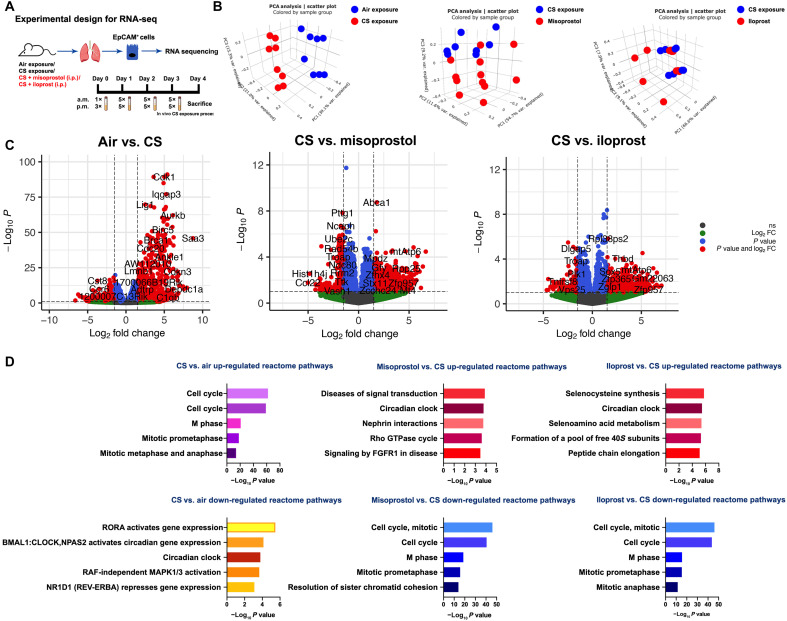
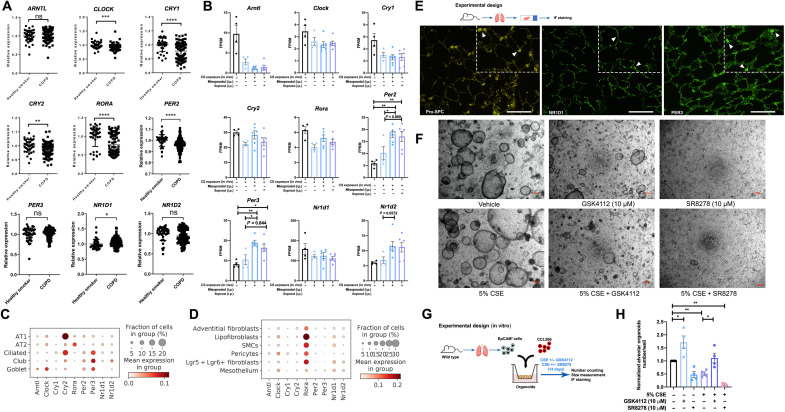
Currently, there is no pharmacological treatment targeting defective tissue repair in chronic disease. Here, we used a transcriptomics-guided drug target discovery strategy using gene signatures of smoking-associated chronic obstructive pulmonary disease (COPD) and from mice chronically exposed to cigarette smoke, identifying druggable targets expressed in alveolar epithelial progenitors, of which we screened the function in lung organoids. We found several drug targets with regenerative potential, of which EP and IP prostanoid receptor ligands had the most profound therapeutic potential in restoring cigarette smoke-induced defects in alveolar epithelial progenitors in vitro and in vivo. Mechanistically, we found, using single-cell RNA sequencing analysis, that circadian clock and cell cycle/apoptosis signaling pathways were differentially expressed in alveolar epithelial progenitor cells in patients with COPD and in a relevant model of COPD, which was prevented by prostaglandin E2 or prostacyclin mimetics. We conclude that specific targeting of EP and IP receptors offers therapeutic potential for injury to repair in COPD.


Figures

Fig. 1.
Fig. 1.. Overview of the transcriptomics-guided drug discovery strategy.
(A) Schematic outline of the drug screening strategy. (B) Heatmap shows the gene expression pattern of the druggable genes (www.dgidb.org) identified both in CS-exposed mice and patient with COPD databases. (C) Reactome pathway enrichment analysis of genes differentially expressed from patients with COPD (8) using gene set enrichment analysis (GSEA); the top 50 pathways enriched are presented. TCF, T cell factor; GPCR, G protein–coupled receptor; ESR, estrogen receptor; MHC, major histocompatibility complex; RUNX1, runt-related transcription factor 1. (D) Reactome pathway enrichment analysis of differentially genes differentially expressed from CS-exposed mice (9) using GSEA (www.gsea-msigdb.org/gsea/msigdb/annotate.jsp).
Fig. 2.
Fig. 2.. CS exposure represses adult epithelial lung organoid formation.
(A) Schematic of in vitro human experimental design. (B) Quantification of total amount of human organoids and the quantification of average human organoid diameters after treatment with CSE (0, 1, 2.5, and 5%). N = 7 experiments (two healthy and five COPD donors), n > 150 organoids per group. (C) Schematic of in vitro murine experimental design. (D) Representative images of murine lung organoids. Left: Light microscopy. Right: Immunofluorescence (IF) of organoids. Green, pro-SPC (SPC); red, ACT; blue, 4′,6-diamidino-2-phenylindole (DAPI). White arrowheads, airway-type organoid; yellow arrowheads, alveolar-type organoid. Scale bars, 100 μm. (E) Quantification of the normalized number of total organoids, airway, and alveolar-type organoids on day 14 obtained after treatment with different concentrations of CSE (0, 1.25, 2.5, and 5%). (F) Quantification of normalized ACT+ and pro-SPC+ organoids obtained after treatment with 0, 1.25, 2.5, and 5% CSE. (G) Quantification of average organoid diameter after treatment with 0, 1.25, 2.5, and 5% CSE measured on day 14. N = 5 experiments, n > 380 organoids per group. (H and I) Overview of drug screening using the in vitro murine lung organoid model. Comparison of the normalized number of airway and alveolar-type organoids treated with the different drugs of interest in the absence (H) or presence (I) of 5% CSE. Red bars, PTGIR; yellow bars, PTGES2; blue bars, antagonists. Data are presented as means ± SEM in number quantification. Data are presented as scatter plots with medians in size quantification. VEH, vehicle; ACSS2, acetate-dependent acetyl CoA synthetase 2; CHRM3, muscarinic M3 receptor; CPS1, carbamoyl phosphate synthetase 1; CTSC, cathepsin C; CXCL1, C-X-C motif chemokine ligand 1; DMKN, dermokine; FGF17, fibroblast growth factor 17; IBSP, integrin binding sialoprotein; LEPR, leptin receptor; PTGIR, prostaglandin I receptor; PTGES2, prostaglandin E synthase 2; RAB8B, Ras-related protein Rab-8B; SLC1A4, solute carrier family 1 member 4; SLC16A3, solute carrier family 16 member 3; TNNIK3, TNNI3 interacting kinase. For all panels, *P < 0.05, **P < 0.01, ***P < 0.001, and ****P < 0.0001.
Fig. 3.
Fig. 3.. 16,16-dimethyl PGE2, iloprost, and selective EP2 and EP4 analogs restore lung organoid formation in response to CS(E).
(A) The relative gene expression of PTGER1, PTGER2, PTGER3, PTGER4, and PTGIR in healthy smokers (N = 40) and patients with COPD (N = 111) downloaded from the National Center for Biotechnology Information (NCBI) Gene Expression Omnibus (GEO) database (GSE76925). (B and C) Data are extracted from the NCBI GEO database (GSE151674). (B) The expression of Ptges, Ptges2, Ptgis, Ptger1, Ptger2, Ptger3, Ptger4, and Ptgir in epithelial cells using scRNA-seq analysis of mouse lung tissue. (C) The expression of Ptges, Ptges2, Ptgis, Ptger1, Ptger2, Ptger3, Ptger4, and Ptgir in mesenchymal cells using scRNA-seq analysis of mouse lung tissue. SMCs, smooth muscle cells. (D) Quantification of normalized number of alveolar-type organoids treated with vehicle control or 5% CSE ± PGE2 agonist (16,16-dimethyl PGE2)/iloprost. DMSO, dimethyl sulfoxide. (E) Quantification of normalized number of SPC+ organoids treated with vehicle control or 5% CSE ± PGE2 agonist (16,16-dimethyl PGE2) or iloprost. (F) Quantification of normalized number of alveolar-type of organoids treated with vehicle control or 5% CSE ± selective EP2 or EP4 agonist. Data are presented as means ± SEM. *P < 0.05, **P < 0.01, ***P < 0.001, and ****P < 0.0001. ns, not significant.
Fig. 4.
Fig. 4.. Administration (in vivo and in vitro) of misoprostol and iloprost to CS-exposed mice restored lung organoid formation.
(A) Schematic of in vivo CS exposure experimental setup. (B and C) Number of airway- and alveolar-type organoids quantified on day 14 of coculturing CCL-206 fibroblasts and Epcam+ cells (isolated from air-exposed/CS-exposed mice). N = 11 experiments. (D) Schematic of experimental design. Organoids were generated from air- or CS-exposed mice treated in vivo with misoprostol [intraperitoneal (i.p.)] or iloprost (intraperitoneal); all organoids were treated with normal organoid medium. (E and F) Number of alveolar-type and pro-SPC+ organoids quantified on day 14 from coculture of CCL-206 fibroblasts and Epcam+ cells [isolated from air-exposed (control) and CS-exposed mice treated intraperitoneally with misoprostol or iloprost]. (G) Schematic of experimental design. Organoids were generated from mice exposed to air or CS. Misoprostol and iloprost were added in vitro to the organoid medium for treatment. (H and I) Number of alveolar-type and SPC+ organoids quantified on day 14 from coculture of CCL206 fibroblasts and Epcam+ cells (isolated from air- and CS-exposed mice) treated with misoprostol/iloprost in vitro. (J) Schematic of experimental design. (K and L) Number of alveolar-type and SPC+ organoids quantified on day 14 from coculture of CCL-206 fibroblasts and Epcam+ cells (isolated from air- and CS-exposed mice for 4 months) treated with misoprostol/iloprost in vitro. Data are presented as means ± SEM. *P < 0.05, **P < 0.01, and ***P < 0.001.
Fig. 5.
Fig. 5.. Transcriptomic signatures in response to CS with(out) misoprostol and iloprost.
(A) Schematic experimental design for RNA-seq. (B) PCA plots demonstrate the clusters between different comparisons: air versus CS, CS versus CS + misoprostol, and CS versus CS + iloprost. (C) Volcano plots displaying the differentially expressed genes with log2 fold change (FC) of at least one with their corresponding P values. The entire list of differently expressed genes is provided in the Supplementary Materials. (D) The top five significantly up- and down-regulated reactome pathways enrichment form differentially expressed genes within the comparisons of air versus CS exposure, CS exposure versus CS + misoprostol, and CS exposure versus CS + iloprost. The top 20 significantly enriched pathways are shown in table S3. RORA, RAR-related orphan receptor alpha; BMAL, brain and muscle ARNT-like 1; CLOCK, circadian locomotor output cycles kaput; NPAS2, neuronal PAS Domain Protein 2; RAF, rapidly accelerated fibrosarcoma.
Fig. 6.
Fig. 6.. Circadian clock signaling in healthy and diseased lung tissue.
(A) The relative genes expression of ARNTL (BMAL1), CLOCK, CRY1, CRY2, RORA, PER2, PER3, NR1D1, and NR1D2 in healthy smokers (N = 40) and patients with COPD (N = 111) downloaded from the NCBI GEO database (GSE76925). (B) The expression of Arntl (Bmal1), Clock, Cry1, Cry2, Rora, Per2, Per3, Nr1d1, and Nr1d2 genes in air-, CS-, CS + misoprostol–, and CS + iloprost–exposed epithelial cells. FPKM, fragments per kilobase of transcript per million mapped reads. (C and D) The expression of Arntl (Bmal1), Clock, Cry1, Cry2, Rora, Per2, Per3, Nr1d1, and Nr1d2 in epithelial cells and mesenchymal cells using scRNA-seq of mouse lung tissue (GSE151674). (E) Immunofluorescence staining of pro-SPC (yellow), NR1D1 (green), and PER3 (green) on lung sections acquired from wild-type mice. Scale bars, 50 μm. (F) Schematic of experimental design. Scale bars, 200 μm. (G) Representative images of lung organoids treated with vehicle control or 5% CSE ± GSK4112 (10 μM)/SR8278 (10 μM). (H) Quantification of normalized number of alveolar-type of organoids treated with vehicle control or 5% CSE ± GSK4112 (10 μM)/SR8278 (10 μM). Data are presented as means ± SEM. *P < 0.05, **P < 0.01, ***P < 0.001, and ****P < 0.0001.

Similar articles

Cited by

References

    1. Kokturk N., Yıldırım F., Gülhan P. Y., Oh Y. M., Stem cell therapy in chronic obstructive pulmonary disease. How far is it to the clinic? Am. J. Stem Cells. 7, 56–71 (2018). - PMC - PubMed
    1. Basil M. C., Katzen J., Engler A. E., Guo M., Herriges M. J., Kathiriya J. J., Windmueller R., Ysasi A. B., Zacharias W. J., Chapman H. A., Kotton D. N., Rock J. R., Snoeck H. W., Vunjak-Novakovic G., Whitsett J. A., Morrisey E. E., The cellular and physiological basis for lung repair and regeneration: Past, present, and future. Cell Stem Cell 26, 482–502 (2020). - PMC - PubMed
    1. Volckaert T., Yuan T., Chao C. M., Bell H., Sitaula A., Szimmtenings L., El Agha E., Chanda D., Majka S., Bellusci S., Thannickal V. J., Fässler R., De Langhe S. P., Fgf10-hippo epithelial-mesenchymal crosstalk maintains and recruits lung basal stem cells. Dev. Cell 43, 48–59.e5 (2017). - PMC - PubMed
    1. Hu Y., Ng-Blichfeldt J. P., Ota C., Ciminieri C., Ren W., Hiemstra P. S., Stolk J., Gosens R., Königshoff M., Wnt/β-catenin signaling is critical for regenerative potential of distal lung epithelial progenitor cells in homeostasis and emphysema. Stem Cells 38, 1467–1478 (2020). - PMC - PubMed
    1. Conlon T. M., John-Schuster G., Heide D., Pfister D., Lehmann M., Hu Y., Ertüz Z., Lopez M. A., Ansari M., Strunz M., Mayr C., Ciminieri C., Costa R., Kohlhepp M. S., Guillot A., Günes G., Jeridi A., Funk M. C., Beroshvili G., Prokosch S., Hetzer J., Verleden S. E., Alsafadi H., Lindner M., Burgstaller G., Becker L., Irmler M., Dudek M., Janzen J., Goffin E., Gosens R., Knolle P., Pirotte B., Stoeger T., Beckers J., Wagner D., Singh I., Theis F. J., de Angelis M. H., O’Connor T., Tacke F., Boutros M., Dejardin E., Eickelberg O., Schiller H. B., Königshoff M., Heikenwalder M., Yildirim A. Ö., Inhibition of LTβR signalling activates WNT-induced regeneration in lung. Nature 588, 151–156 (2020). - PMC - PubMed