. 2022 Mar 25;8(12):eabk2022.
doi: 10.1126/sciadv.abk2022. Epub 2022 Mar 23.

Temporal control of the integrated stress response by a stochastic molecular switch

Affiliations

Temporal control of the integrated stress response by a stochastic molecular switch

Philipp Klein et al. Sci Adv. .

Abstract

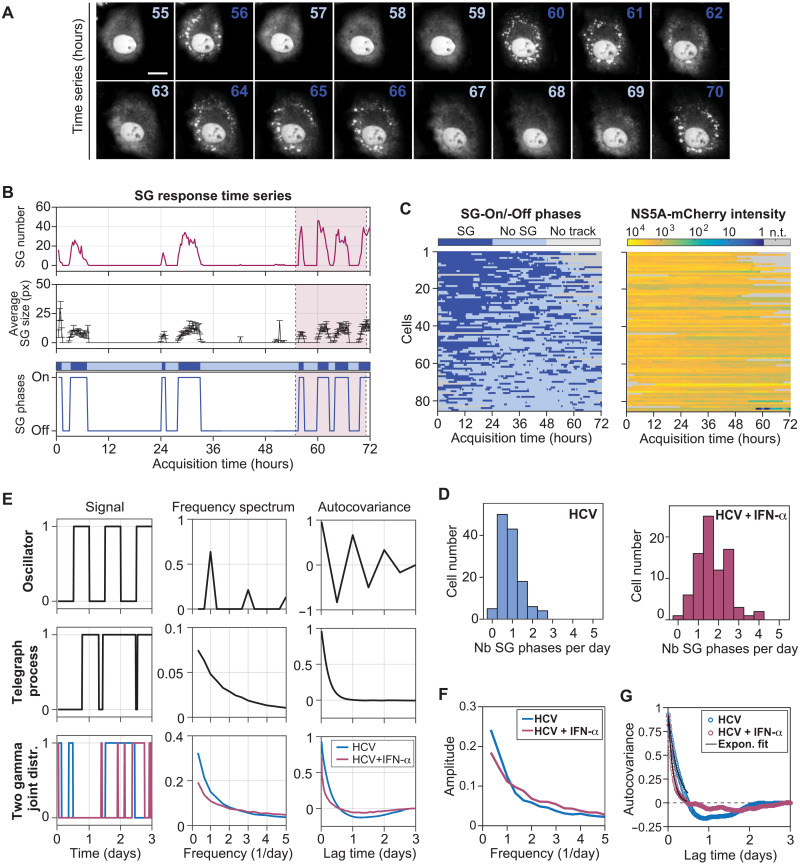
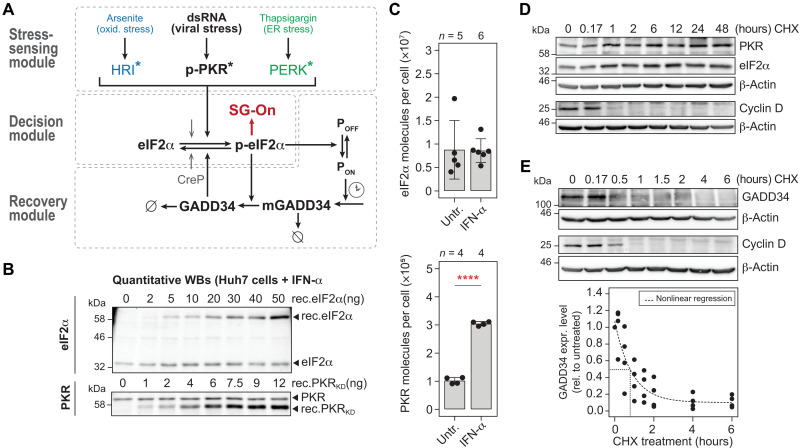
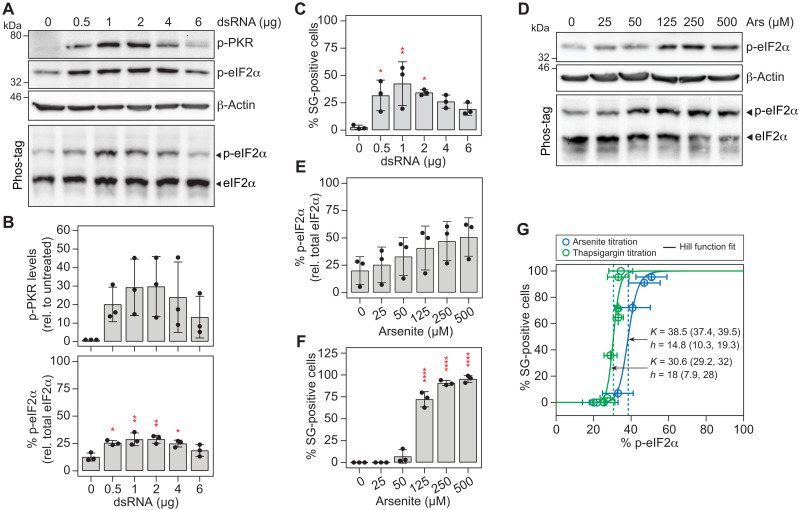
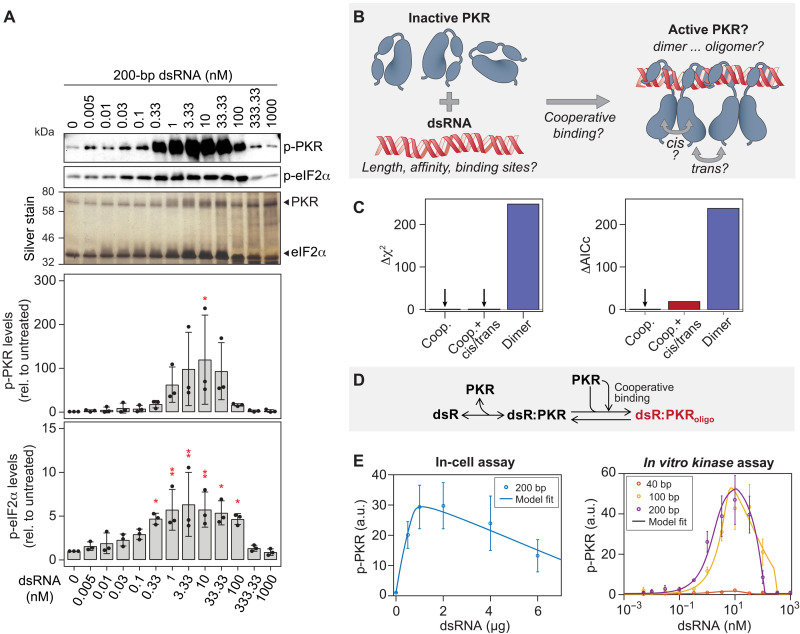
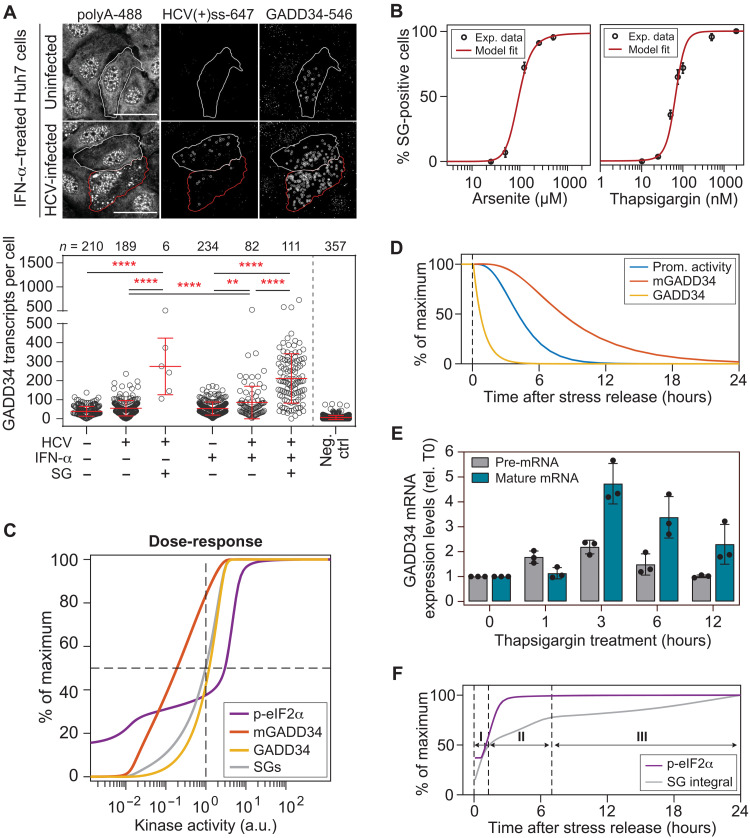
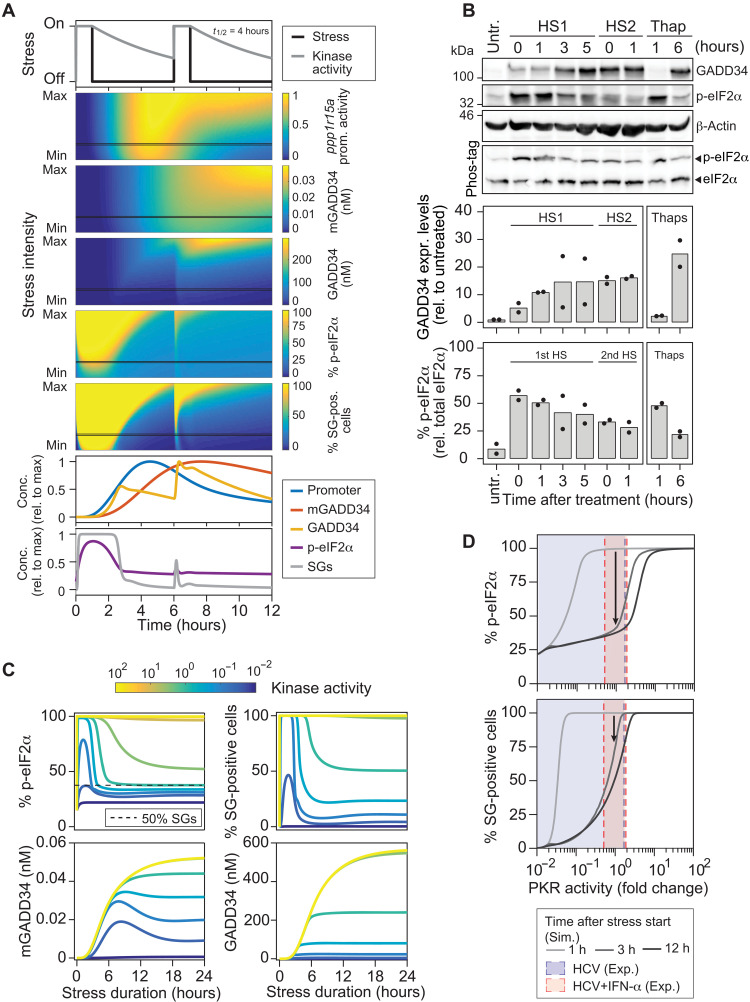
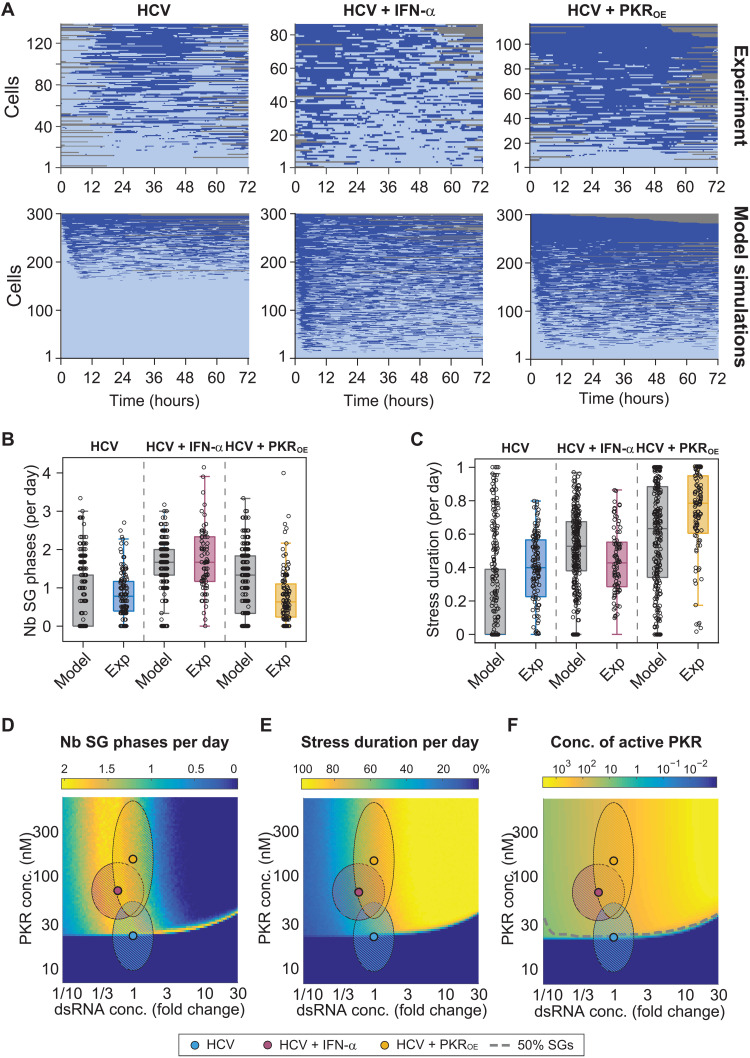
Stress granules (SGs) are formed in the cytosol as an acute response to environmental cues and activation of the integrated stress response (ISR), a central signaling pathway controlling protein synthesis. Using chronic virus infection as stress model, we previously uncovered a unique temporal control of the ISR resulting in recurrent phases of SG assembly and disassembly. Here, we elucidate the molecular network generating this fluctuating stress response by integrating quantitative experiments with mathematical modeling and find that the ISR operates as a stochastic switch. Key elements controlling this switch are the cooperative activation of the stress-sensing kinase PKR, the ultrasensitive response of SG formation to the phosphorylation of the translation initiation factor eIF2α, and negative feedback via GADD34, a stress-induced subunit of protein phosphatase 1. We identify GADD34 messenger RNA levels as the molecular memory of the ISR that plays a central role in cell adaptation to acute and chronic stress.


Figures

Fig. 1.
Fig. 1.. Time-resolved analysis of HCV-induced SG phases.
(A) Still images of a cropped section of the 72-hour time-lapse movie of HCV-infected Huh7 YFP-TIA1 cells treated with IFN-α (YFP-channel). A representative cell is shown with 1-hour interval for the time period 55 to 70 hours. Dark blue time label: SG-On phases; light blue time label: SG-Off phases. Scale bar, 25 μm. (B) Example of time-lapse analysis output for the cell shown in (A). The number of SGs (top) and the average SG size in pixel (middle) were analyzed for each frame and allowed defining SG-On and SG-Off phases (bottom). The pink-shaded area corresponds to the time period 55 to 70 hours shown in (A). A schematic of the SG response time series is shown at the top; dark blue regions: SG-On phases; light blue regions: SG-Off phases. (C) Analysis of multiple single-cell SG response time series (n = 85). Left: SG-On and SG-Off phases. Right: Infection levels as measured by NS5A-mCherry signal intensity for the corresponding cells. n.t., no track. (D) Number of SG phases per day in the absence (left) or presence of IFN-α (right). (E) Simulations of oscillator, random telegraph process, or joint gamma distributions (n = 500). Left: Type of signal response. Middle: Frequency spectrum. Right: Autocovariance function. (F) Average frequency spectra (Fourier transforms) of experimental single-cell SG response time series. (G) Autocorrelation functions of experimental single-cell SG response time series.
Fig. 2.
Fig. 2.. Deterministic mathematical model of the cellular ISR.
(A) Schematic representation of the parameters and reactions included in the mathematical model. The stress-sensing module represents the activation of stress kinases. PKR is activated by binding to dsRNA (viral stress, p-PKR*), HRI by arsenite treatment (oxidative stress, HRI*), and PERK by thapsigargin (ER stress, PERK*). Active stress kinases signal to the decision module, where upon crossing a p-eIF2α level threshold will trigger SG formation (SG-On). Elevated p-eIF2α levels activate the recovery module consisting of the GADD34 negative feedback loop, i.e., ppp15R1a promoter activation (POFF to PON) with time delay (clock symbol), GADD34 transcription (mGADD34), and protein synthesis (GADD34). In turn, GADD34 dephosphorylates eIF2α and thereby resumes translation. Gray arrow, basal eIF2α dephosphorylation by CReP, the constitutive regulatory subunit of PP1. Ø, degradation. (B and C) Absolute quantification of eIF2α and PKR mean molecule numbers in Huh7 YFP-TIA1 cells, in the absence and presence of IFN-α. (B) Representative quantitative Western blot analysis of eIF2α and PKR. (C) Estimated eIF2α and PKR mean molecule number per cell (±SD). Number of repeats (n) and statistical significance compared to untreated cells (untr.) are indicated; ****P < 0.0001. (D and E) Determination of protein half-lives by CHX pulse experiments and Western blot analyses. (D) PKR and eIF2α half-lives (n = 3). (E) GADD34 (n = 4). Black line, best nonlinear fit.
Fig. 3.
Fig. 3.. SG formation is a switch-like process.
(A to C) Activation of PKR in Huh7 YFP-TIA1 cells transfected with increasing amounts of 200-bp dsRNA (n = 3). (A) Representative Western blot analysis of p-PKR and p-eIF2α expression levels. Expression levels of β-actin served as loading control. The percentage of p-eIF2α was analyzed by Phos-tag polyacrylamide gel. (B) Shown are quantifications of mean p-PKR expression levels (±SD) normalized to the loading control and relative to untreated cells (top) and quantifications of the mean p-eIF2α percentage (±SD). Statistical significance is indicated compared to untreated cells. (C) The presence of SGs in transfected cells was analyzed by fluorescence microscopy (for each condition, n > 100). Shown are mean percentages ± SD. Statistical significance is indicated compared to untreated cells. *P < 0.05, **P < 0.01. (D to F) Induction of oxidative stress in Huh7 YFP-TIA1 cells by treatment with increasing concentrations of arsenite for 45 min (n = 3). (D) Representative Western blot and Phos-tag analyses. Shown are mean percentages ± SD of p-eIF2α (E) and SG-positive cells (for each condition, n > 100) (F). Statistical significance is indicated compared to untreated cells; ****P < 0.0001. (G) Dose-response analysis and determination of the p-eIF2α level that results in formation of SGs in 50% of cells upon treatment with arsenite [related to (F); n = 3] and thapsigargin (related to fig. S4, E to H; n = 3).
Fig. 4.
Fig. 4.. Activation of PKR by dsRNA.
(A) In vitro PKR kinase assay. His-tagged PKR and His-tagged eIF2α were incubated with increasing molarities of 200-bp dsRNA (n = 3). The top panels show representative Western blot analyses of p-PKR and p-eIF2α levels. Silver staining of proteins in the gel served as loading control. Quantifications of mean levels relative to untreated control ± SD are shown in the bottom panels. Statistical significance is indicated compared to untreated; *P < 0.05, **P < 0.01. (B to E) Computational prediction of PKR activation by dsRNA. (B) Overview of the different steps tested in PKR model development. (C) Differences in the chi-square (Δχ2) and corrected Akaike information criterion (ΔAICc) to the optimal PKR activation model variant (variant 3, see figs. S6 and S7). The model describing PKR dimerization upon binding to dsRNA was significantly improved by considering PKR cooperative binding to dsRNA (ΔAICc > 200). Cis and trans reactions did not improve the cooperativity model (ΔAICc = 18.4). (D) Overview of the optimal model variant. PKR monomers reversibly bind to PKR on dsRNA in a cooperative manner and form active PKR oligomers (dsR:PKRoligo). (E) Best model fits of p-PKR levels to in-cell (related to Fig. 3B) and in vitro kinase assays (n = 500 multistart optimization runs). a.u., arbitrary units.
Fig. 5.
Fig. 5.. Analysis of GADD34 negative feedback loop.
(A) FISH analysis. Top: Representative still images of uninfected and HCV-infected cells treated with IFN-α. HCV (+) ssRNA genomes, GADD34 transcripts, and total polyA-tailed mRNAs were detected by FISH. Outlined in red, SG-positive cell; outlined in white, unstressed cell. White circles indicate single transcripts. Scale bars, 20 μm. Bottom: GADD34 mean transcript levels ± SD. Statistical significance and the number of analyzed cells (n) are indicated at the top of the graph; **P < 0.001, ****P < 0.0001. (B) Model best fits (n = 2500 multistart optimization runs) to the percentage of SG-positive cells experimentally measured in arsenite or thapsigargin titration. (C) Computational simulations of dose-response curves for p-eIF2α, GADD34 mRNA, and protein and SG-positive cells in the population at steady state. Shown are percentages of maximal values as a function of different kinase activities. The reference kinase activity (100) results in 50% SG-positive cells (intermediate stress). Kinase activities <10−1, low to moderate stress; >2, high stress. (D) Model prediction: behavior of the GADD34 negative feedback loop parameters (promoter activity, mRNA, and protein) after stress release. The percentage of their maximum response over time is shown. Estimated decay processes {t1/2, Prom. ≈ 256 min; mRNA ≈ 200 min [from (45)]; protein ≈ 37 min}. (E) Mean expression levels ± SD of GADD34 pre-mRNA and mature mRNA upon thapsigargin treatment (n = 3). (F) Model prediction: behavior of p-eIF2α levels and number of SG-positive cells after a second 1-hour stress pulse applied at different times after stress release. Phases I to III, levels of cell protection against a second stress pulse.
Fig. 6.
Fig. 6.. Cell adaptation to repeated and continuous stress.
(A) Computational simulations of two consecutive 1-hour stress pulses interspaced by a 5-hour recovery period. Shown is a range of stress kinase activities (stress intensity) varying between 10-fold lower (min) and 10-fold higher (max) than the reference kinase activity leading to 50% SG-positive cells. Color plots show the behavior of ppp1r15a promoter activity, concentrations of GADD34 mRNA and protein, and percentages of p-eIF2α and SG-positive cells. Graphs at the bottom reflect the behavior of the abovementioned components for one chosen stress intensity (black line, moderate stress). (B) Experimental validation of the predictions shown in (A). Huh7 cells were subjected to a first heat shock (HS1) at 42°C for 1 hour and immediately transferred at 37°C for recovery. Cells were harvested at the indicated time points after the first or the second heat shock (HS2) (n = 2). Cells treated with 2 μM thapsigargin for 1 and 6 hours served as reference. Shown are representative Western blot and Phos-tag gel analyses. Bottom panels show the quantification of GADD34 expression levels normalized to the loading control and relative to untreated cells as well as the percentage of p-eIF2α. (C) Model prediction: behavior of the SG response and GADD34 negative feedback loop components over a 24-hour time period upon continuous stress. The color of the curves reflects different kinase activity levels. (D) During the adaptation to a stress stimulus, depending on PKR activity, the expression of GADD34 will result in dose-response curve shifts (hysteresis) in the percentage of p-eIF2α (top) and of SG-positive cells (bottom). The shift of the dose-response curve depends on the stress duration and intensity and is reverted after stress relief. Blue and red shared areas indicate 1σ confidence intervals of estimated PKR activities in HCV and HCV + IFN-α experiments.
Fig. 7.
Fig. 7.. Stochastic mathematical model of the ISR recapitulates HCV-induced SG response dynamics.
(A to C) Comparison of experimental and computational simulations of 3-day single-cell SG response time series using the parameters estimated in HCV-infected cells in the presence and absence of IFN-α, and in HCV-infected Huh7 PKROE cells (bottom, n = 300) (A). Corresponding number of SG phases per day (B) and stress duration per day (C) were compared. Boxes indicate 25th and 75th percentiles around the median. (D to F) Computational simulations of average SG phases per day (D), stress duration per day (E), and concentration of active PKR (F) for varying PKR and dsRNA concentrations. DsRNA concentrations are expressed as fold changes relative to conditions of the HCV experiment (simulations of 500 single-cell trajectories per combination; hatched ellipsoid areas: 95% confidence intervals for HCV and HCV + IFN-α experiments).

Similar articles

Cited by

References

    1. Pakos-Zebrucka K., Koryga I., Mnich K., Ljujic M., Samali A., Gorman A. M., The integrated stress response. EMBO Rep. 17, 1374–1395 (2016). - PMC - PubMed
    1. Holcik M., Sonenberg N., Translational control in stress and apoptosis. Nat. Rev. Mol. Cell Biol. 6, 318–327 (2005). - PubMed
    1. Hofmann S., Kedersha N., Anderson P., Ivanov P., Molecular mechanisms of stress granule assembly and disassembly. Biochim Biophys Acta Mol Cell Res 1868, 118876 (2021). - PMC - PubMed
    1. Meurs E., Chong K., Galabru J., Thomas N. S. B., Kerr I. M., Williams B. R. G., Hovanessian A. G., Molecular cloning and characterization of the human double-stranded RNA-activated protein kinase induced by interferon. Cell 62, 379–390 (1990). - PubMed
    1. Eiermann N., Haneke K., Sun Z., Stoecklin G., Ruggieri A., Dance with the devil: Stress granules and signaling in antiviral responses. Viruses 12, (2020). - PMC - PubMed