Randomized Controlled Trial
. 2022 Mar 25;8(12):eabh4050.
doi: 10.1126/sciadv.abh4050. Epub 2022 Mar 23.

Radiotherapy orchestrates natural killer cell dependent antitumor immune responses through CXCL8

Affiliations
Randomized Controlled Trial

Radiotherapy orchestrates natural killer cell dependent antitumor immune responses through CXCL8

Thomas Walle et al. Sci Adv. .

Abstract

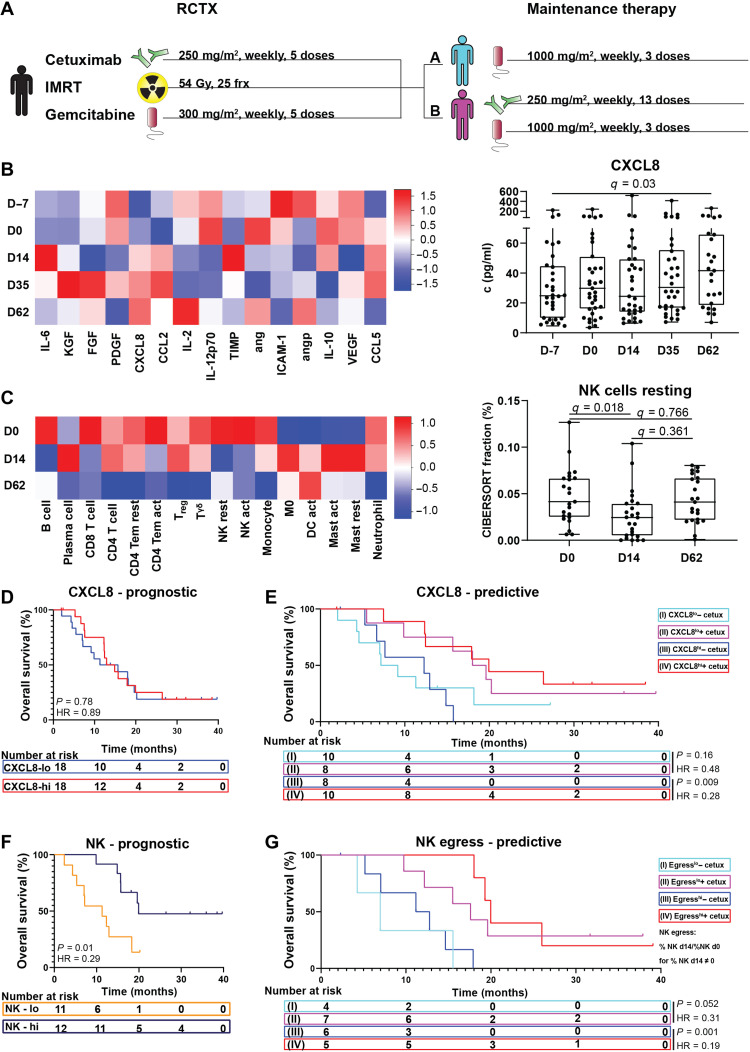
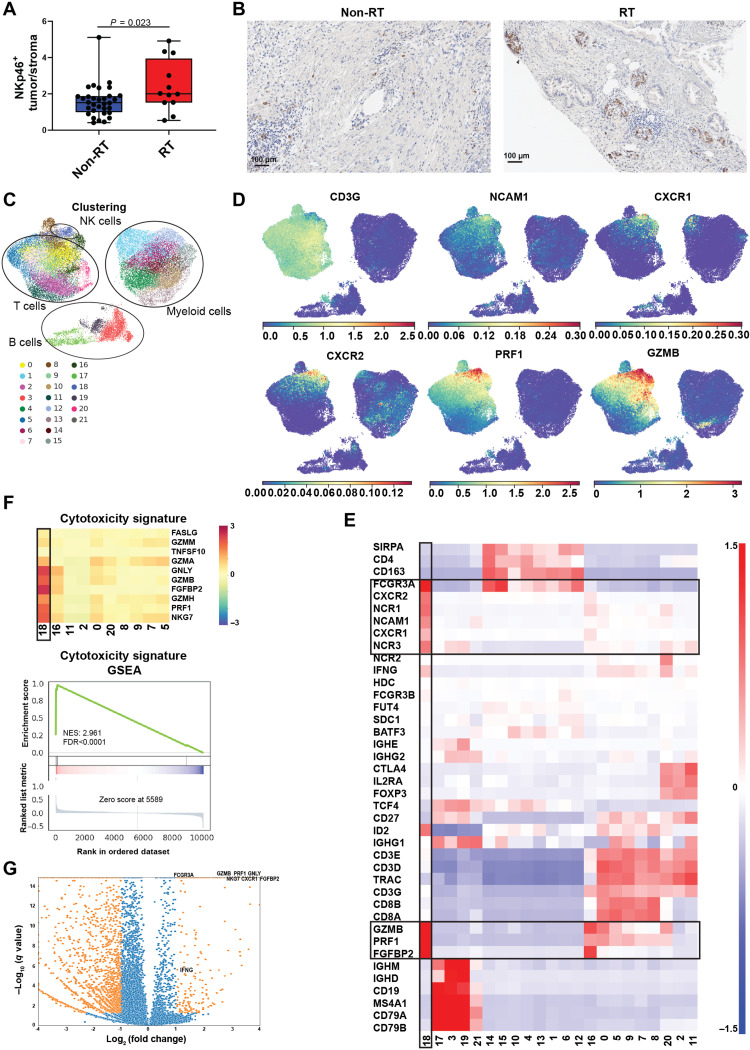
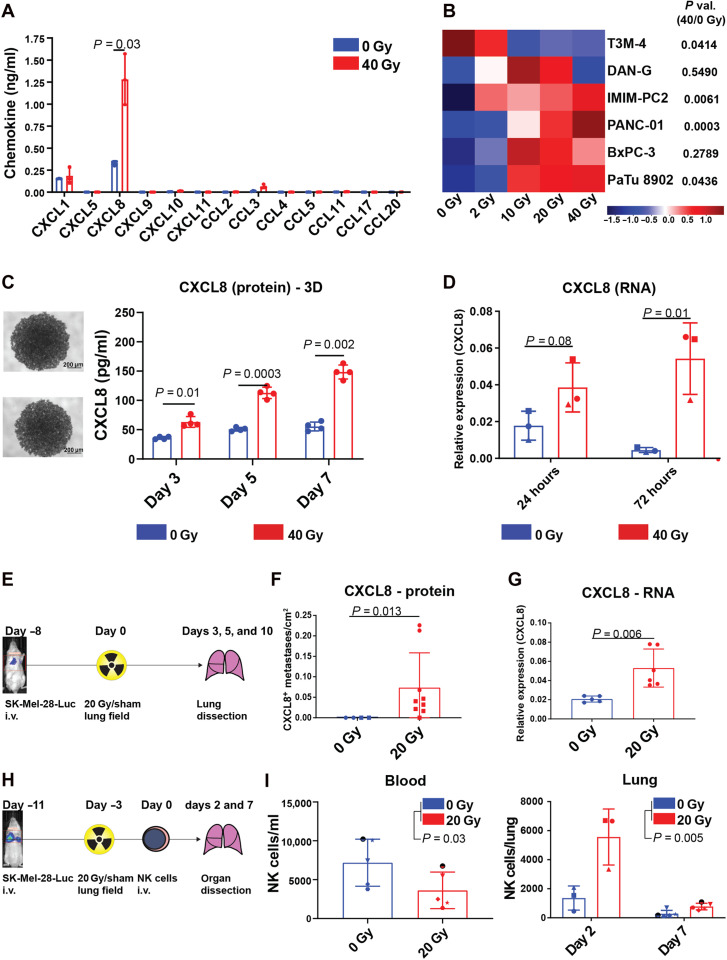
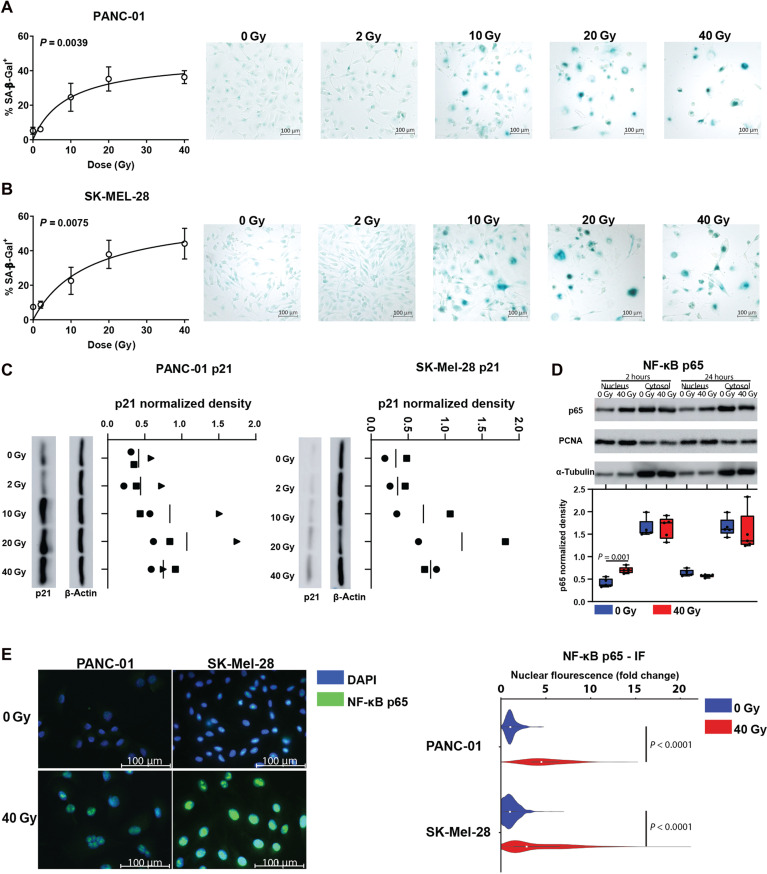
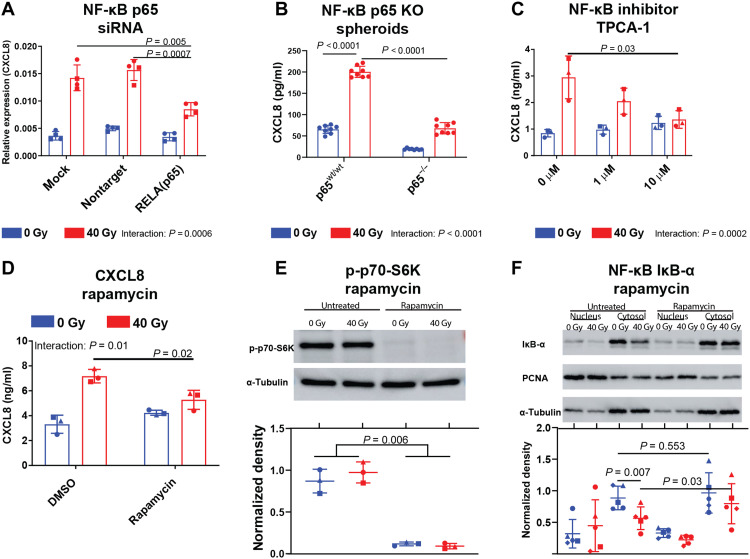
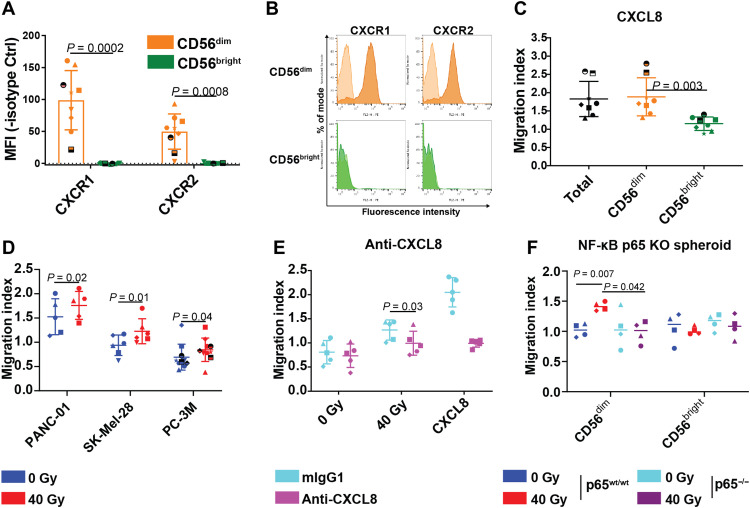
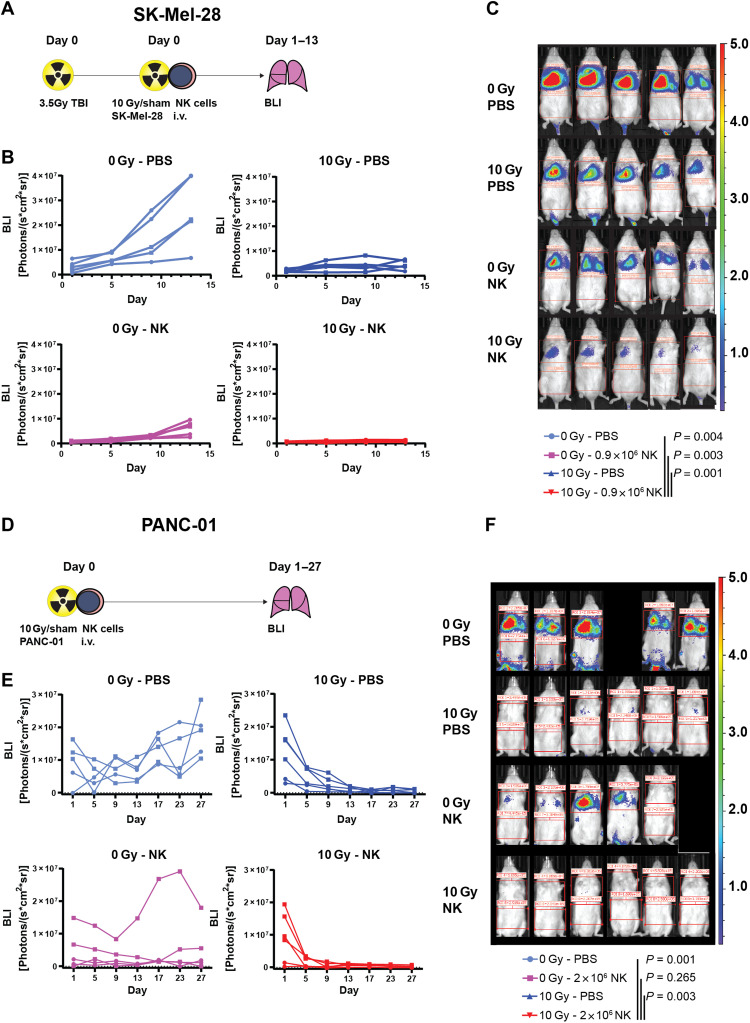
Radiotherapy is a mainstay cancer therapy whose antitumor effects partially depend on T cell responses. However, the role of Natural Killer (NK) cells in radiotherapy remains unclear. Here, using a reverse translational approach, we show a central role of NK cells in the radiation-induced immune response involving a CXCL8/IL-8-dependent mechanism. In a randomized controlled pancreatic cancer trial, CXCL8 increased under radiotherapy, and NK cell positively correlated with prolonged overall survival. Accordingly, NK cells preferentially infiltrated irradiated pancreatic tumors and exhibited CD56dim-like cytotoxic transcriptomic states. In experimental models, NF-κB and mTOR orchestrated radiation-induced CXCL8 secretion from tumor cells with senescence features causing directional migration of CD56dim NK cells, thus linking senescence-associated CXCL8 release to innate immune surveillance of human tumors. Moreover, combined high-dose radiotherapy and adoptive NK cell transfer improved tumor control over monotherapies in xenografted mice, suggesting NK cells combined with radiotherapy as a rational cancer treatment strategy.


Figures

Fig. 1.
Fig. 1.. RCTX modulates CXCL8 concentrations and NK cell numbers in patients with pancreatic cancer.
Leukocyte and cytokine levels were determined in pancreatic cancer patients undergoing RCTX followed by either combined gemcitabine and cetuximab (arm B) maintenance therapy or gemcitabine alone (arm A) in a randomized controlled clinical trial (ISRCTN56652283) (A to G). (B) Left: Heatmap indicating z-scored serum cytokine levels at time points indicated with color scale on the right. Right: Box plot indicating CXCL8 concentrations at time points indicated (n = 25 to 32 per time point). (C) Left: Heatmap indicating z-scored relative leukocyte numbers in peripheral blood as determined by the CIBERSORT algorithm with color scale depicted on the right. Right: Box plot indicating resting NK cell proportions at time points indicated (n = 23 to 25 per time point). (B and C) Q values were calculated using Wilcoxon matched-pairs signed rank tests and the Benjamini and Hochberg method. (D and E) Kaplan-Meier plot indicating overall survival of patients with above (CXCL8hi) or below (CXCL8lo) day 0 median CXCL8 serum levels of all patients (D) or in treatment arms A (I and III) and B (II and IV). (F) Kaplan-Meier plot indicating overall survival of patients with above (NKhi) or below (NKlo) total peripheral blood NK cell proportions as determined by the CIBERSORT algorithm at day 0. (G) Kaplan-Meier plots indicating overall survival of patients with above median (egresshi) or below median (egresslo) decrease in peripheral blood resting NK cell numbers in treatment arms A and B, as determined by CIBERSORT. NK egress: NK proportion d0/NK proportion d14 for all NK proportion d14 ≠ 0; NK egress, ∞ for NK proportion d14 = 0. (D to G) P values and hazard ratios (HRs) were calculated using log-rank tests. act, activated; cetux, cetuximab; D, day; frx, fractions; IMRT, intensity-modulated radiation therapy; mast, mast cells; rest = resting; TEM, T effector memory cell; Treg, regulatory T cell; DC, dendritic cell; HR, hazard ratio.
Fig. 2.
Fig. 2.. Pancreatic cancer–infiltrating NK cells exhibit CD56dim-like cytotoxic transcriptomic states.
NK cell abundance and phenotype were assessed in pancreatic cancer patients. (A) Box plot indicating the ratio of NKp46+ cells in the tumor core as opposed to the surrounding stroma in surgically resected pancreatic adenocarcinomas (PDACs) of n = 32 nonirradiated and n = 12 neo adjuvantly irradiated pancreatic cancer patients. P values were calculated using an unpaired t test (B) Representative immunohistochemistry images of NKp46 staining in an irradiated (RT) and a nonirradiated (non-RT) patient. (C to G) Transcriptomic states of PDAC-infiltrating NK cells were assessed using public single-cell RNA sequencing (scRNA-seq) data (26). (C and D) Uniform Manifold Approximation and Projection for Dimension Reduction (UMAP) showing n = 42,955 pancreas/PDAC-infiltrating leukocytes with PhenoGraph clusters (C, k = 30) or MAGIC-imputed (t = 3) gene expression highlighted in color codes below (D). (E) Heatmap showing z-scored (across cells) scran-normalized marker gene expression of PhenoGraph clusters indicated with CD56dim-like NK cells highlighted with black boxes and gene expression color code on the right. (F) Top: Heatmap indicating mean z-scored (across cells) scran-normalized expression of cytotoxic marker genes in T cell/NK cell and NKT cell clusters. CD56dim-like NK cells are highlighted with a black box. Bottom: Enrichment plot showing enrichment scores and log2 ratio, which was used as a metric to calculate ranks for gene set enrichment analysis (GSEA). (G) Volcano plot indicating differentially expressed genes between CD56dim-like NK cells and all remaining leukocytes as calculated by Wald’s test fitting a negative binomial model on raw count data. Genes with at least twofold change and a q value of <0.05 are highlighted in orange.
Fig. 3.
Fig. 3.. RT triggers CXCL8 release and NK cell migration toward irradiated tumors.
(A) Dot plot showing means ± SD chemokine concentrations in SK-Mel-28–conditioned media (CM) 5 days after irradiation from n = 3 independent experiments as individual symbols. (B) Heatmap indicating z-scored CXCL8 concentrations in CM 5 days after irradiation from two to four independent experiments per cell line. (C) Representative images and CXCL8 levels from PANC-01 spheroids after irradiation with n = 4 spheroids per condition from one experiment. (D) Dot plots indicating means ± SD CXCL8 RNA levels relative to GAPDH after irradiation in SK-Mel-28 cells from n = 3 experiments as individual symbols. (A to D) P values were calculated using ratio paired t tests (two-tailed). (E to G) NOD.Cg-PrkdcSCID IL2rgtm1Wjl/SzJ (NSG) mice were intravenously (i.v.) injected with luciferase-transfected SK-Mel-28 melanoma cells and treated with 20-Gy lung field irradiation/sham irradiation as indicated in (E). (F) Dot plots indicating the number per area of CXCL8+ metastases 5 to 10 days after irradiation of n = 13 mice from two independent experiments highlighted with different symbols and P value calculated with a Mann-Whitney U test. (G) Dot plot indicating CXCL8 RNA levels relative to glyceraldehyde phosphate dehydrogenase (GAPDH) 3 days after irradiation in murine tumor bearing lungs (n = 11) and P value calculated using an unpaired t test. (H and I) NSG mice were treated like in (E) and intravenously injected with overnight IL-2–cultured NK cells as indicated in (H). (I) Left: Dot plot indicating means ± SD NK cell numbers per milliliter peripheral blood ± SD 7 days after injection from one experiment with n = 5 NK cell donors as individual symbols. Right: Dot plots indicating means ± SD NK cells per lung from two independent experiments (days 2 and 7) with n = 3 and n = 5 NK cell donors, respectively, depicted as individual symbols. P values were calculated using two-way ANOVA.
Fig. 4.
Fig. 4.. Radiation induces senescence features and NF-κB pathway activation in tumor cells.
(A and B) XY plot (left) showing the mean proportion ± SD of SA-β-Gal+ cells or representative images (right) of cell lines indicated. Tumor cells were irradiated after plating and stained for SA-β-Gal 4 days after irradiation. Indicated are data from n = 2 independent experiments per cell line. The connecting line was calculated by fitting a hyperbola curve. P values were calculated using ANOVA. (C) p21 expression in whole-cell lysates was determined by immunoblot 4 days after irradiation with indicated doses for PANC-01 cells (left panel) or SK-Mel-28 cells (right panel). Depicted are data from two to three experiments performed in parallel (biological replicates). Data points from individual experiments are highlighted by different symbols. (D) p65 expression in subcellular fractions was determined by immunoblot (WB) of SK-Mel-28 cellular fractions at indicated time points. Top: Indicated are representative WBs. Bottom: Box plots indicating p65 integrated density (ID) in WB images. For nuclear fractions, p65 IDs were divided by PCNA IDs. For cytosol fractions, p65 IDs were divided by α-tubulin IDs. Indicated are n = 5 separate WBs from three independent experiments with different symbols representing data from individual WBs. P value was calculated using a paired t test. (E) Left: Representative immunocytochemistry (IF) images of NF-κB p65 expression in PANC-01 and SK-Mel-28 cells 1 day after irradiation with 40 Gy. Right: Violin plots showing p65 fold change nuclear fluorescence in 40 Gy–irradiated (red) or mock-treated (blue) cells. Boxes within the violin plots indicate the median of n = 338 cells from two (PANC-01) and n = 2686 cells from three (SK-Mel-28) independent experiments, and P values were calculated using unpaired t tests.
Fig. 5.
Fig. 5.. NF-κB and mTOR activities orchestrate radiation-induced CXCL8 release.
(A) Dot plots indicating means ± SD CXCL8 RNA levels relative to GAPDH in SK-Mel-28 cells transfected with p65 siRNA or nontarget siRNA 2 days after irradiation with 40 Gy. Indicated are two independent experiments with n = 4 separate transfections indicated as individual symbols (one symbol type for each experiment). (B to D) Dot plots indicating means ± SD CXCL8 concentrations in conditioned growth media of p65 knockout PANC-01 spheroids 7 days after irradiation (B) or SK-Mel-28 cells treated with the NF-κB inhibitor TPCA-1 (C) or rapamycin (D) 3 days after irradiation. Indicated are (B) n = 8 spheroids per condition of one representative of two independent experiments with different clones (second experiment in fig. S13C) or (C and D) n = 3 independent experiments as individual symbols. P values were calculated using unpaired (B) or paired t tests (A, C, and D) and repeated measures two-way ANOVA (D). (E and F) Representative images or dot plots of phospho-p70 expression in whole SK-Mel-28 cell lysates (E) or of IκB-α expression in subcellular fractions (F) was determined by WB. Top: Indicated is a representative WB. Bottom: Box plots indicating integrated density (ID) in WB images. For nuclear fractions, p65 IDs were divided by PCNA IDs. For cytosol fractions and whole-cell lysates, p65 IDs were divided by α-tubulin IDs. Indicated are n = 5 separate WBs from three independent experiments with each dot representing one WB. P values were calculated using paired t tests or a two-way ANOVA. KO, knockout; DMSO, dimethyl sulfoxide.
Fig. 6.
Fig. 6.. NF-κB–dependent CXCL8 release mediates NK cell migration toward irradiated tumor cells.
(A) Dot plots showing chemokine receptor surface expression of freshly isolated primary human NK cells. Indicated are means of median fluorescence intensities (MFIs) ± SD from five independent experiments of n = 9 donors indicated as individual symbols. Dashed line indicates an MFI of zero. (B) Representative histograms of chemokine receptor surface expression (filled) or respective isotype control stainings (shaded) of freshly isolated primary human NK cells. (C to F) Dot plots showing mean overnight IL-2–activated NK cell migration indices ± SD toward recombinant CXCL8 (10 ng/ml) (C), CM from different tumor cell lines 5 days after irradiation with 40 Gy (RT) or mock treatment (non-RT) (D), conditioned growth media of 40 Gy–irradiated SK-Mel-28 cells treated or untreated with neutralizing CXCL8 antibody (E), or toward 40 Gy irradiated (RT) or mock-irradiated (non-RT) p65wt/wt or p65−/− PANC-01 spheroids (F). Indicated are mean migration indices ± SD of n = 8 NK cell donors from five independent experiments (C), n = 5 to 10 NK cell donors per cell line from three to five experiments (D), n = 5 CD56dim NK cell donors from two independent experiments (E), and n = 5 CD56dim NK cell donors from three independent experiments (F). Donors are indicated as individual symbols. P values (two-tailed) were calculated using paired t tests.
Fig. 7.
Fig. 7.. Combined radiation and adoptive NK cell transfer abrogate tumor growth in mice.
NK cells in PBS or PBS alone and 10 Gy–irradiated or nonirradiated luciferase-transduced tumor cells were intravenously injected into NSG mice. Tumor load in the lungs was determined by BLI at time points indicated. (A to C) SK-Mel-28 cells were injected in TBI (3.5 Gy) NSG mice (A). (B) Scatterplots indicating tumor sizes of individual mice with individual data points indicated as dots and lines connecting data points of each individual mouse. Indicated are merged data from two independent experiments for a total of n = 5 mice per group (the first experiment n = 3 per group, indicated as circles, the second experiment n = 2 per group indicated as squares). (C) Representative overlay pictures of photographs and BLI pseudocolor maps at day 13 with color code depicted on the right. (D to F) PANC-01 was injected into nonirradiated NSG mice (D). (E) Scatterplots indicating tumor sizes of individual mice with individual data points indicated as dots and lines connecting data points of each individual mouse. Indicated are merged data from two independent experiments for a total of n = 5 to 6 mice per group (the first experiment n = 2 per group indicated as circles, the second experiment n = 3 to 4 per group indicated as squares). (F) Representative overlay pictures of photographs and BLI pseudocolor maps at day 27 with color code depicted on the right. P values were calculated using repeated measures two-way ANOVA or a mixed-effects model approach if missing values were encountered.

Similar articles

Cited by

References

    1. Bonner J. A., Harari P. M., Giralt J., Azarnia N., Shin D. M., Cohen R. B., Jones C. U., Sur R., Raben D., Jassem J., Ove R., Kies M. S., Baselga J., Youssoufian H., Amellal N., Rowinsky E. K., Ang K. K., Radiotherapy plus cetuximab for squamous-cell carcinoma of the head and neck. N. Engl. J. Med. 354, 567–578 (2006). - PubMed
    1. Klug F., Prakash H., Huber P. E., Seibel T., Bender N., Halama N., Pfirschke C., Voss R. H., Timke C., Umansky L., Klapproth K., Schäkel K., Garbi N., Jäger D., Weitz J., Schmitz-Winnenthal H., Hämmerling G. J., Beckhove P., Low-dose irradiation programs macrophage differentiation to an iNOS(+)/M1 phenotype that orchestrates effective T cell immunotherapy. Cancer Cell 24, 589–602 (2013). - PubMed
    1. Matsumura S., Wang B., Kawashima N., Braunstein S., Badura M., Cameron T. O., Babb J. S., Schneider R. J., Formenti S. C., Dustin M. L., Demaria S., Radiation-induced CXCL16 release by breast cancer cells attracts effector T cells. The Journal of Immunology 181, 3099–3107 (2008). - PMC - PubMed
    1. Xue W., Zender L., Miething C., Dickins R. A., Hernando E., Krizhanovsky V., Cordon-Cardo C., Lowe S. W., Senescence and tumour clearance is triggered by p53 restoration in murine liver carcinomas. Nature 445, 656–660 (2007). - PMC - PubMed
    1. Coppé J.-P., Patil C. K., Rodier F., Sun Y., Muñoz D. P., Goldstein J., Nelson P. S., Desprez P.-Y., Campisi J., Senescence-associated secretory phenotypes reveal cell-nonautonomous functions of oncogenic RAS and the p53 tumor suppressor. PLoS Biol. 6, 2853–2868 (2008). - PMC - PubMed

Publication types