. 2022 Mar 25;8(12):eabl4354.
doi: 10.1126/sciadv.abl4354. Epub 2022 Mar 23.

Cotranscriptionally encoded RNA strand displacement circuits

Affiliations

Cotranscriptionally encoded RNA strand displacement circuits

Samuel W Schaffter et al. Sci Adv. .

Abstract

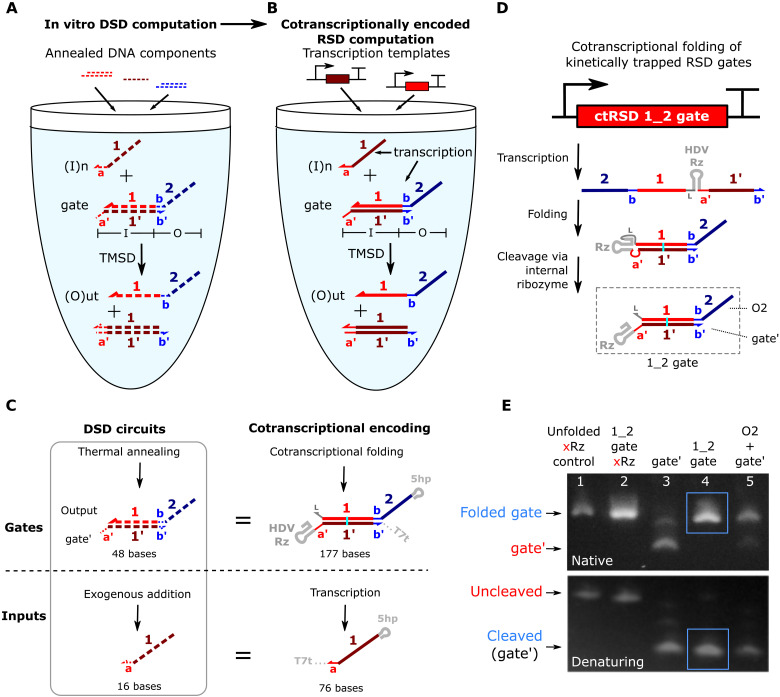
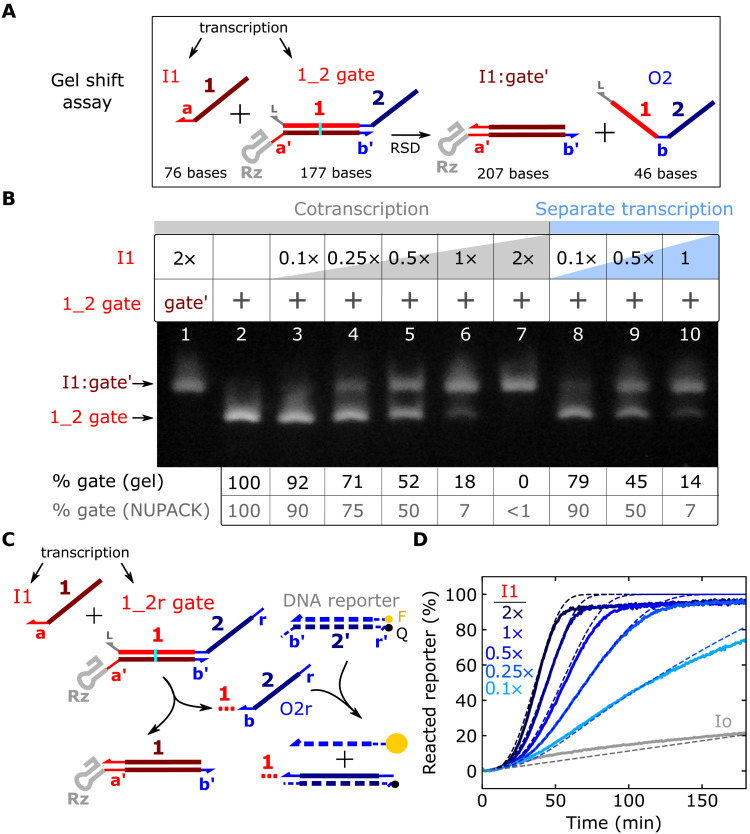
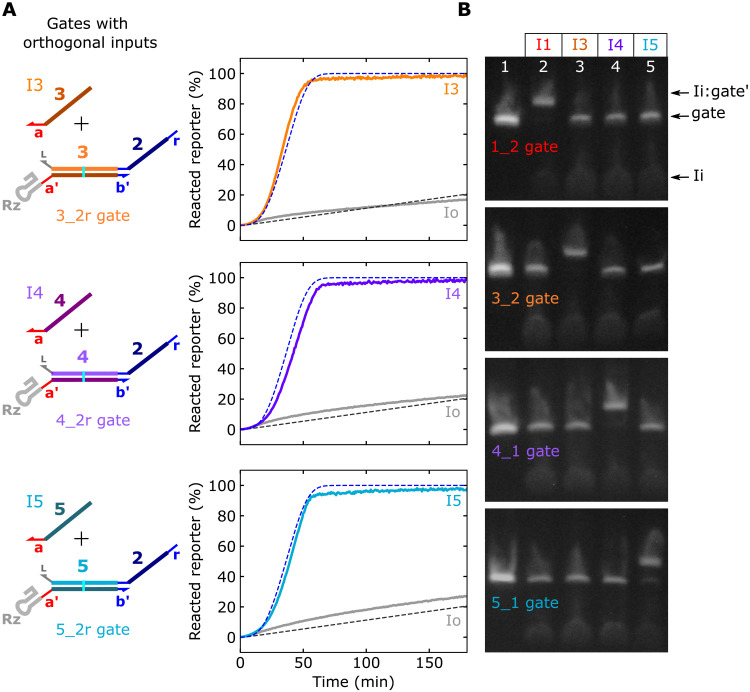
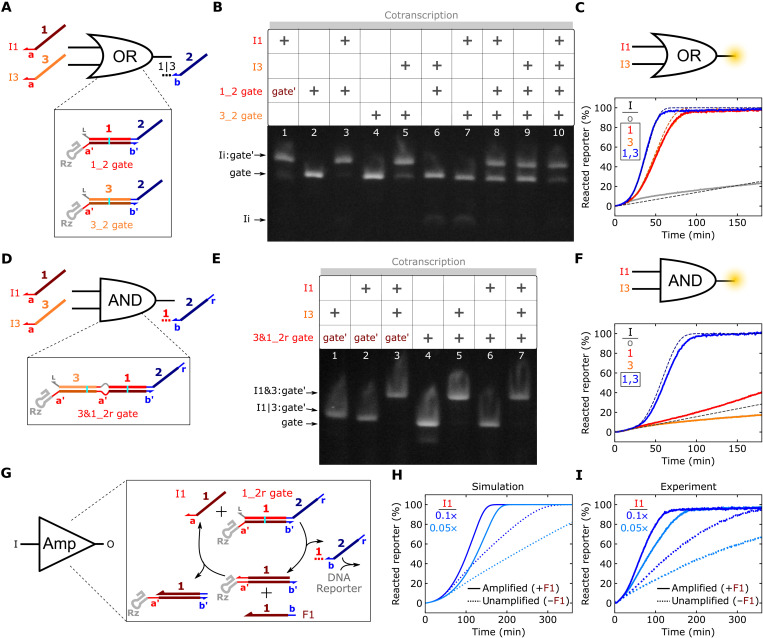
Engineered molecular circuits that process information in biological systems could address emerging human health and biomanufacturing needs. However, such circuits can be difficult to rationally design and scale. DNA-based strand displacement reactions have demonstrated the largest and most computationally powerful molecular circuits to date but are limited in biological systems due to the difficulty in genetically encoding components. Here, we develop scalable cotranscriptionally encoded RNA strand displacement (ctRSD) circuits that are rationally programmed via base pairing interactions. ctRSD circuits address the limitations of DNA-based strand displacement circuits by isothermally producing circuit components via transcription. We demonstrate circuit programmability in vitro by implementing logic and amplification elements, as well as multilayer cascades. Furthermore, we show that circuit kinetics are accurately predicted by a simple model of coupled transcription and strand displacement, enabling model-driven design. We envision ctRSD circuits will enable the rational design of powerful molecular circuits that operate in biological systems, including living cells.


Figures

Fig. 1.
Fig. 1.. Cotranscriptionally encoded RNA strand displacement (ctRSD) circuit design.
(A) In DNA strand displacement (DSD) circuits, pre-annealed DNA gates are mixed to build a circuit. Strand exchange between the input and gate releases an output. (B) In ctRSD circuits, designed transcription templates produce the RNA components that make up a circuit. DNA and RNA are represented with dashed and solid lines, respectively. Bold letters and numbers represent sequence identity. A prime (′) denotes complementarity. Only one domain of each complementary pair will be shown in subsequent figures for simplicity. The I and O below the gate represent input and output domains, respectively. (C) Transcriptional encoding of ctRSD components. All RNAs have a 5′ hairpin (5hp) and a 3′ terminator (T7t). For simplicity, these motifs are omitted elsewhere. The cyan line represents a G-U wobble pair. The gate contains a self-cleaving ribozyme (HDV Rz) to enable cotranscriptional folding of kinetically trapped gates (D) (see fig. S1 for schematics with sequences). (D) ctRSD gates fold into RNA hairpins that self-cleave to produce reactive dsRNA products. Input and output domains define gate names (e.g., “1_2 gate”). (E) Gel electrophoresis demonstrating gate folding and cleavage (lane 4, blue box) after 30 min of transcription followed by 30 min of deoxyribonuclease (DNase) degradation. Lane 1: a transcript that is the same length as the gate but does not fold into a hairpin or cleave (xRz). Lane 2: the 1_2 gate without cleavage (xRz). Lane 3: the gate′ strand (Rz, a′-, 1′-, and b′-domains) alone. Lane 5: separate transcription of the output (O2) and gate′ strands. The 46-base single-stranded O2 strand stained poorly for visualization (see fig. S2 for control transcript designs) (52).
Fig. 2.
Fig. 2.. Characterization of strand displacement in ctRSD circuits.
(A) Strand displacement between an input and a ctRSD gate. The I1:gate′ complex has 30 more bases than the gate. (B) Native RNA gel electrophoresis demonstrating strand displacement in a ctRSD circuit. Lane 1: I1:gate′ complex. Lane 2: 1_2 gate. Lanes 3 to 7: 25 nM 1_2 gate template was cotranscribed with 2.5 nM (0.1×) to 50 nM (2×) I1 template. The 46-base output strand of the gate (O2) was not visible (52). Transcription proceeded for 30 min, and electrophoresis was conducted 2 hours after DNase I addition. Lanes 8 to 10: I1 and 1_2 gate templates were transcribed separately for 30 min and subsequently incubated with DNase I for 30 min. Samples were then mixed in equal volumes and incubated at 37°C for 2 hours before electrophoresis. The table below the gel shows that the percentage of 1_2 gate in each lane agrees with NUPACK predictions (see fig. S14 for additional conditions). (C) Schematic of the fluorescent DNA reporter assay to measure O2r production. The red dotted line trailing O2r represents the upstream portion of the output strand not involved in downstream reactions. F and Q denote fluorophore and quencher modifications, respectively. (D) Experimental (solid lines) and simulated (dashed lines) DNA reporter signal during cotranscription of the 1_2r gate with different I1 template concentrations. The gray lines indicate the 1_2r gate cotranscribed with a randomized input sequence (Io) that does interact with the 1_2r gate. DNA template and T7 RNAP concentrations are tabulated in table S4 (see section S5 for simulation details).
Fig. 3.
Fig. 3.. Orthogonal ctRSD input and gate sequences.
(A) Fluorescent DNA reporter signal during cotranscription of 25 nM gates with orthogonal input domains and 50 nM of the designed input template or 50 nM of the Io template. The dashed lines show the results of the model for the 1_2r gate from Fig. 2D. (B) Native gel electrophoresis results demonstrating orthogonality of the four gate and input sequences. In each gel, 25 nM of a single ctRSD gate was cotranscribed with no input (lane 1) or 50 nM of the (I1, I3, I4, or I5) template. Transcription proceeded for 30 min, and electrophoresis was conducted 2 hours after degradation of DNA templates with DNase I. The 1_2 gate and 3_2 gate samples were analyzed on the same gel. The 4_1 gate and 5_1 gate samples were analyzed on the same gel. Both gel images were taken with the same setting and were otherwise unmodified. See section S1 for schematics with sequences.
Fig. 4.
Fig. 4.. Characterization of ctRSD logic and catalytic amplification elements.
(A) A ctRSD OR circuit element. (B) Native gel electrophoresis results for the OR element. Transcription proceeded for 30 min, and electrophoresis was conducted 30 min after DNase I addition. The gate′ strand is from the 1_2 gate. (C) Experimental (solid lines) and simulated (dashed lines) reporter signal during cotranscription of the OR element with different inputs. The trajectories for I1 alone and I3 alone overlap. The 1_2r and 3_2r gates were used in this experiment. (D) A ctRSD AND circuit element (see section S1 for schematics with sequences). (E) Native RNA gel electrophoresis results for the AND element. Transcription proceeded for 30 min, and electrophoresis was conducted 1 hour after DNase I addition. The gate′ is from the 3&1_2r gate. (F) Experimental (solid lines) and simulated (dashed lines) DNA reporter signal during cotranscription of the AND element with different inputs. The trajectories for Io alone and I3 alone overlap. (G) ctRSD catalytic amplification element. (H and I) Simulated (H) and experimental (I) DNA reporter signal during cotranscription of the 1_2r gate and I1 with (solid lines) and without (dashed lines) the F1 template (1×). For the gel results, gate and input templates were 25 and 50 nM, respectively. DNA template and T7 RNAP concentrations are tabulated in table S4.
Fig. 5.
Fig. 5.. Characterization of ctRSD cascades.
(A) Schematic of one- to four-layer cascades. Green arrows indicate the sole input template included for each cascade layer. The colored dotted lines trailing outputs represent the upstream portion of the output strand not involved in downstream reactions. (B) Experimental (solid lines) and simulated (dashed lines) DNA reporter signal for each layered cascade in (A). Transparent lines represent each cascade with the Io template rather than the correct input template. (C to F) Experimental (solid lines) and simulated (dashed lines) reporter signal for each of the logic circuits depicted above the plots. Boxes in (C) to (F) denote the sets of inputs that should result in output release. Overlapping kinetic trajectories are labeled in the plots. In (F), the simulation results for Io, I4, and I5 all overlap with the experimental results for I4. DNA template and T7 RNAP concentrations are tabulated in table S4.

Similar articles

Cited by

References

    1. Sedlmayer F., Aubel D., Fussenegger M., Synthetic gene circuits for the detection, elimination and prevention of disease. Nat. Biomed. Eng. 2, 399–415 (2018). - PubMed
    1. Ke J., Wang B., Yoshikuni Y., Microbiome engineering: Synthetic biology of plant-associated microbiomes in sustainable agriculture. Trends Biotechnol. 39, 244–261 (2021). - PubMed
    1. Keasling J. D., Manufacturing molecules through metabolic engineering. Science 330, 1355–1358 (2010). - PubMed
    1. Cherry K. M., Qian L., Scaling up molecular pattern recognition with DNA-based winner-take-all neural networks. Nature 559, 370–376 (2018). - PubMed
    1. Qian L., Winfree E., Scaling up digital circuit computation with DNA strand displacement cascades. Science 332, 1196–1201 (2011). - PubMed