. 2022 Mar 23;14(637):eabh3831.
doi: 10.1126/scitranslmed.abh3831. Epub 2022 Mar 23.

Hepatic IRF3 fuels dysglycemia in obesity through direct regulation of Ppp2r1b

Affiliations

Hepatic IRF3 fuels dysglycemia in obesity through direct regulation of Ppp2r1b

Suraj J Patel et al. Sci Transl Med. .

Abstract

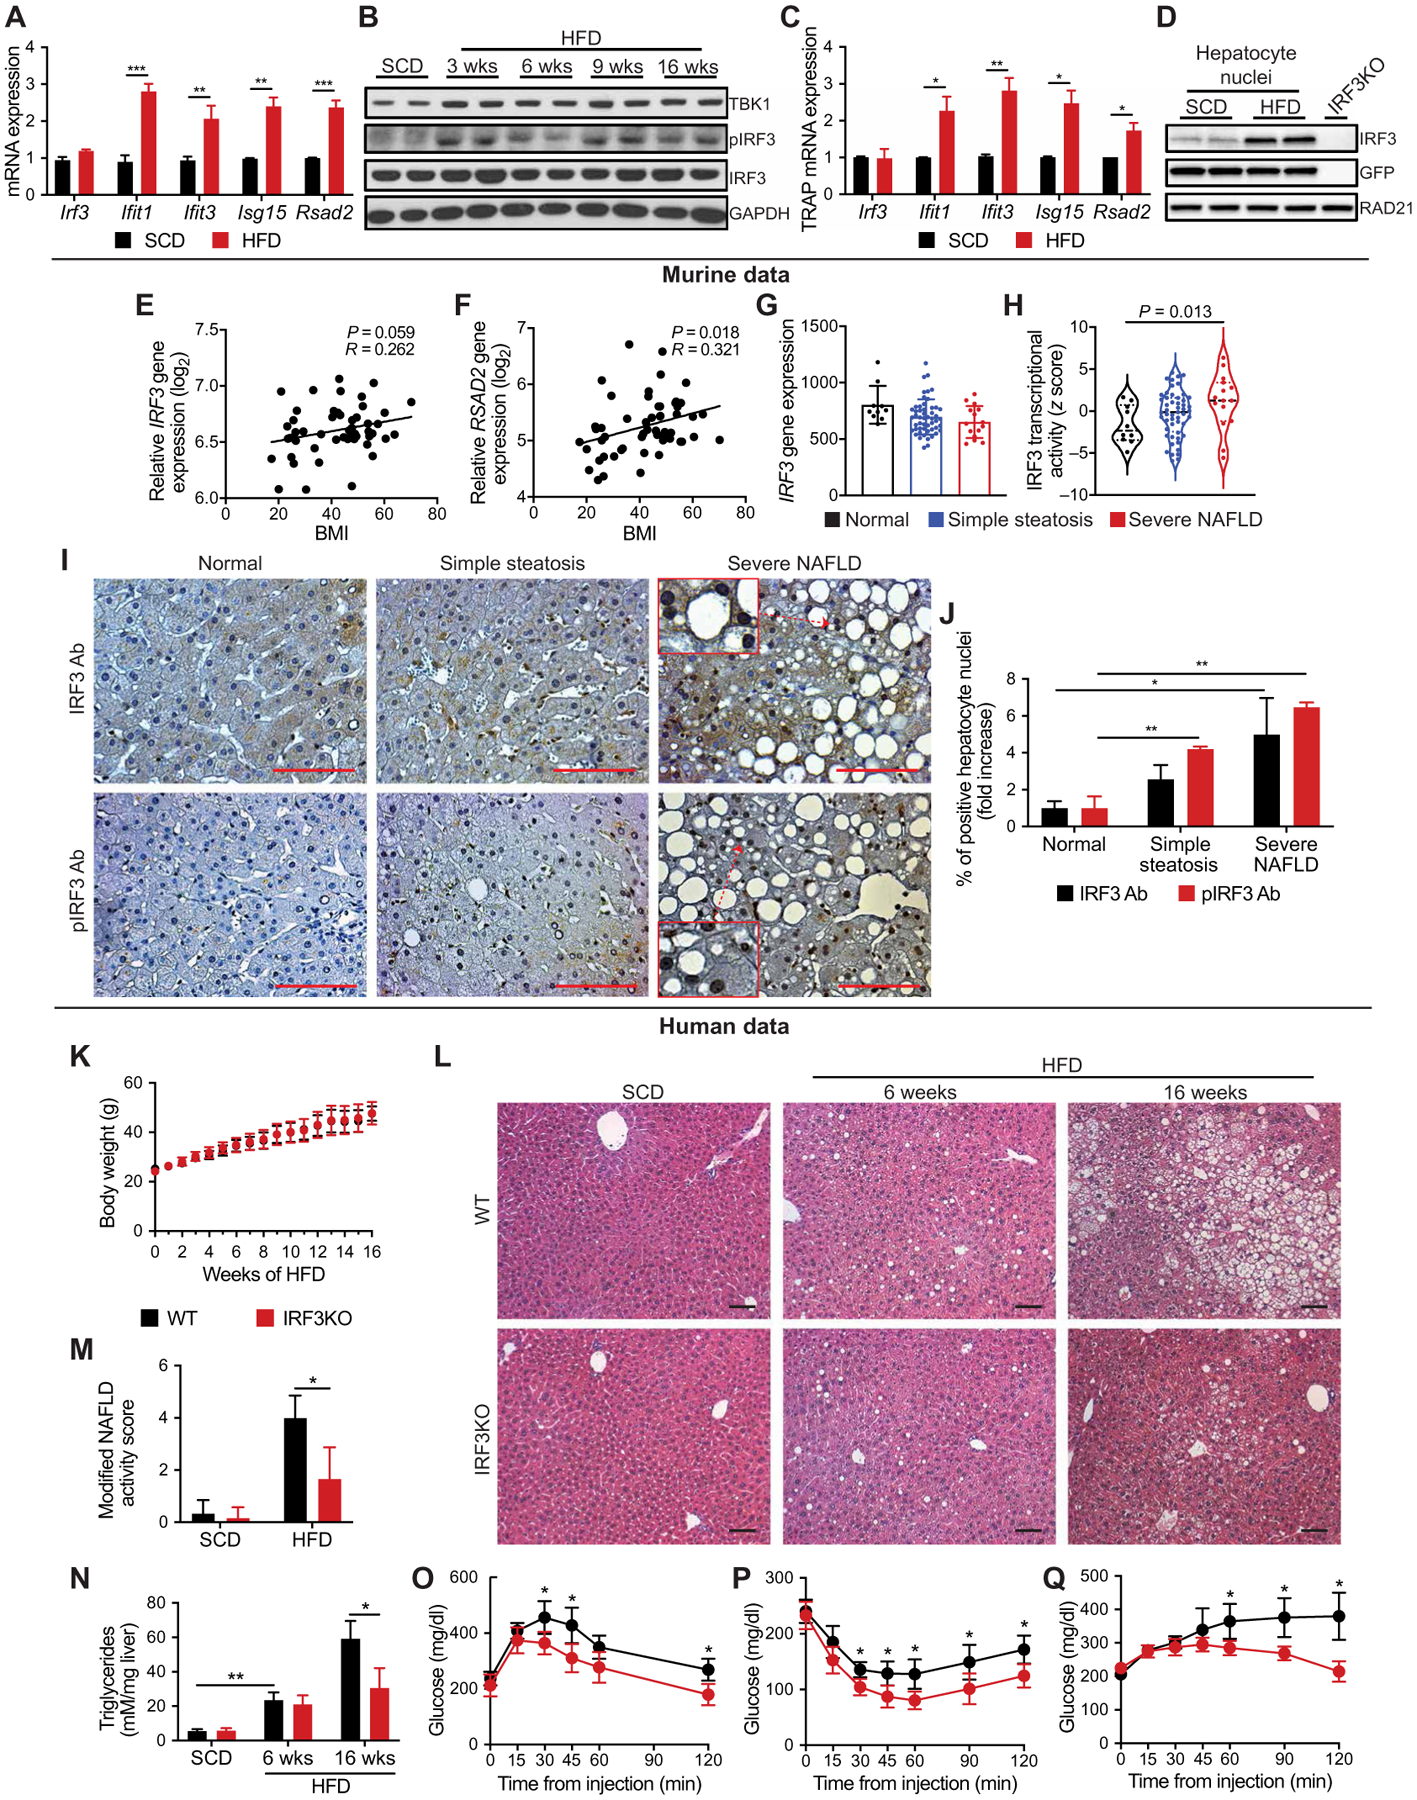
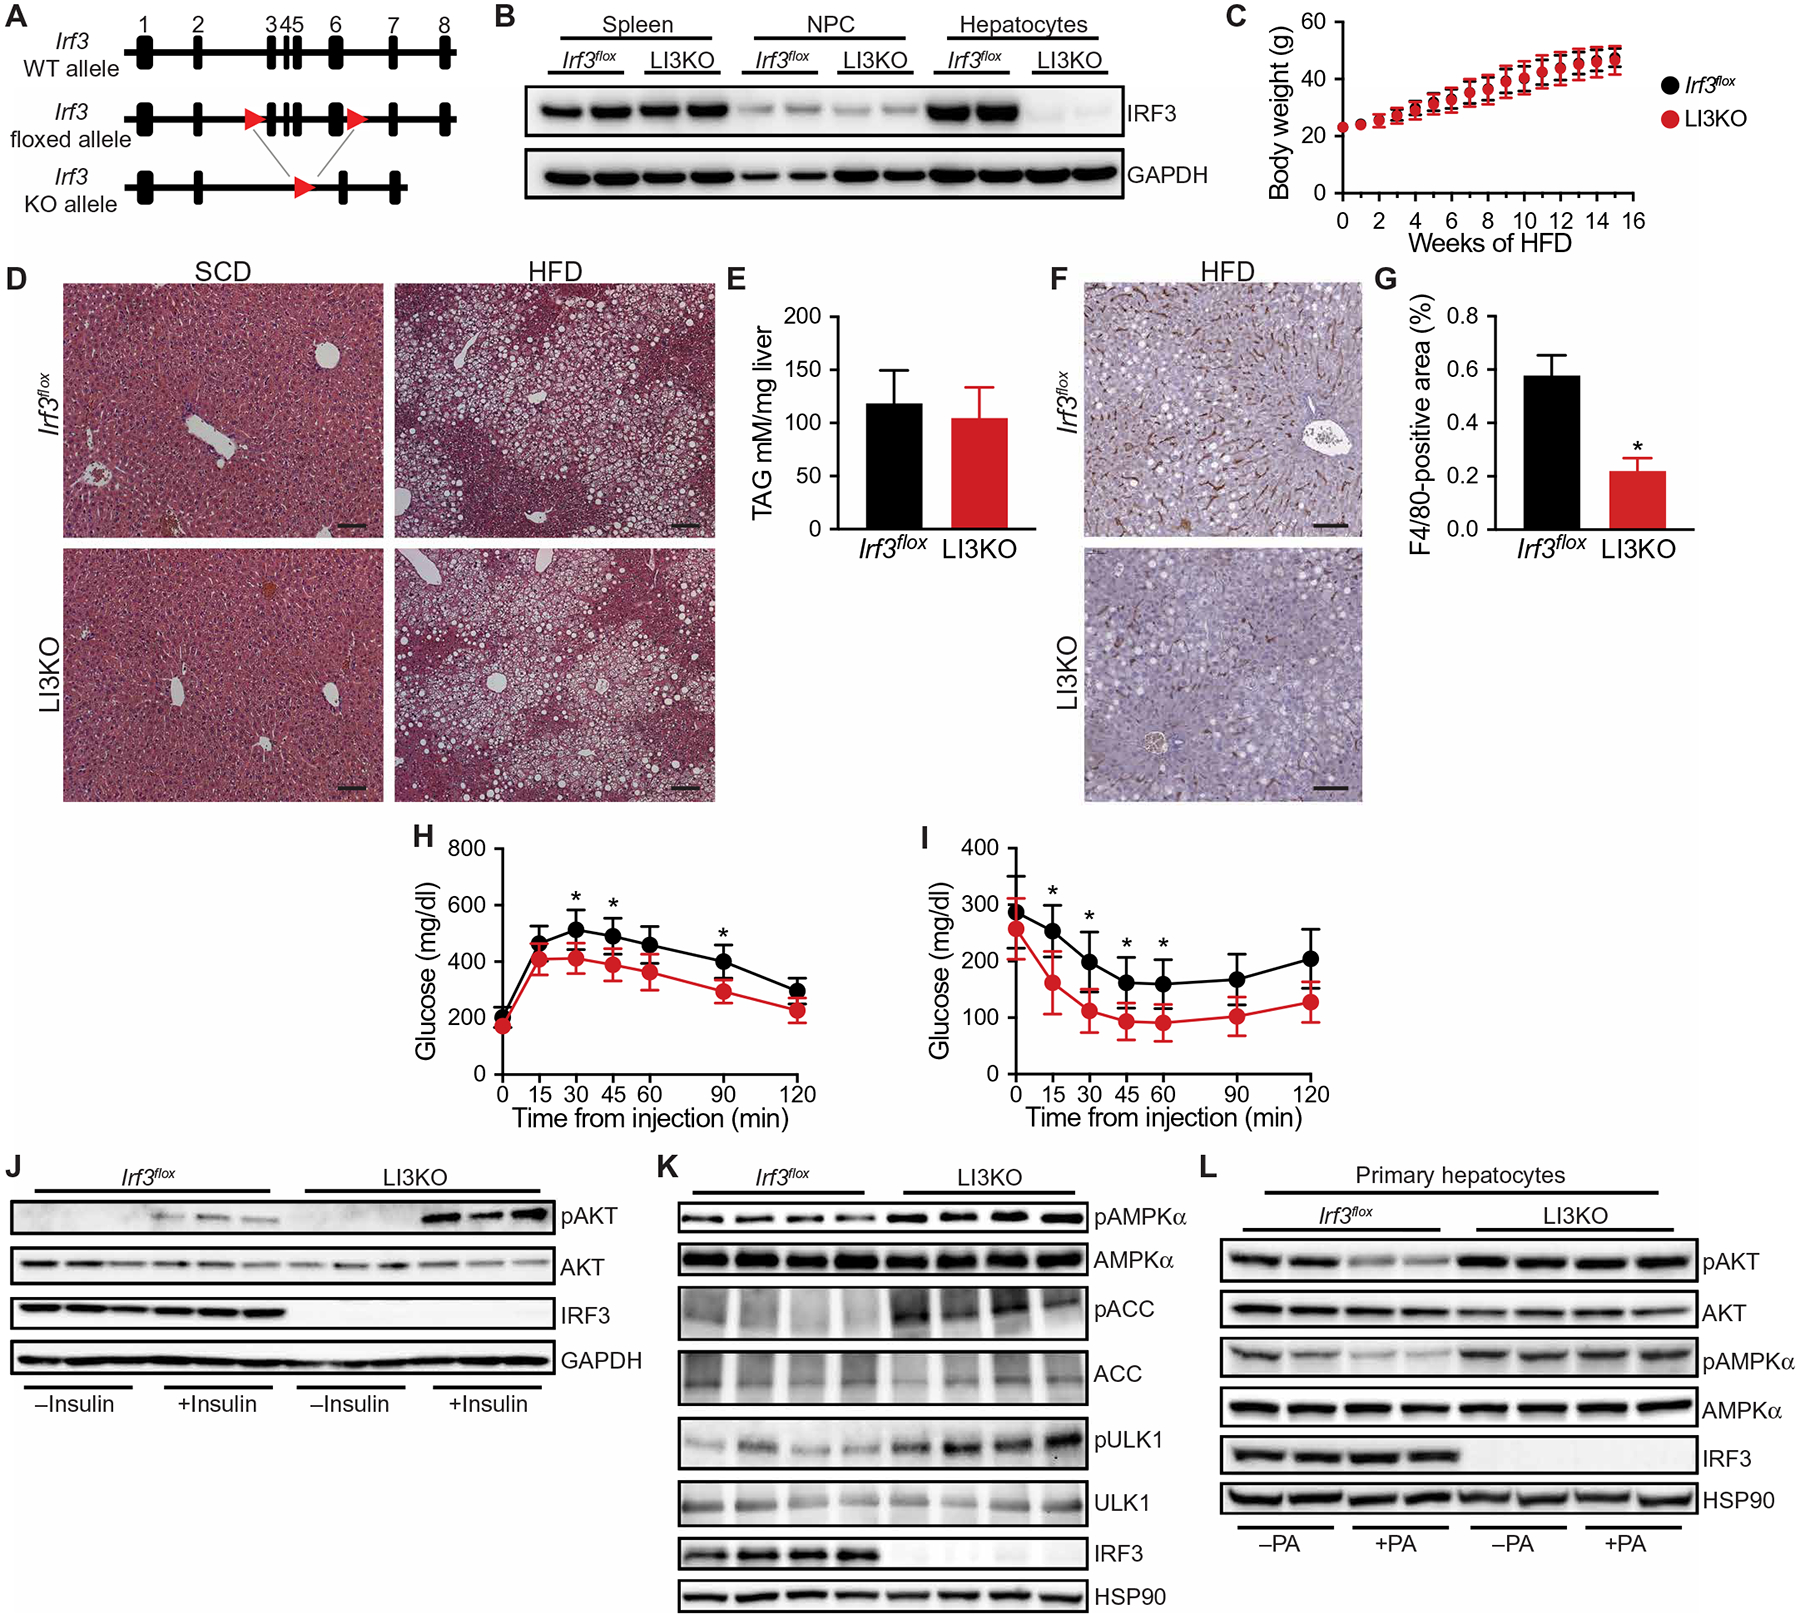
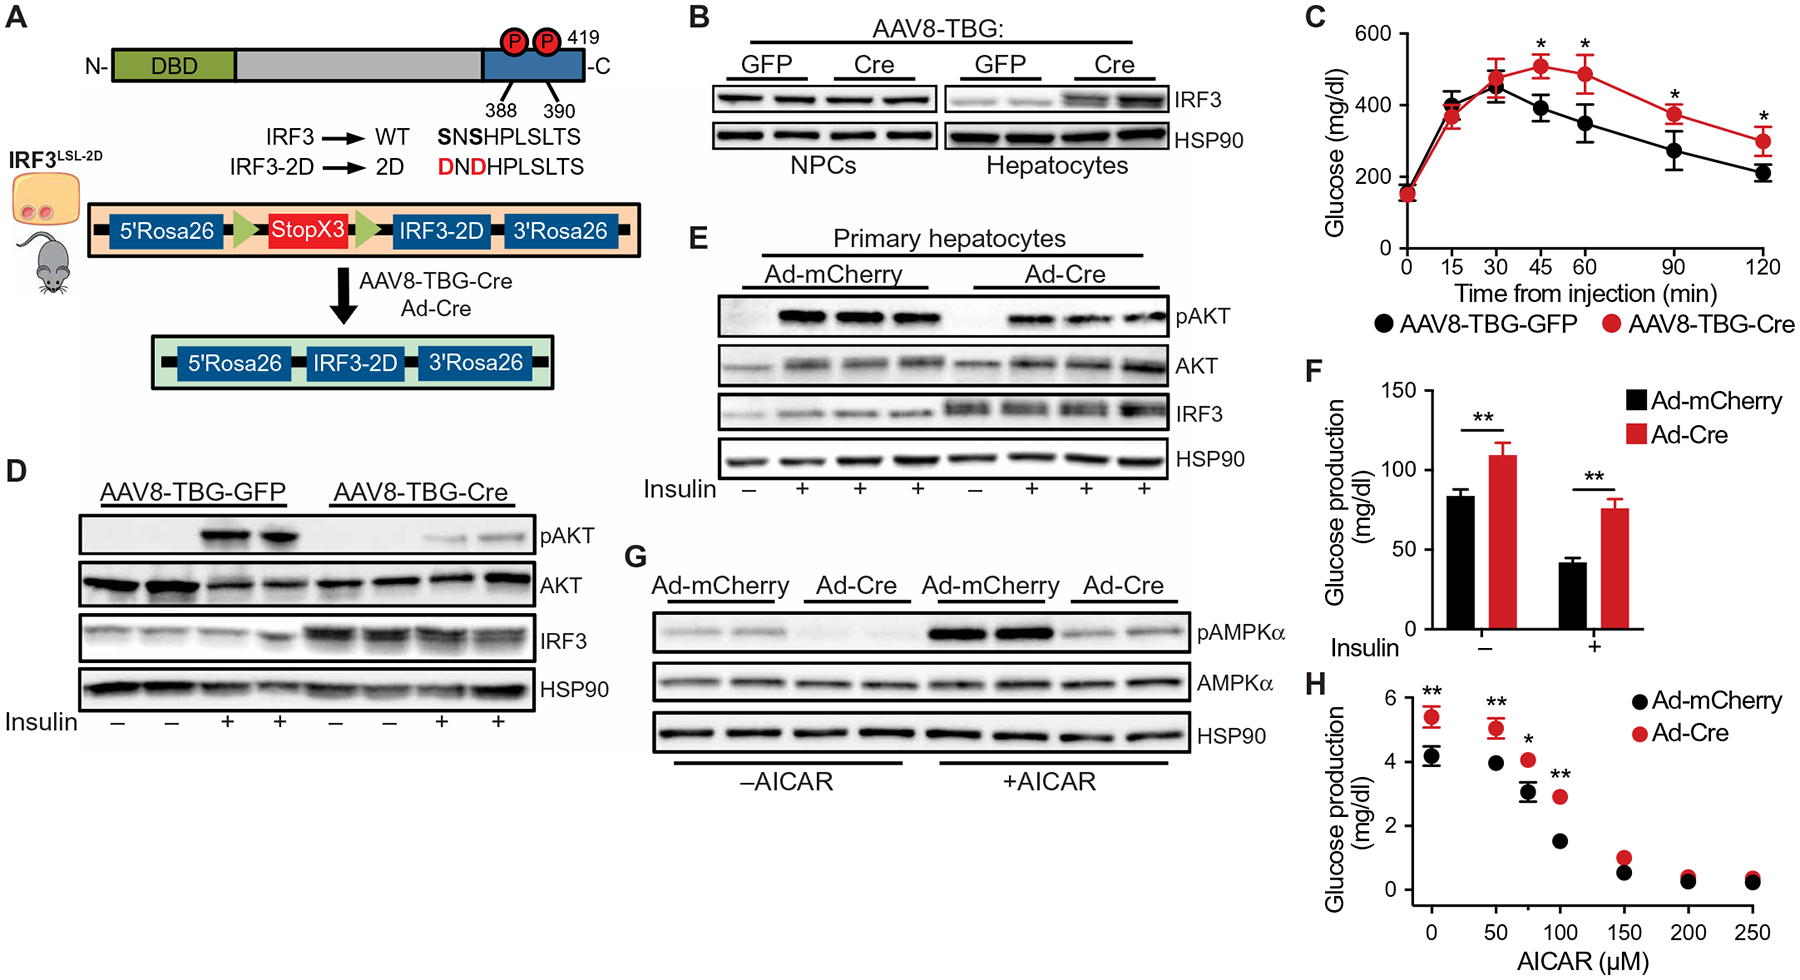
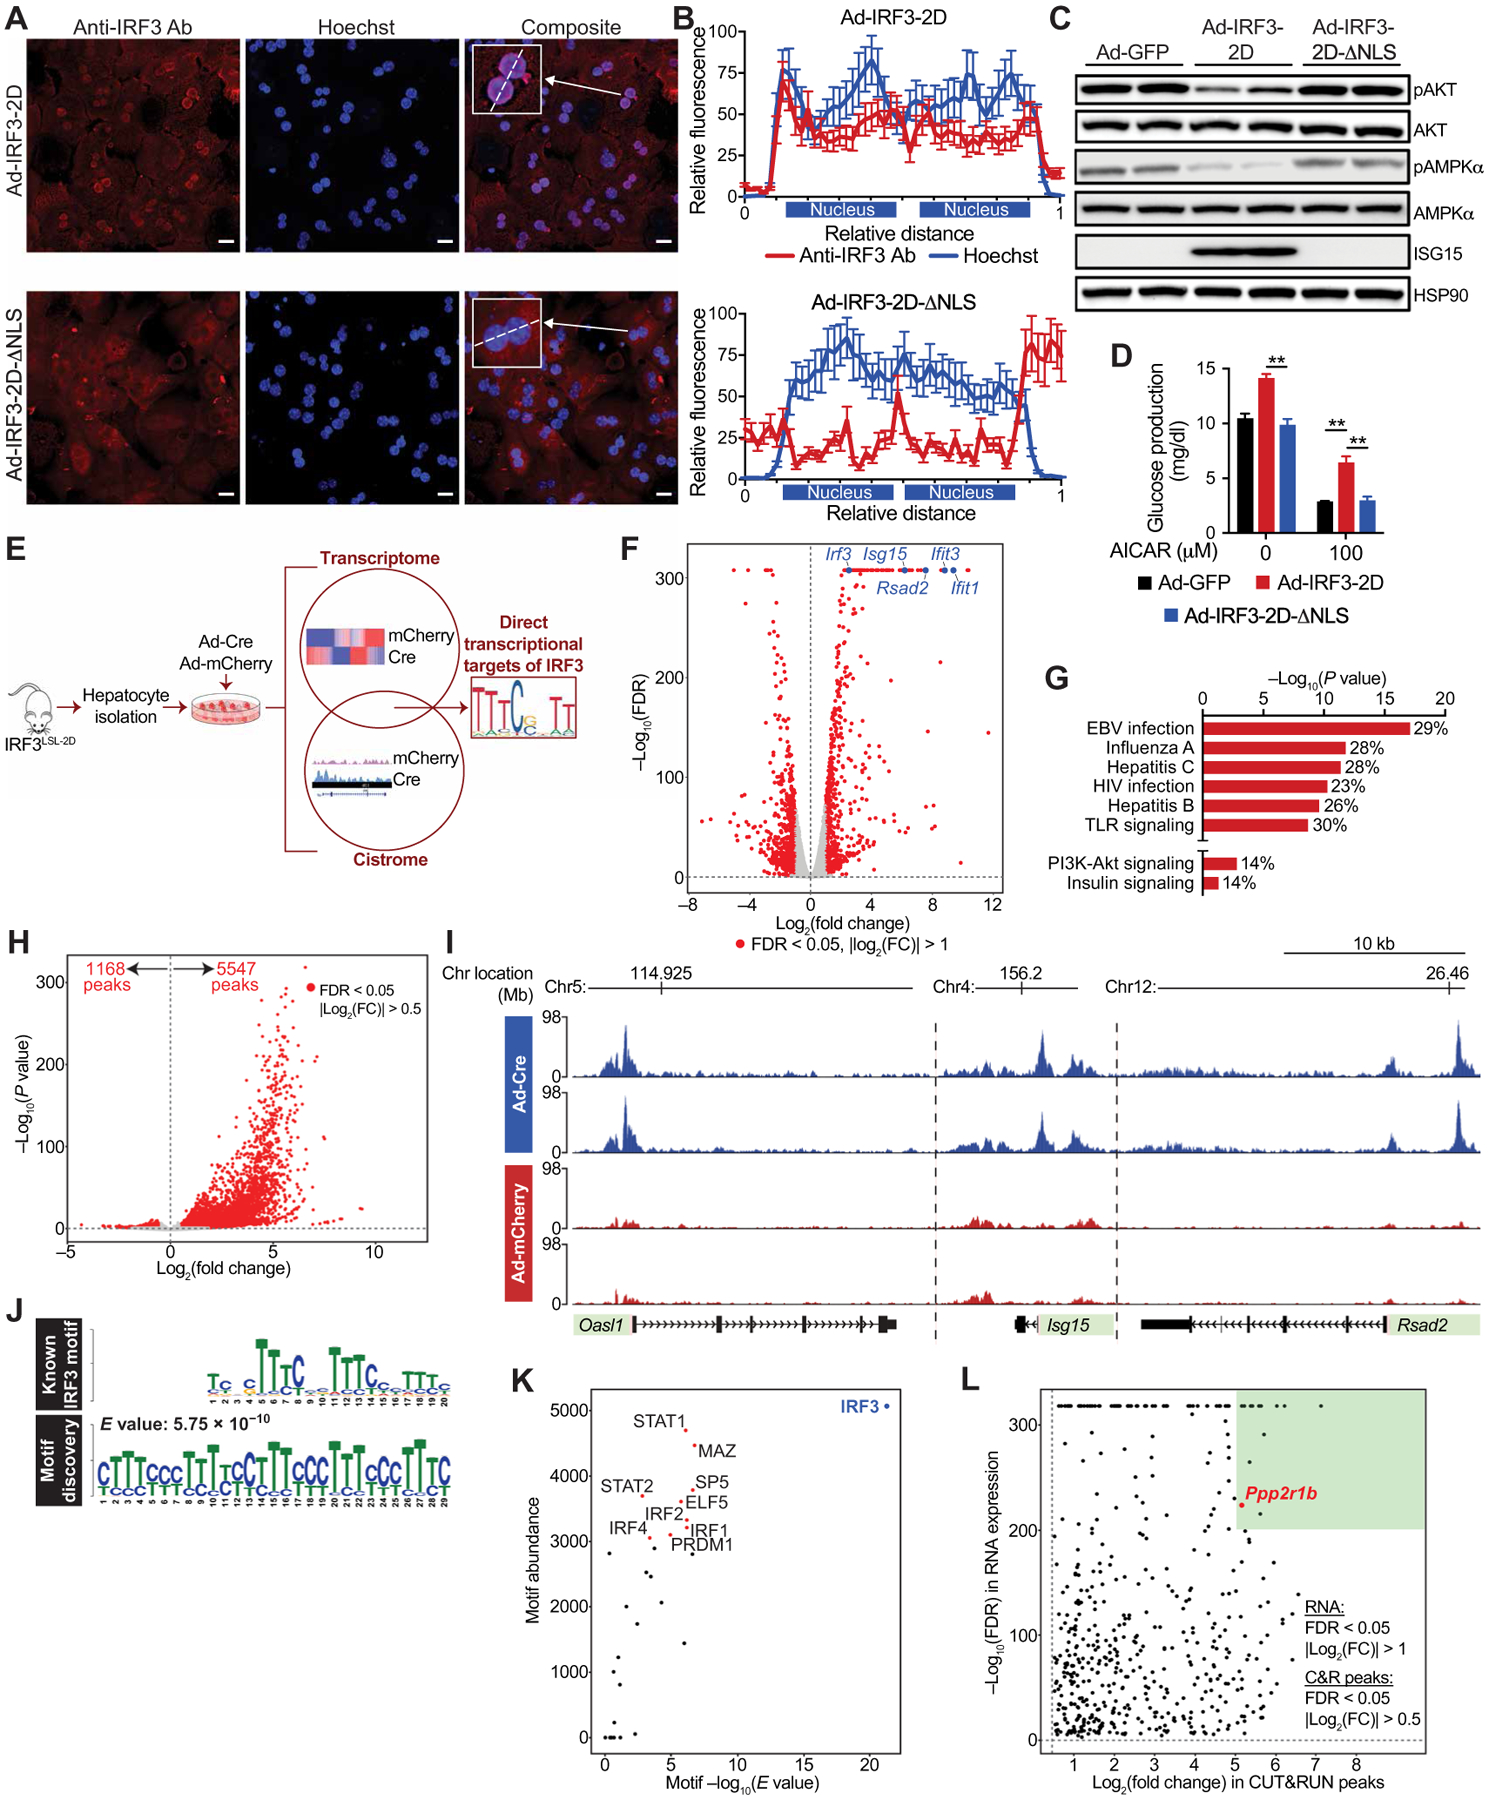
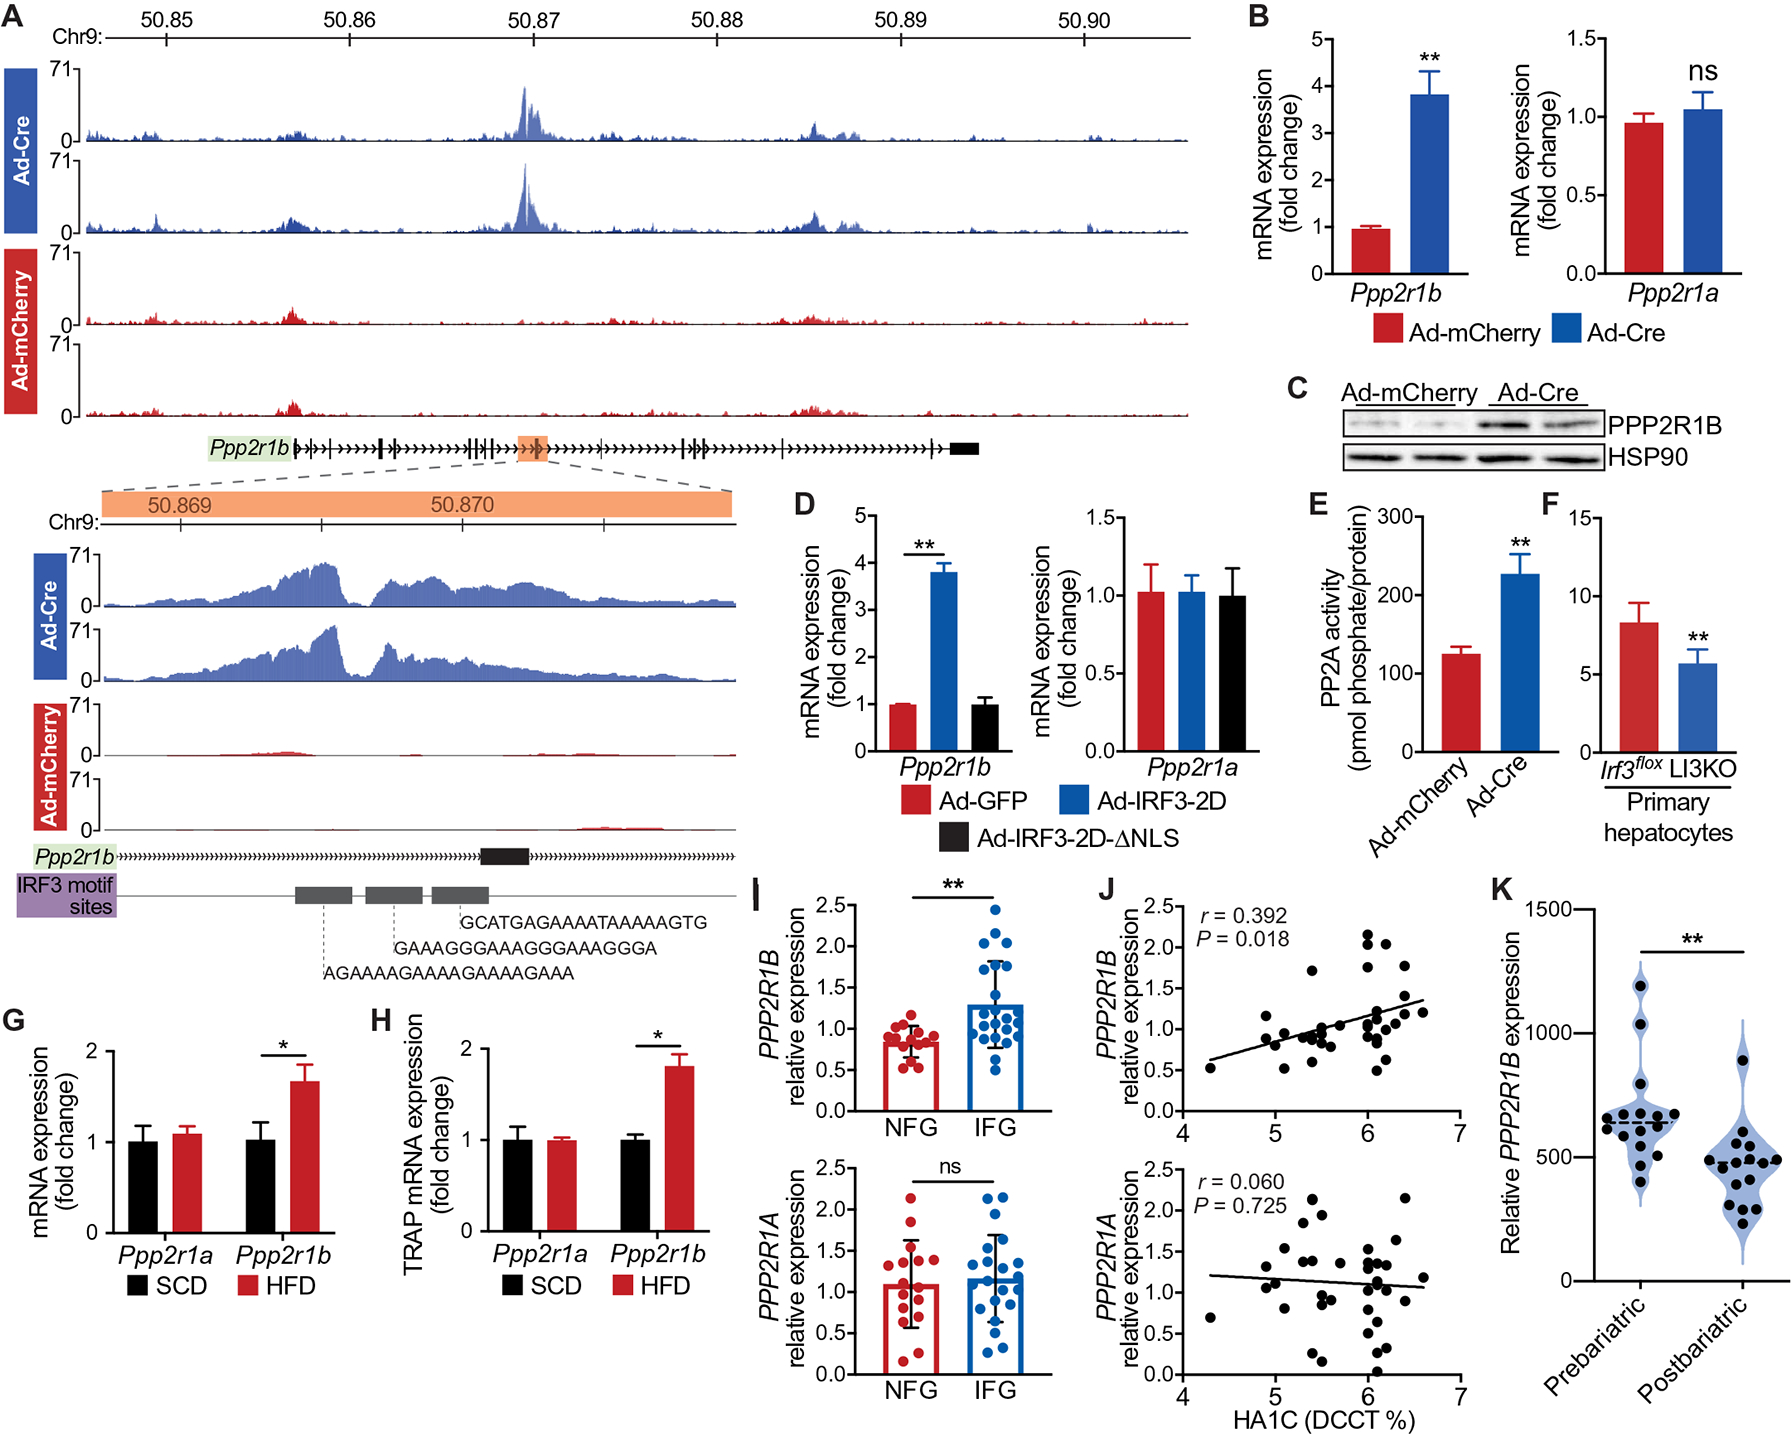
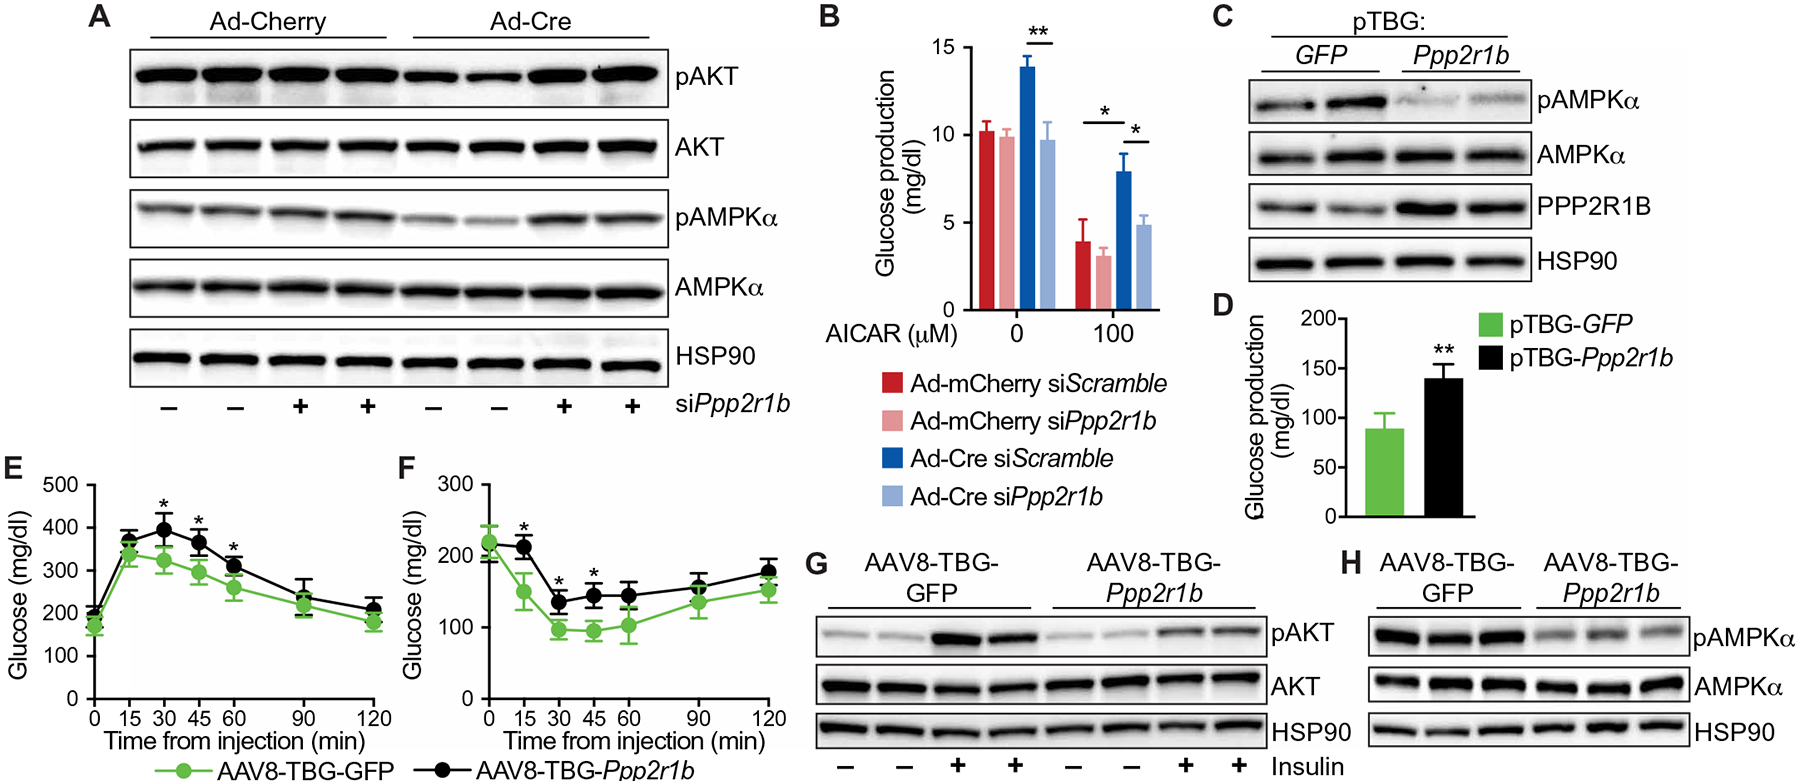
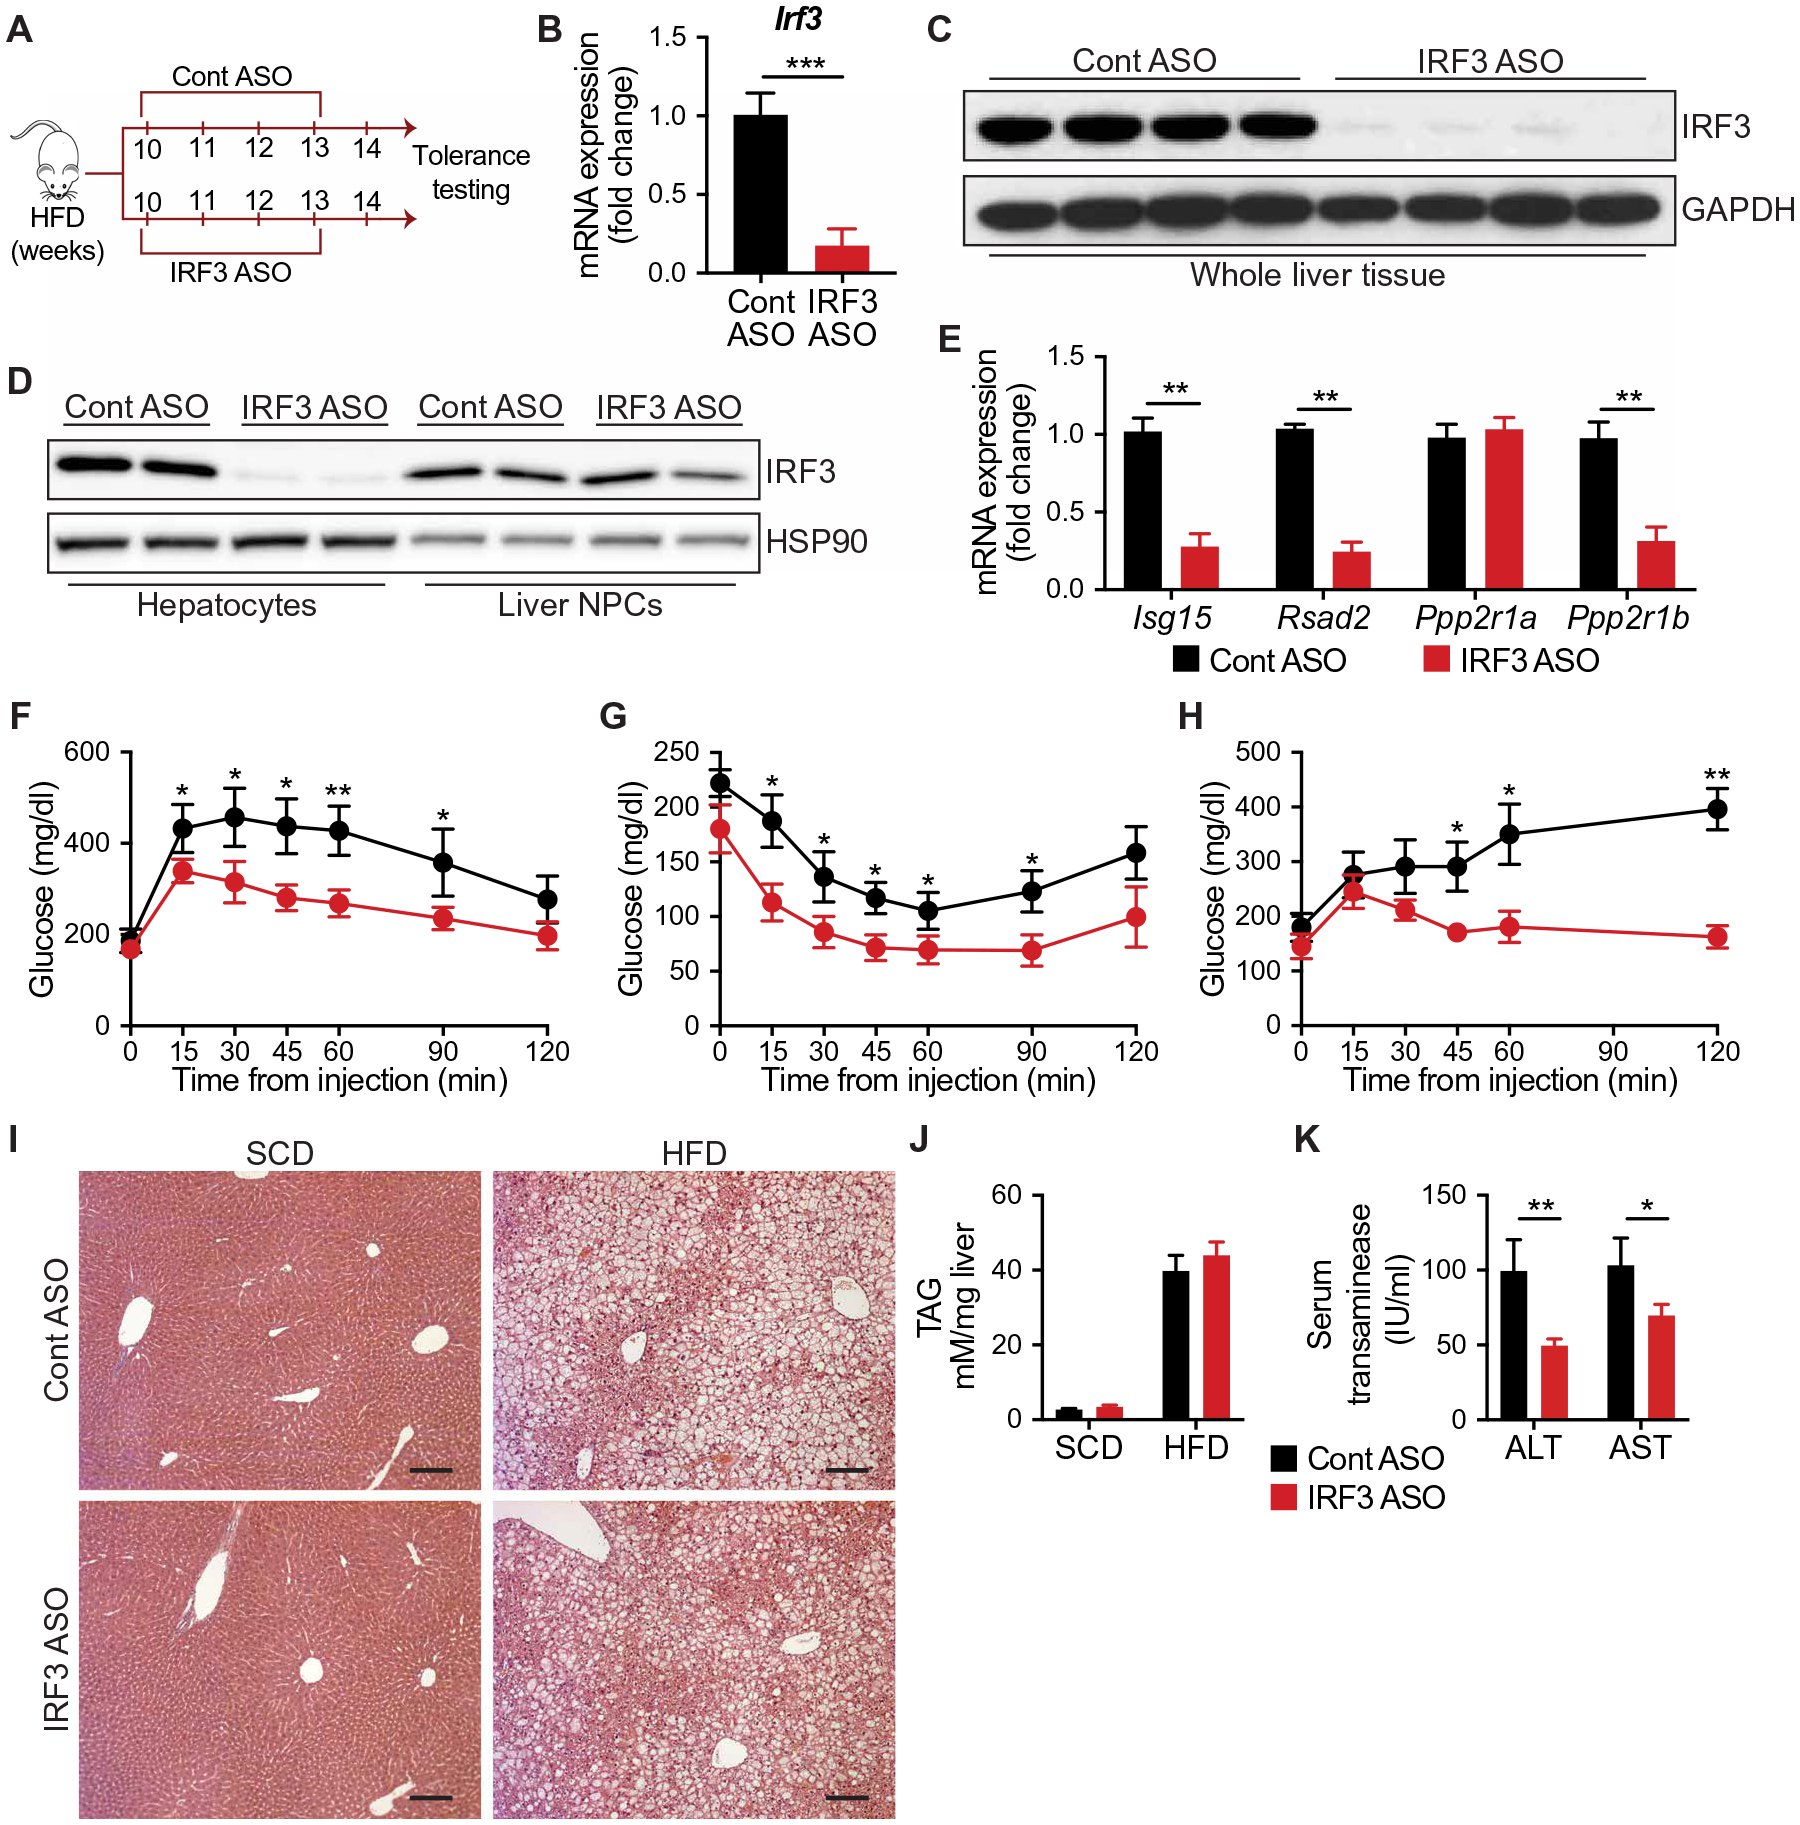
Inflammation has profound but poorly understood effects on metabolism, especially in the context of obesity and nonalcoholic fatty liver disease (NAFLD). Here, we report that hepatic interferon regulatory factor 3 (IRF3) is a direct transcriptional regulator of glucose homeostasis through induction of Ppp2r1b, a component of serine/threonine phosphatase PP2A, and subsequent suppression of glucose production. Global ablation of IRF3 in mice on a high-fat diet protected against both steatosis and dysglycemia, whereas hepatocyte-specific loss of IRF3 affects only dysglycemia. Integration of the IRF3-dependent transcriptome and cistrome in mouse hepatocytes identifies Ppp2r1b as a direct IRF3 target responsible for mediating its metabolic actions on glucose homeostasis. IRF3-mediated induction of Ppp2r1b amplified PP2A activity, with subsequent dephosphorylation of AMPKα and AKT. Furthermore, suppression of hepatic Irf3 expression with antisense oligonucleotides reversed obesity-induced insulin resistance and restored glucose homeostasis in obese mice. Obese humans with NAFLD displayed enhanced activation of liver IRF3, with reversion after bariatric surgery. Hepatic PPP2R1B expression correlated with HgbA1C and was elevated in obese humans with impaired fasting glucose. We therefore identify the hepatic IRF3-PPP2R1B axis as a causal link between obesity-induced inflammation and dysglycemia and suggest an approach for limiting the metabolic dysfunction accompanying obesity-associated NAFLD.


Conflict of interest statement

Competing interests: A.T. receives funding from Johnson & Johnson, Medtronic, and GI Windows for studies related to bariatric surgery, as well as consulting fees from Bausch Health, Novo Nordisk, and Eli Lilly. The other authors declare that they have no competing interests.

Figures

Fig. 1.
Fig. 1.. IRF3 is activated in liver tissue of obese mice and humans, promoting steatohepatitis and insulin resistance.
(A) Expression of IFN-stimulated genes (ISGs) in liver tissue from male mice fed SCD or HFD for 6 weeks (n = 4). (B) Immunoblot showing TANK-binding kinase 1 (TBK1), phosphorylated IRF3 (pIRF3; Ser396), and total IRF3 in liver tissue from male mice fed SCD or HFD for 3, 6, 9, and 16 weeks. (C) Expression of hepatocyte ISGs in TRAP liver tissue from male NuTRAPalb mice fed SCD or HFD for 6 weeks (n = 4). (D) Immunoblot showing IRF3 and GFP in hepatocyte nuclei from male NuTRAPalb mice fed SCD or HFD for 6 weeks, as well as total liver cell nuclei from male IRF3KO mice on SCD (last lane). Nuclei from NuTRAPalb mice were sorted by flow cytometry on the basis of hepatocyte-specific nuclear GFP expression. (E) Expression of IRF3 and (F) RSAD2 in liver tissue from healthy lean and obese patients correlated with BMI (n = 54). (G) Expression of IRF3 and (H) transcriptional activity of IRF3 in liver tissue from obese patients without NAFLD (normal), with simple steatosis, or with severe NAFLD (NAFLD activity score > 5; n = 77). (I) Liver tissue from obese patients without NAFLD (normal), with simple steatosis, or with severe NAFLD, stained for pIRF3 (Ser396) or total IRF3 (representative images from n = 14 patients). Ab, antibody. Scale bars, 100 μm. (J) Quantification of hepatocyte nuclei that stained positive for pIRF3 or total IRF3. (K to Q) Male WT and IRF3KO littermate mice were fed HFD for 3 to 16 weeks. (K) Total body weight of WT and IRF3KO mice during HFD feeding (n = 8 to 15). (L) Hematoxylin and eosin (H&E) staining of liver tissue and (M) modified NAFLD activity score of liver histology from WT and IRF3KO mice fed SCD or HFD for 6 or 16 weeks (n = 6–9). Scale bars, 100 μm. (N) Liver triglyceride (TAG) content in WT and IRF3KO mice fed SCD or HFD for 6 or 16 weeks (n = 4 to 9). (O) Glucose (1 g/kg), (P) insulin (1.75 U/kg), and (Q) pyruvate (1.25 g/kg) tolerance tests performed on WT and IRF3KO mice after 13, 14, and 15 weeks on HFD, respectively (n = 8 to 11). Data are presented as means ± SD; *P < 0.05, **P < 0.01, and ***P < 0.001.
Fig. 2.
Fig. 2.. Hepatocyte deficiency in IRF3 improves obesity-induced insulin sensitivity and glucose homeostasis.
(A) Schematic of floxed Irf3 allele. (B) Immunoblot showing IRF3 in the spleen, liver nonparenchymal cells (NPCs), and hepatocytes from 6-week-old male Irf3flox and LI3KO mice. (C) Total body weight of male Irf3flox and LI3KO littermate mice during HFD feeding (n = 12 to 14). (D) H&E staining of liver tissue from male Irf3flox and LI3KO mice fed SCD or HFD for 20 weeks. Scale bars, 100 μm. (E) Liver triglyceride (TAG) content in male Irf3flox and LI3KO mice fed SCD or HFD for 20 weeks (n = 10 to 12). (F) F4/80 immunostaining of liver tissue from male Irf3flox and LI3KO mice fed HFD for 20 weeks. Scale bars, 100 μm. (G) Quantification of F4/80+ cells (n = 10). (H) Glucose (1.25 g/kg) and (I) insulin (1.5 U/kg) tolerance tests performed on male Irf3flox and LI3KO mice fed HFD for 18 or 19 weeks, respectively (n = 10 to 12). (J) Immunoblot showing insulin-stimulated phosphorylated AKT (pAKT; Ser473) and total AKT in liver tissue from male Irf3flox and LI3KO mice fed HFD for 20 weeks. Mice were fasted for 5 hours, injected intraperitoneally with insulin (5 U/kg), and then euthanized 5 min later. Liver tissue was harvested within 90 s. (K) Immunoblot showing phosphorylated AMPKα (pAMPKα; Thr172) and total AMPKα, phosphorylated ACC (pACC; S79) and total ACC, and phosphorylated ULK1 (pULK1; S555) and total ULK1 in liver tissue from male Irf3flox and LI3KO mice fed HFD for 20 weeks. Mice were fasted for 5 hours before euthanasia. (L) Immunoblot showing pAKT, AKT, pAMPKα, and AMPKα in palmitic acid (PA; 500 μM)–treated primary hepatocytes isolated from 6-week-old male Irf3flox and LI3KO mice. Data are presented as means ± SD; *P < 0.05.
Fig. 3.
Fig. 3.. Activation of hepatocyte IRF3 drives insulin resistance and glucose production, and inhibits AMPKα phosphorylation.
(A) Schematic of IRF3-2D allele and AAV8-TBG-Cre infection strategy. (B) Immunoblot showing IRF3 in liver NPCs and hepatocytes isolated from 6-week-old male IRF3LSL-2D mice tail vein–injected with AAV8-TBG-GFP or AAV8-TBG-Cre. (C) Glucose tolerance test (1 g/kg) in male IRF3LSL-2D mice fed HFD for 10 weeks with tail vein injection of AAV8-TBG-GFP or AAV8-TBG-Cre on week 8 of HFD (n = 6 to 7). (D) Immunoblot showing insulin-stimulated pAKT (Ser473), total AKT, and IRF3 in liver tissue from 10-week-old male IRF3LSL-2D mice on SCD, tail vein–injected with AAV8-TBG-GFP or AAV8-TBG-Cre 2 weeks prior. Mice were fasted for 5 hours, injected intraperitoneally with insulin (5 U/kg), and euthanized 5 min later. Liver tissue was harvested within 90 s. (E) Immunoblot showing insulin-stimulated pAKT (Ser473), total AKT, and IRF3 in hepatocytes isolated from 6-week-old male IRF3LSL-2D mice and transduced ex vivo with adenovirus expressing Cre recombinase (Ad-Cre) or mCherry (Ad-mCherry). Hepatocytes were stimulated with 5 nM insulin in serum-free William’s E medium for 5 min. (F) Glucose production in hepatocytes isolated from 6-week-old male IRF3LSL-2D mice, transduced ex vivo with Ad-Cre or Ad-mCherry, and treated with 8-CPT–cyclic AMP in the presence or absence of insulin (5 nM; n = 4). (G) Immunoblot showing AICAR-stimulated pAMPKα (Thr172) and total AMPKα in hepatocytes isolated from 6-week-old male IRF3LSL-2D mice and transduced ex vivo with Ad-Cre or Ad-mCherry. Hepatocytes were stimulated with 100 μM AICAR in glucose production media for 6 hours. (H) Glucose production in hepatocytes isolated from 6-week-old male IRF3LSL-2D mice, transduced ex vivo with Ad-Cre or Ad-mCherry, and treated with various dosing of AICAR for 6 hours in glucose production media (n = 4). Data are presented as means ± SD; *P < 0.05, **P < 0.01.
Fig. 4.
Fig. 4.. Transcriptionally active IRF3 is necessary for its effects on hepatic insulin and AMPK signaling.
(A) Representative confocal fluorescence images of WT primary hepatocytes transduced ex vivo with adenovirus expressing IRF3-2D (Ad-IRF3-2D) or IRF3-2D-ΔNLS (Ad-IRF3-2D-ΔNLS). Scale bars, 15 μm. Cells were stained with anti-IRF3 antibody (red) and Hoechst nuclear stain (blue), and images were overlaid (right). (B) Quantification of anti-IRF3 antibody and Hoechst stain [inset in (A)] along the line scan (dashed line) at the level of each binucleated hepatocyte. The x axis shows relative distance along the line scan, and the y axis shows arbitrary fluorescence units. Each nucleus along the line scan is labeled on the x axis. (C) Immunoblot showing pAKT (Ser473), total AKT, pAMPKα (Thr172), total AMPKα, and ISG15 in WT primary hepatocytes transduced ex vivo with Ad-GFP, Ad-IRF3-2D, or Ad-IRF3-2D-ΔNLS. (D) Glucose production in Ad-GFP–, Ad-IRF3-2D–, and Ad-IRF3-2D-ΔNLS–transduced hepatocytes treated with AICAR for 6 hours in glucose production media (n = 4). (E) Experimental strategy to identify to complete IRF3 transcriptome and cistrome in hepatocytes. Hepatocytes from 6-week-old male IRF3LSL-2D mice were isolated and transduced ex vivo with Ad-Cre to activate the IRF3-2D allele or Ad-mCherry as a control. (F) Volcano plot of RNA-seq expression data from Ad-Cre– and Ad-mCherry–transduced hepatocytes. Statistically significant [false discovery rate (FDR) < 0.05] differentially expressed genes are shown in red. Several highly differentially expressed ISGs and Irf3 are shown in blue. (G) Kyoto Encyclopedia of Genes and Genomes pathway analysis of RNA-seq data from Ad-Cre– and Ad-mCherry–transduced hepatocytes. Percentage represents percent of affected genes within that pathway. (H) Volcano plot of IRF3 CUT&RUN peaks from Ad-Cre– and Ad-mCherry–transduced hepatocytes. Statistically significant (FDR < 0.05) differentially expressed genes are shown in red. Fold change is represented as Ad-Cre/Ad-mCherry. (I) IRF3 CUT&RUN profiles near the transcription start sites (pink) of several ISGs. Each track displays a different sample (n = 2 for Ad-Cre and n = 2 for Ad-mCherry). The x axis represents the genomic distance, and the y axis represents the relative alignment units. (J) The top motif found by de novo motif discovery analysis of IRF3 CUT&RUN up-regulated peaks (bottom) and the known IRF3 binding sequence (top). Motifs are shown as position weight matrices. E value is shown as reported by MEME. (K) Scatterplot of all transcription factor–matched motifs within the IRF3 CUT&RUN up-regulated peaks. The x axis indicates motif enrichment, and the y axis indicates motif abundance. Top 10 transcription factor–matched motifs within the IRF3 CUT&RUN up-regulated peaks are annotated. (L) Scatterplot of peak-gene associations between IRF3 motif–containing up-regulated CUT&RUN peaks and potentially nearby regulated genes. The x axis indicates fold change in IRF3 CUT&RUN peak expression, and the y axis indicates the FDR of RNA-seq differential gene expression analysis (Ad-Cre/Ad-mCherry). Peak-gene associations with the highest fold change in peak expression (log2FC > 5) and most significant change in gene expression (−log10FDR > 200) are in the green region. Ppp2r1b is annotated in red. Data are presented as means ± SD; **P < 0.01.
Fig. 5.
Fig. 5.. PPP2R1B is a transcriptional target of IRF3 and associates with dysglycemia.
Hepatocytes from 6-week-old male IRF3LSL-2D mice were isolated, transduced ex vivo with Ad-Cre to activate IRF3-2D or Ad-mCherry as a control, and then subjected to IRF3 CUT&RUN. (A) IRF3 CUT&RUN peaks near Ppp2r1b. Each track displays a different sample (n = 2 for Ad-Cre and Ad-mCherry). The x axis represents the genomic distance, and the y axis represents the relative alignment units. The inset shows a zoomed-in view of each track, centered on the intronic Ppp2r1b peaks. (B) Expression of Ppp2r1b and Ppp2r1a in IRF3LSL-2D hepatocytes transduced ex vivo with Ad-Cre or Ad-mCherry (n = 4). (C) Immunoblot showing PPP2R1B in IRF3LSL-2D hepatocytes transduced ex vivo with Ad-Cre or Ad-mCherry (n = 4). (D) Expression of Ppp2r1b and Ppp2r1a in WT hepatocytes transduced ex vivo with adenovirus expressing GFP (Ad-GFP), IRF3-2D (Ad-IRF3-2D), or IRF3-2D-ΔNLS (Ad-IRF3-2D-ΔNLS) (n = 4). (E) PP2A phosphatase activity in IRF3LSL-2D hepatocytes transduced ex vivo with Ad-Cre or Ad-mCherry (n = 4). (F) PP2A phosphatase activity in LI3KO and Irf3flox hepatocytes (n = 6). (G) Expression of Ppp2r1b and Ppp2r1a in liver tissue from male mice fed HFD for 18 weeks (n = 8). (H) Expression of hepatocyte Ppp2r1b and Ppp2r1a in TRAP liver tissue mRNA from male NuTRAPalb mice fed SCD or HFD for 18 weeks (n = 4). (I) Expression of PPP2R1B and PPP2R1A in liver tissue from obese humans with fatty liver disease, with normal (NFG) or impaired (IFG) fasting glucose (n = 14 to 23). (J) Association between HgbA1C and hepatic PPP2R1B or PPP2R1A expression in obese humans with fatty liver disease (n = 36 to 37). (K) Liver microarray data from a cohort of patients with NAFLD and diabetes (n = 16) who underwent weight loss surgery and had a liver biopsy taken at the time of surgery and then taken again 5 to 9 months later. Relative expression of hepatic PPP2R1B before (prebariatric) and after (postbariatric) weight loss surgery. Data are presented as means ± SD; *P < 0.05, **P < 0.01. ns, not significant.
Fig. 6.
Fig. 6.. The metabolic actions of hepatocyte IRF3 are mediated by PPP2R1B.
(A) Immunoblot showing pAKT (Ser473), total AKT, pAMPKα (Thr172), and total AMPKα in IRF3LSL-2D hepatocytes transduced ex vivo with Ad-Cre or Ad-mCherry and treated with scramble siRNA (siScramble) or siRNA targeting Ppp2r1b (siPpp2r1b). (B) Glucose production in IRF3LSL-2D hepatocytes transduced ex vivo with Ad-Cre or Ad-mCherry and treated with siScramble or siPpp2r1b for 24 hours, followed by AICAR stimulation for 6 hours in glucose production media (n = 4). (C) Immunoblot showing pAMPKα (Thr172), total AMPKα, and PPP2R1B in LI3KO hepatocytes transfected with a plasmid expressing Ppp2r1b (pTBG-Ppp2r1b) or GFP (pTBG-GFP) under the control of thyroxine-binding globulin (TBG) promoter. (D) Glucose production in LI3KO hepatocytes transfected with pTBG-Ppp2r1b or pTBG-GFP for 24 hours (n = 4). (E to H) Six-week-old male LI3KO mice were placed on HFD for 12 weeks and then tail vein–injected with AAV8 expressing Ppp2r1b (AAV8-TBG-Ppp2r1b) or GFP (AAV8-TBG-GFP) under the control of the TBG promoter while remaining on HFD. (E) Glucose (1.25 g/kg) and (F) insulin (1.25 U/kg) tolerance tests performed on LI3KO mice injected with AAV8-TBG-Ppp2r1b or AAV8-TBG-GFP after 14 and 15 weeks on HFD, respectively (n = 6). (G) Immunoblot showing insulin-stimulated pAKT (Ser473) and total AKT in liver tissue from LI3KO mice fed HFD for 16 weeks and injected with AAV8-TBG-Ppp2r1b or AAV8-TBG-GFP 4 weeks prior. Mice were fasted for 5 hours, injected intraperitoneally with insulin (5 U/kg), and then euthanized 5 min later. Liver tissue was harvested and frozen within 90 s. (H) Immunoblot showing pAMPKα (Thr172) and total AMPKα in liver tissue from LI3KO mice fed HFD for 16 weeks and injected with AAV8-TBG-Ppp2r1b or AAV8-TBG-GFP 4 weeks prior. Mice were fasted for 5 hours before euthanasia. Data are presented as means ± SD; *P < 0.05, **P < 0.01.
Fig. 7.
Fig. 7.. Acute inhibition of IRF3 reverses obesity-induced glucose dysregulation.
(A) Experimental strategy for antisense oligonucleotide (ASO) therapy. Six-week-old male WT mice were fed HFD for 10 weeks and then randomized to receive four weekly intraperitoneal injections of ASOs targeting IRF3 (IRF3 ASO) or scramble ASO (Cont ASO). Mice were evaluated after a total of 14 weeks of HFD. (B) Expression of Irf3 in liver tissue from Cont ASO– and IRF3 ASO–treated mice (n = 5). (C) Immunoblot showing IRF3 in liver tissue from Cont ASO– and IRF3 ASO–treated mice. (D) Immunoblot showing IRF3 in hepatocytes and liver NPCs isolated from Cont ASO– and IRF3 ASO–treated mice. (E) Expression of Isg15, Rsad2, Ppp2r1a, and Ppp2r1b in liver tissue from HFD-fed mice treated with Cont ASO or IRF3 ASO (n = 4). (F) Glucose (1 g/kg), (G) insulin (1.75 U/kg), and (H) pyruvate (1.25 g/kg) tolerance tests after 14, 15, and 16 weeks on HFD in Cont ASO– or IRF3 ASO–treated mice, respectively (n = 5 to 6). (I) H&E staining of liver tissue from HFD-fed mice treated with Cont ASO or IRF3 ASO. Scale bars, 100 μm. (J) Liver TAG measurement and (K) serum transaminase in HFD-fed mice treated with Cont ASO or IRF3 ASO (n = 6). Data are presented as means ± SD; *P < 0.05, **P < 0.01, and ***P < 0.001.

Comment in

  • Hepatic IRF3 in glucose intolerance.
    Kotsiliti E. Kotsiliti E. Nat Rev Gastroenterol Hepatol. 2022 Jun;19(6):349. doi: 10.1038/s41575-022-00618-6. Nat Rev Gastroenterol Hepatol. 2022. PMID: 35444297 No abstract available.

References

    1. Han HS, Kang G, Kim JS, Choi BH, Koo SH, Regulation of glucose metabolism from a liver-centric perspective. Exp. Mol. Med 48, e218(2016). - PMC - PubMed
    1. Petersen MC, Vatner DF, Shulman GI, Regulation of hepatic glucose metabolism in health and disease. Nat. Rev. Endocrinol 13, 572–587 (2017). - PMC - PubMed
    1. Okin D, Medzhitov R, The effect of sustained inflammation on hepatic mevalonate pathway results in hyperglycemia. Cell 165, 343–356 (2016). - PMC - PubMed
    1. Arkan MC, Hevener AL, Greten FR, Maeda S, Li ZW, Long JM, Wynshaw-Boris A, Poli G, Olefsky J, Karin M, IKK-β links inflammation to obesity-induced insulin resistance. Nat. Med 11, 191–198 (2005). - PubMed
    1. Chiang SH, Bazuine M, Lumeng CN, Geletka LM, Mowers J, White NM, Ma JT, Zhou J, Qi N, Westcott D, Delproposto JB, Blackwell TS, Yull FE, Saltiel AR, The protein kinase IKKɛ regulates energy balance in obese mice. Cell 138, 961–975 (2009). - PMC - PubMed

Publication types

MeSH terms

Substances