. 2022 Mar 23;14(637):eabl7634.
doi: 10.1126/scitranslmed.abl7634. Epub 2022 Mar 23.

The niacin receptor HCAR2 modulates microglial response and limits disease progression in a mouse model of Alzheimer's disease

Affiliations

The niacin receptor HCAR2 modulates microglial response and limits disease progression in a mouse model of Alzheimer's disease

Miguel Moutinho et al. Sci Transl Med. .

Abstract

Increased dietary intake of niacin has been correlated with reduced risk of Alzheimer's disease (AD). Niacin serves as a high-affinity ligand for the receptor HCAR2 (GPR109A). In the brain, HCAR2 is expressed selectively by microglia and is robustly induced by amyloid pathology in AD. The genetic inactivation of Hcar2 in 5xFAD mice, a model of AD, results in impairment of the microglial response to amyloid deposition, including deficits in gene expression, proliferation, envelopment of amyloid plaques, and uptake of amyloid-β (Aβ), ultimately leading to exacerbation of amyloid burden, neuronal loss, and cognitive deficits. In contrast, activation of HCAR2 with an FDA-approved formulation of niacin (Niaspan) in 5xFAD mice leads to reduced plaque burden and neuronal dystrophy, attenuation of neuronal loss, and rescue of working memory deficits. These data provide direct evidence that HCAR2 is required for an efficient and neuroprotective response of microglia to amyloid pathology. Administration of Niaspan potentiates the HCAR2-mediated microglial protective response and consequently attenuates amyloid-induced pathology, suggesting that its use may be a promising therapeutic approach to AD that specifically targets the neuroimmune response.


Conflict of interest statement

Competing interests: The authors declare that they have no competing interests.

Figures

Fig. 1.
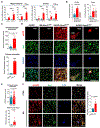
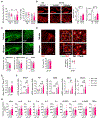
Fig. 1.. Induction of HCAR2 by microglia in AD.
(A) qPCR analysis of Hcar2 expression in the hippocampus and cortex of 4- and 6-month-old male (♂) and female (♀) nontransgenic control (B6) and 5xFAD animals (n♂ = 3 to 8; n♀ = 5 to 12 per group). Statistical analysis was performed by two-way ANOVA (Pint < 0.001) followed by Tukey’s post hoc test. (B) qPCR analysis of Hcar2 expression in the cortex of 4-month-old 5xFAD mice treated with the CSFR1 antagonist PLX5622 (PLX) for 28 days (n = 4 to 9 per group) (left) and discontinued from PLX for 28 more days (On-Off; n = 6 per group) (right). Statistical analysis was performed by one-way ANOVA (P < 0.001) followed by Tukey’s post hoc test (left) and Kruskal-Wallis test (P < 0.01) followed by Dunn’s test (right). (C) Hcar2 expression data obtained from a dataset of sorted microglia from the brains of 5-month-old B6 and 5xFAD mice (n = 5 per genotype) (GSE65067) (top). qPCR analysis of Hcar2 expression in murine primary microglia cultures incubated with 5 μM Aβ1-42 aggregates for 24 hours (n = 3 per group) (bottom). Statistical analysis was performed by Student’s t test. (D) Visualization of Hcar2 induction (mRFP-red) with immunohistochemistry (IHC) staining for Iba1 (green) and amyloid plaques (MOAB2-blue) in the subiculum (Sub), Hippocampus (Hipp), and Cortex (Cx) of B6 and 5xFAD;Hcar2mRFP mice. Scale bars, 100 μm. (E) HCAR2 expression obtained from a human transcriptomic dataset of dorsolateral prefrontal cortex (BA9) tissue of 157 nondemented controls and 310 patients with AD (GSE33000) (top). qPCR analysis of HCAR2 in postmortem middle frontal gyrus tissue of 7 control (CTRL) and 12 patients with AD (bottom). Statistical analysis was performed by Mann-Whitney test (bottom). (F) IHC for HCAR2 (red), Iba1 (green), and plaques (X-34-blue) in human CTRL and AD brain and quantification of HCAR2 immunoreactivity (n = 4 to 5 per group). Scale bar, 100 μm. Microarray datasets GSE65067 and GSE33000 were analyzed using the GEO2R online tool (www.ncbi.nlm.nih.gov/geo/geo2r/). Data are expressed as mean values ± SEM (*P < 0.05, **P < 0.01 and ***P < 0.001).
Fig. 2.
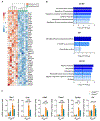
Fig. 2.. Lack of Hcar2 disrupts microglial pathways in the amyloidogenic 5xFAD brain.
(A) Gene expression heatmap of differentially expressed genes (DEGs) (adj. P < 0.05) between the hippocampus of 6-month-old female 5xFAD;Hcar2+/+ and 5xFAD;Hcar2−/− mice analyzed by the nCounter Glial Profiling Panel from NanoString (n = 5 per genotype). ClustVis software (https://biit.cs.ut.ee/clustvis/) was used to perform clustering and generate the heatmap. Clustering used Euclidean distance and average linkage. Data were subjected to centering and unit variance scaling (z scores). (B) Top 6 Gene Ontology terms for Biological Process (GO BP) (top graph), WikiPathways (WP) analysis (middle graph), and top 6 GO terms for Cellular Component (GO CC) (bottom graph), using DEGs from (A) and threshold of adj. P < 0.05 (dashed line). (C) qPCR analysis of several DEGs from (A) in hippocampus of B6 and 5xFAD Hcar2+/+, as well as B6 and 5xFAD Hcar2−/− animals (n = 4 to 6 per genotype). Statistical analysis was performed by two-way ANOVA (Pint < 0.05) followed by Tukey’s post hoc test. Data are expressed as mean values ± SEM (*P < 0.05, **P < 0.01, and ***P < 0.001).
Fig. 3.
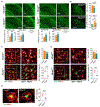
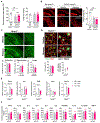
Fig. 3.. Lack of Hcar2 curtails microglia engagement with plaques and increases plaque burden.
(A) IHC staining of amyloid plaques with thioflavin S (Thio-S; green) and quantification of thioflavin S percent area and plaque number in brain tissue of 4-month-old male (♂) and female (♀) 5xFAD;Hcar2+/+ and 5xFAD;Hcar2−/− mice (n♂ = 4 to 5; n♀ = 4 per genotype). Subiculum (Sub) is magnified on the right. Statistical analysis was performed by Student’s t test. Scale bars, 500 μm. (B) IHC staining for Iba1 (green) in the subiculum of 4-month-old female 5xFAD;Hcar2+/+ and 5xFAD;Hcar2−/− mice and quantification of total Iba1 area in subiculum (left graph) (n = 4 per genotype). qPCR analysis of Aif1 expression in the hippocampus of B6 and 5xFAD Hcar2+/+ and B6 and 5xFAD Hcar2−/− mice (n = 3 to 6 per genotype). Statistical analysis was performed by Student’s t test for Iba1 area and by two way ANOVA (Pint < 0.05) followed by Tukey’s post hoc test for Aif1 expression. Scale bar, 200 μm. (C) IHC staining for Iba1 (red) and Thio-S+ amyloid plaques in the subiculum of 6-month-old female 5xFAD;Hcar2+/+ and 5xFAD;Hcar2−/− mice. Total Iba1 area in subiculum was quantified (top graph). Iba1 coverage of Thio-S+ plaques can be visualized by the color gray in the right IHC panel. Iba1 coverage of plaques were quantified and averaged per animal (bottom graph) (n = 4 to 5 mice and >200 plaques per genotype). Statistical analysis was performed by Student’s t test. Scale bars, 50 μm. (D) IHC staining for Iba1 (red) and Thio-S+ amyloid plaques in the cortex of 6-month-old female 5xFAD;Hcar2+/+ and 5xFAD;Hcar2−/− mice. Total Iba1 area in subiculum was quantified (top graph). Iba1 coverage of Thio-S+ plaques can be visualized by the color gray in the right IHC panel. Iba1 coverage of plaques were quantified and averaged per animal (bottom graph) (n = 5 to 6 mice and >100 plaques per genotype). Statistical analysis was performed by Student’s t test. Scale bars, 50 μm. (E) IHC staining of Iba1 (red) and Thio-S+ amyloid plaques in the subiculum of 6-month-old female 5xFAD;Hcar2+/+ and 5xFAD;Hcar2−/− mice. Iba1 coverage was quantified within a circular area with a radius of 25 μm centered on thioflavin S–positive plaques (n = 5 to 6 mice and >100 plaques per genotype). Statistical analysis was performed by Student’s t test. Scale bar, 50 μm. Data are expressed as mean values ± SEM (*P < 0.05, **P < 0.01, and ***P < 0.001).
Fig. 4.
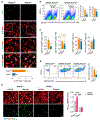
Fig. 4.. Hcar2 is required for efficient microglia proliferation and amyloid uptake.
(A) IHC for the proliferation marker Ki-67 (green), Iba1 (red), and Aβ (6E10; gray) in the cortex of 4-month-old female 5xFAD;Hcar2+/+ and 5xFAD;Hcar2−/− mice. The percent of Ki-67–positive microglia (Ki-67+/Iba1+) cells within the total microglia population (Iba1+) was determined (n = 4 per genotype). Statistical analysis was performed by Mann-Whitney test. Scale bars, 100 μm. (B to D) Brain tissue of 6-month-old female 5xFAD;Hcar2+/+ and 5xFAD;Hcar2−/− mice previously injected intraperitoneally with methoxy-X04 were analyzed by flow cytometry. Microglia cells were stained with CD11b-PeCy7- and CD45-FITC–conjugated antibodies. (B) The number and percent of CD11b-positive (CD11b+) microglia cells were determined and (C) the number and percent of CD45-intermediate (CD45int) and CD45-low (CD45low) within the CD11b+ microglia population (CD11b+/CD45int and CD11b+/CD45low). (D) The number of methoxy-X04–positive (MTX+) cells within the CD11b+ microglia population (CD11b+/MTX+) was also analyzed (n = 4 per genotype). Statistical analysis was performed by Mann-Whitney test for the number of CD11b+/CD45int. For the rest of the data, Student t test was performed. SSC-A, side scatter area. (E) Immunofluorescence of primary murine microglia from Hcar2+/+ and Hcar2−/− mice incubated with Niaspan for 24 hours followed by a 30-min incubation with aggregates of fluorescently labeled Aβ1-42 (green). Cells were stained with 4’,6-diamidino-2-phenylindole (DAPI; nuclei staining, blue) and Iba1 (red). Scale bar, 25 μm. Quantification of Aβ1-42 uptake by analyzing fluorescence per cell of at least 600 cells for each condition (n = 3 per condition). Statistical analysis was performed by two-way ANOVA (Pint < 0.05) followed by Tukey’s post hoc test. Scale bar, 25 μM. Data are expressed as mean values ± SEM (*P < 0.05, **P < 0.01, and ***P < 0.001).
Fig. 5.
Fig. 5.. Lack of Hcar2 exacerbates amyloid-associated neuropathology.
(A) Working memory of 4-month-old male (♂; green) and female (♀; yellow) B6 and 5xFAD Hcar2+/+, as well as B6 and 5xFAD Hcar2−/− mice assessed by percent of spontaneous alternation in the Y-maze task. Total arm entries were also analyzed. (n = 25 to 32 mice per genotype). Statistical analysis was performed by two-way ANOVA for spontaneous alternation (Pint = 0.1514; PHcar2genotype < 0.05; pADgenotype < 0.01) and total arm entries (Pint = 0.1027; pHcar2genotype = 0.42; pADgenotype = 0.547) followed by Tukey’s post hoc test. (B) IHC for NeuN (neurons; red) in subiculum of 4-month-old female B6 and 5xFAD Hcar2+/+ as well as B6 and 5xFAD Hcar2−/− mice. Quantification of the number of NeuN-positive cells and total area of NeuN staining within the subiculum (n = 4 to 5 per genotype). Statistical analysis was performed by two-way ANOVA (Pint < 0.05) followed by Tukey’s post hoc test. Scale bar, 100 μm. (C) IHC for ubiquitin (Ubqt), LAMP-1, and N-terminal APP (N-APP) to visualize DNs and X-34 to stain for amyloid plaques in the subiculum of 4-month-old female 5xFAD;Hcar2+/+ and 5xFAD;Hcar2−/− mice. Percent of colocalization of LAMP-1 and Ubqt with N-APP was analyzed (left graphs). Visualization of N-APP staining colocalized with DNs (LAMP-1 positive) (gray) in the right panel. The percent area of N-APP staining within LAMP-1–positive DN was quantified and averaged per animal (n = 4 mice and >200 DN per genotype). Statistical analysis was performed by Student’s t test for colocalization data and Mann-Whitney test for N-APP percent area in DN. Scale bar, 50 μm. Data are expressed as mean values ± SEM (*P < 0.05, **P < 0.01, and ***P < 0.001). WT, wild type; KO, knockout.
Fig. 6.
Fig. 6.. Niaspan stimulates microglia response and reduces amyloid pathology in AD mice
(A) Working memory of 6-month-old male B6 and 5xFAD mice treated with vehicle (Veh) or Niaspan (Nia) assessed by percent of spontaneous alternation in the Y-maze task. Total arms entries were also analyzed (n = 8 to 14 mice per group). Statistical analysis was performed by two-way ANOVA for spontaneous alternation (Pint < 0.01) and total arm entries (Pint = 0.491; Ptreatment = 0.123; Pgenotype = 0.084) followed by Tukey’s post hoc test. (B) IHC for NeuN (neurons; red) in hippocampus of 6-month-old male B6 and 5xFAD mice treated with vehicle or Niaspan with magnification of subiculum area (bottom). Quantification of total area of NeuN staining and number of NeuN-positive cells and within the subiculum (n = 5 to 6 per group). Scale bars, 250 μm. (C) IHC staining of amyloid plaques with thioflavin S and quantification of thioflavin S percent and plaque number in the subiculum, hippocampus, and cortex of 6-month-old male 5xFAD mice treated with vehicle or Niaspan. Subiculum (Sub) is magnified on the right (n = 5 to 6 per group). Statistical analysis was performed by one-way ANOVA (P < 0.001) followed by Tukey’s post hoc test. Scale bars, 500 μm. (D) IHC staining for Iba1 (red) and amyloid plaques (thioflavin S; green) in the subiculum of 6-month-old male 5xFAD mice treated with vehicle (Veh) or Niaspan (Nia). Total Iba1 area in subiculum was quantified (left graph) (n = 5 to 6 per group). Iba1 coverage of thioflavin S–positive plaques can be visualized by the color gray in the right IHC panel. Iba1 coverage of plaques were quantified and averaged per animal (right graph) (n = 5 mice and >200 plaques per group). Scale bars, 100 μm. Statistical analysis was performed by Student’s t test. (E) Ratio of Iba1 and thioflavin S (Thio-S) areas within the subiculum of 5xFAD animals treated with vehicle (Veh) or Niaspan (Nia) (n = 5 to 6 per group). Statistical analysis was performed by Mann-Whitney test. (F) Expression analysis by qPCR of several genes implicated in HCAR2 signaling and AD pathology in the hippocampus of male B6 and 5xFAD mice treated with vehicle and Niaspan (n = 4 to 13 per group). Statistical analysis was performed by two-way ANOVA (Pint < = 0.0767; Ptreatment < 0.05 = 0.0767; Ptreatment < 0.05; Pgenotype = 0.084) followed by Tukey’s post hoc test. (G) Cytokine concentration in cortical tissue of 5xFAD mice treated with vehicle or Niaspan (n = 6 per group) quantified by the MSD V-PLEX Plus Proinflammatory Panel 1 Mouse Kit. Statistical analysis was performed by Student’s t test. Data are expressed as mean values ± SEM (*P < 0.05, **P < 0.01, and ***P < 0.001).
Fig. 7.
Fig. 7.. Niaspan treatment does not lead to salutary effects in 5xFAD lacking Hcar2.
(A) Working memory of 6-month-old male B6 and 5xFAD Hcar2−/− mice treated with vehicle (Veh) and Niaspan (Nia) assessed by percent of spontaneous alternation in the Y-maze task. Total arms entries were also analyzed (n = 7 to 9 mice per group). Statistical analysis was performed by one-way ANOVA for spontaneous alternation (P < 0.01) and total arm entries (P = 0.655) followed by Tukey’s post hoc test. (B) IHC for NeuN (neurons; red) in hippocampus of 6-month-old male B6 and 5xFAD Hcar2−/− mice treated with vehicle or Niaspan with magnification of subiculum area (bottom). Quantification of total area of NeuN staining within the subiculum (n = 4 per group). Statistical analysis was performed by one-way ANOVA (P < 0.001) followed by Tukey’s post hoc test. Scale bars, 250 μm. (C) IHC staining of amyloid plaques with thioflavin S and quantification of thioflavin S percent and plaque number in the subiculum, hippocampus, and cortex of 6-month-old male 5xFAD treated with vehicle and Niaspan. Subiculum (Sub) is magnified on the right (n = 4 per group). Statistical analysis was performed by Student’s t test. Scale bars, 500 μm. (D) IHC staining for Iba1 (red) and amyloid plaques (thioflavin S; green) in the subiculum of 6-month-old male 5xFAD;Hcar2−/− mice treated with vehicle (Veh) and Niaspan (Nia). Total Iba1 area in subiculum was quantified (left graph) (n = 4 per group). Iba1 covarage of thioflavin S–positive plaques can be visualized by the color gray in the right IHC panel. Iba1 coverage of plaques were quantified and averaged per animal (right graph) (n = 4 mice and >200 plaques per group). Scale bars, 100 μm. Statistical analysis was performed by Student’s t test. (E) Expression analysis by qPCR of several genes implicated in HCAR2 signaling and AD pathology in the hippocampus of male B6 and 5xFAD Hcar2−/− mice treated with vehicle and Niaspan (n = 4 to 5 per group). Statistical analysis was performed by one-way ANOVA (P < 0.05 for Trem2, Cd68, and Clec7a; P = 0.1851 for Axl; P = 0.2377 for Mrc1) followed by Tukey’s post hoc test. (F) Cytokine concentration in cortical tissue of 5xFAD;Hcar2−/− mice treated with vehicle or Niaspan (n = 6 per group) quantified by the MSD V-PLEX Plus Proinflammatory Panel 1 Mouse Kit. Statistical analysis was performed by Student’s t test. Data are expressed as mean values ± SEM (*P < 0.05, **P < 0.01, and ***P < 0.001).

References

    1. Selkoe DJ, Hardy J, The amyloid hypothesis of Alzheimer’s disease at 25 years. EMBO Mol. Med 8, 595–608 (2016). - PMC - PubMed
    1. Hansen DV, Hanson JE, Sheng M, Microglia in Alzheimer’s disease. J. Cell Biol 217, 459–472 (2018). - PMC - PubMed
    1. Karch CM, Goate AM, Alzheimer’s disease risk genes and mechanisms of disease pathogenesis. Biol. Psychiatry 77, 43–51 (2015). - PMC - PubMed
    1. Sims R, van der Lee SJ, Naj AC, Bellenguez C, Badarinarayan N, Jakobsdottir J, Kunkle BW, Boland A, Raybould R, Bis JC, Martin ER, Grenier-Boley B, Heilmann-Heimbach S, Chouraki V, Kuzma AB, Sleegers K, Vronskaya M, Ruiz A, Graham RR, Olaso R, Hoffmann P, Grove ML, Vardarajan BN, Hiltunen M, Nothen MM, White CC, Hamilton-Nelson KL, Epelbaum J, Maier W, Choi SH, Beecham GW, Dulary C, Herms S, Smith AV, Funk CC, Derbois C, Forstner AJ, Ahmad S, Li H, Bacq D, Harold D, Satizabal CL, Valladares O, Squassina A, Thomas R, Brody JA, Qu L, Sanchez-Juan P, Morgan T, Wolters FJ, Zhao Y, Garcia FS, Denning N, Fornage M, Malamon J, Naranjo MCD, Majounie E, Mosley TH, Dombroski B, Wallon D, Lupton MK, Dupuis J, Whitehead P, Fratiglioni L, Medway C, Jian X, Mukherjee S, Keller L, Brown K, Lin H, Cantwell LB, Panza F, McGuinness B, Moreno-Grau S, Burgess JD, Solfrizzi V, Proitsi P, Adams HH, Allen M, Seripa D, Pastor P, Cupples LA, Price ND, Hannequin D, Frank-Garcia A, Levy D, Chakrabarty P, Caffarra P, Giegling I, Beiser AS, Giedraitis V, Hampel H, Garcia ME, Wang X, Lannfelt L, Mecocci P, Eiriksdottir G, Crane PK, Pasquier F, Boccardi V, Henandez I, Barber RC, Scherer M, Tarraga L, Adams PM, Leber M, Chen Y, Albert MS, Riedel-Heller S, Emilsson V, Beekly D, Braae A, Schmidt R, Blacker D, Masullo C, Schmidt H, Doody RS, Spalletta G, Longstreth WT Jr., Fairchild TJ, Bossu P, Lopez OL, Frosch MP, Sacchinelli E, Ghetti B, Yang Q, Huebinger RM, Jessen F, Li S, Kamboh MI, Morris J, Sotolongo-Grau O, Katz MJ, Corcoran C, Dunstan M, Braddel A, Thomas C, Meggy A, Marshall R, Gerrish A, Chapman J, Aguilar M, Taylor S, Hill M, Fairen MD, Hodges A, Vellas B, Soininen H, Kloszewska I, Daniilidou M, Uphill J, Patel Y, Hughes JT, Lord J, Turton J, Hartmann AM, Cecchetti R, Fenoglio C, Serpente M, Arcaro M, Caltagirone C, Orfei MD, Ciaramella A, Pichler S, Mayhaus M, Gu W, Lleo A, Fortea J, Blesa R, Barber IS, Brookes K, Cupidi C, Maletta RG, Carrell D, Sorbi S, Moebus S, Urbano M, Pilotto A, Kornhuber J, Bosco P, Todd S, Craig D, Johnston J, Gill M, Lawlor B, Lynch A, Fox NC, Hardy J, Consortium A, Albin RL, Apostolova LG, Arnold SE, Asthana S, Atwood CS, Baldwin CT, Barnes LL, Barral S, Beach TG, Becker JT, Bigio EH, Bird TD, Boeve BF, Bowen JD, Boxer A, Burke JR, Burns JM, Buxbaum JD, Cairns NJ, Cao C, Carlson CS, Carlsson CM, Carney RM, Carrasquillo MM, Carroll SL, Diaz CC, Chui HC, Clark DG, Cribbs DH, Crocco EA, DeCarli C, Dick M, Duara R, Evans DA, Faber KM, Fallon KB, Fardo DW, Farlow MR, Ferris S, Foroud TM, Galasko DR, Gearing M, Geschwind DH, Gilbert JR, Graff-Radford NR, Green RC, Growdon JH, Hamilton RL, Harrell LE, Honig LS, Huentelman MJ, Hulette CM, Hyman BT, Jarvik GP, Abner E, Jin LW, Jun G, Karydas A, Kaye JA, Kim R, Kowall NW, Kramer JH, LaFerla FM, Lah JJ, Leverenz JB, Levey AI, Li G, Lieberman AP, Lunetta KL, Lyketsos CG, Marson DC, Martiniuk F, Mash DC, Masliah E, McCormick WC, McCurry SM, McDavid AN, McKee AC, Mesulam M, Miller BL, Miller CA, Miller JW, Morris JC, Murrell JR, Myers AJ, O’Bryant S, Olichney JM, Pankratz VS, Parisi JE, Paulson HL, Perry W, Peskind E, Pierce A, Poon WW, Potter H, Quinn JF, Raj A, Raskind M, Reisberg B, Reitz C, Ringman JM, Roberson ED, Rogaeva E, Rosen HJ, Rosenberg RN, Sager MA, Saykin AJ, Schneider JA, Schneider LS, Seeley WW, Smith AG, Sonnen JA, Spina S, Stern RA, Swerdlow RH, Tanzi RE, Thornton-Wells TA, Trojanowski JQ, Troncoso JC, Van Deerlin VM, Van Eldik LJ, Vinters HV, Vonsattel JP, Weintraub S, Welsh-Bohmer KA, Wilhelmsen KC, Williamson J, Wingo TS, Woltjer RL, Wright CB, Yu CE, Yu L, Garzia F, Golamaully F, Septier G, Engelborghs S, Vandenberghe R, De Deyn PP, Fernadez CM, Benito YA, Thonberg H, Forsell C, Lilius L, Kinhult-Stahlbom A, Kilander L, Brundin R, Concari L, Helisalmi S, Koivisto AM, Haapasalo A, Dermecourt V, Fievet N, Hanon O, Dufouil C, Brice A, Ritchie K, Dubois B, Himali JJ, Keene CD, Tschanz J, Fitzpatrick AL, Kukull WA, Norton M, Aspelund T, Larson EB, Munger R, Rotter JI, Lipton RB, Bullido MJ, Hofman A, Montine TJ, Coto E, Boerwinkle E, Petersen RC, Alvarez V, Rivadeneira F, Reiman EM, Gallo M, O’Donnell CJ, Reisch JS, Bruni AC, Royall DR, Dichgans M, Sano M, Galimberti D, George-Hyslop PS, Scarpini E, Tsuang DW, Mancuso M, Bonuccelli U, Winslow AR, Daniele A, Wu CK, GERAD/PERADES, CHARGE, ADGC, EADI, Peters O, Nacmias B, Riemenschneider M, Heun R, Brayne C, Rubinsztein DC, Bras J, Guerreiro R, Al-Chalabi A, Shaw CE, Collinge J, Mann D, Tsolaki M, Clarimon J, Sussams R, Lovestone S, O’Donovan MC, Owen MJ, Behrens TW, Mead S, Goate AM, Uitterlinden AG, Holmes C, Cruchaga C, Ingelsson M, Bennett DA, Powell J, Golde TE, Graff C, De Jager PL, Morgan K, Ertekin-Taner N, Combarros O, Psaty BM, Passmore P, Younkin SG, Berr C, Gudnason V, Rujescu D, Dickson DW, Dartigues JF, DeStefano AL, Ortega-Cubero S, Hakonarson H, Campion D, Boada M, Kauwe JK, Farrer LA, Van Broeckhoven C, Ikram MA, Jones L, Haines JL, Tzourio C, Launer LJ, Escott-Price V, Mayeux R, Deleuze JF, Amin N, Holmans PA, Pericak-Vance MA, Amouyel P, van Duijn CM, Ramirez A, Wang LS, Lambert JC, Seshadri S, Williams J, Schellenberg GD, Rare coding variants in PLCG2, ABI3, and TREM2 implicate microglial-mediated innate immunity in Alzheimer’s disease. Nat. Genet 49, 1373–1384 (2017). - PMC - PubMed
    1. Qin B, Xun P, Jacobs DR Jr, Zhu N, Daviglus ML, Reis JP, Steffen LM, Van Horn L, Sidney S, He K, Intake of niacin, folate, vitamin B-6, and vitamin B-12 through young adulthood and cognitive function in midlife: The Coronary Artery Risk Development in Young Adults (CARDIA) study. Am. J. Clin. Nutr 106, 1032–1040 (2017). - PMC - PubMed

Publication types