. 2022 Mar 23;14(637):eabc1600.
doi: 10.1126/scitranslmed.abc1600. Epub 2022 Mar 23.

Listeria delivers tetanus toxoid protein to pancreatic tumors and induces cancer cell death in mice

Affiliations

Listeria delivers tetanus toxoid protein to pancreatic tumors and induces cancer cell death in mice

Benson Chellakkan Selvanesan et al. Sci Transl Med. .

Abstract

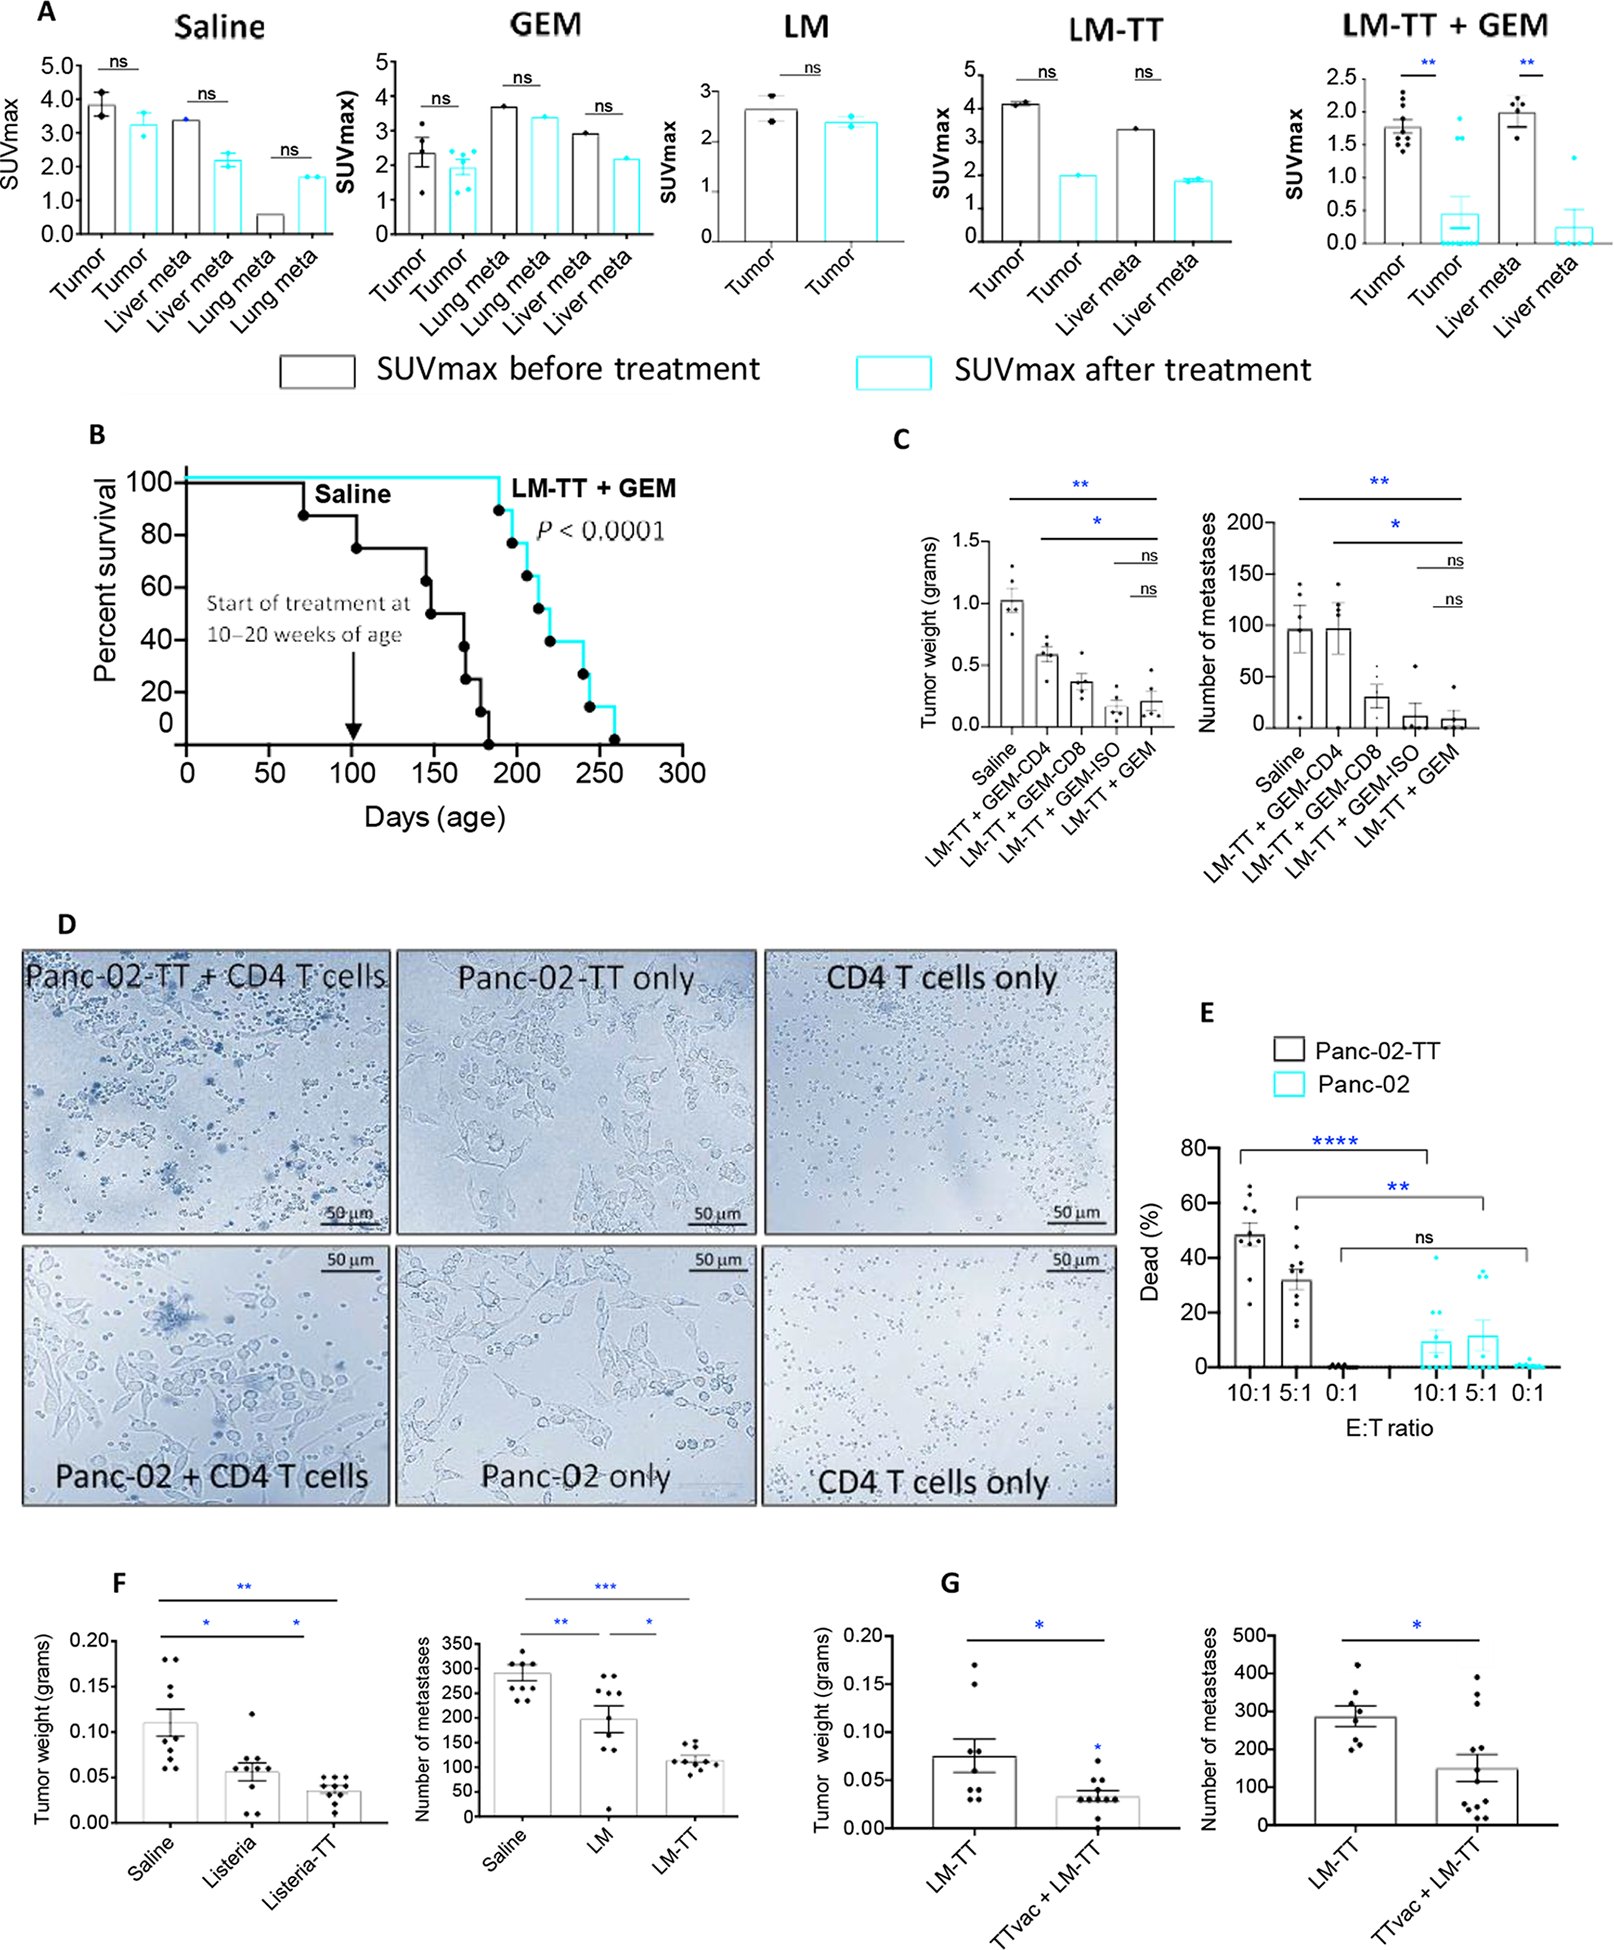
Pancreatic ductal adenocarcinoma (PDAC) is a highly metastatic disease. Tumors are poorly immunogenic and immunosuppressive, preventing T cell activation in the tumor microenvironment. Here, we present a microbial-based immunotherapeutic treatment for selective delivery of an immunogenic tetanus toxoid protein (TT856-1313) into PDAC tumor cells by attenuated Listeria monocytogenes. This treatment reactivated preexisting TT-specific memory T cells to kill infected tumor cells in mice. Treatment of KrasG12D,p53R172H, Pdx1-Cre (KPC) mice with Listeria-TT resulted in TT accumulation inside tumor cells, attraction of TT-specific memory CD4 T cells to the tumor microenvironment, and production of perforin and granzyme B in tumors. Low doses of gemcitabine (GEM) increased immune effects of Listeria-TT, turning immunologically cold into hot tumors in mice. In vivo depletion of T cells from Listeria-TT + GEM-treated mice demonstrated a CD4 T cell-mediated reduction in tumor burden. CD4 T cells from TT-vaccinated mice were able to kill TT-expressing Panc-02 tumor cells in vitro. In addition, peritumoral lymph node-like structures were observed in close contact with pancreatic tumors in KPC mice treated with Listeria-TT or Listeria-TT + GEM. These structures displayed CD4 and CD8 T cells producing perforin and granzyme B. Whereas CD4 T cells efficiently infiltrated the KPC tumors, CD8 T cells did not. Listeria-TT + GEM treatment of KPC mice with advanced PDAC reduced tumor burden by 80% and metastases by 87% after treatment and increased survival by 40% compared to nontreated mice. These results suggest that Listeria-delivered recall antigens could be an alternative to neoantigen-mediated cancer immunotherapy.


Figures

Fig. 1.
Fig. 1.. Development and characterization of the Listeria-TT construct.
(A) Listeria-TT construct. TT856–1313, a nontoxic fragment of the C terminus of TT cDNA (amino acid position 856 to 1313, 52 kDa) was cloned as a fusion protein with a truncated noncytolytic listeriolysin O (LLO, 48kDa) into the Listeria plasmid pGG34, under the control of the LLO promoter (P). A myc tag was included for detection of the TT protein. (B) Western blot detection of TT protein secretion using anti-myc antibody. Complete blot shown in fig. S1A. Lane 1: Negative control (growth medium); lane 2: supernatant of Listeria-TT culture; lane 3: pellet of Listeria-TT culture. (C) Detection of TT protein in tumor cells. Lane 1: Panc-02 tumor cells; lane 2: Panc-02 tumor cells infected with Listeria alone; lane 3: Panc-02 tumor cells infected with Listeria-TT. Complete blot shown in fig. S1B. Anti–β-actin antibody was used to show equal loading of the samples. Abs, antibodies. (D) Mouse Panc-02 tumor cells infected with Listeria-TT. Average of two independent experiments, three wells per group. (E) Mouse Panc-02 tumor cell killing by Listeria alone or Listeria-TT. Average of three independent experiments; three wells per group. (F) Listeria-TT accumulation in tumors and metastases but not in normal tissues. A single high dose of Listeria-TT, 107 CFU/200 μl, was injected intraperitoneally into Panc-02 mice, and Listeria-TT CFUs were measured in tumor, metastatic, and normal tissues at different time points. Averages of a single experiment; n = 3 mice per time point, n = 3 tissues per organ/tumor/metastases. (G) Listeria accumulation in the metastases (mainly in pancreas) after 12 high doses (107 CFU). (H) Listeria or Listeria-TT infection of human Mia-PaCa2 pancreatic tumor cells in vitro. (I) Listeria or Listeria-TT killing human MiaPaCa2 pancreatic tumor cells in vitro. (J) Listeria-accumulation in human pancreatic tumors and metastases in vivo. A single high dose of Listeria-TT, 5 × 10⁷ CFU/200 μl, was injected intraperitoneally in nude mice with MiaPaCa2 tumors in the pancreas, and Listeria-TT CFUs were measured in tumor, metastatic, and normal tissues at different time points. Averages of a single experiment; n = 3 mice per time point, n = 3 tissues per organ/tumor/metastases. (K) Listeria-TT infecting tumor cells and macrophages (M) in Panc-02-dendra-2 tumors of live mice by intravital imaging. Tumor cells are green, macrophages are blue, and Listeria-TT are yellow. In (E) and (I), all groups were compared to untreated (none). ns, not significant. In D,E, and I, statistical significance was determined by Mann-Whitney. *P < 0.05, ***P < 0.001. ****P < 0.0001. GI, gastrointestinal; LN, lymph nodes, BM, bone marrow.
Fig. 2.
Fig. 2.. Delivery of TT by Listeria in pancreatic tumors in mice.
(A) IHC of KPC mouse tumors 2 days after receiving a complete treatment cycle with Listeria-TT + GEM as outlined in fig. S4 stained for TT. As negative control, the secondary antibody (anti–IgG-HRP conjugated) only was used. (B) TT expression in KPC tumors of LM-TT + GEM− or LM-TT–treated mice was quantified by IHC (averaged per square millimeter tumor area of 10 fields) with n = 3 KPC mice per group. Mann-Whitney, ****P < 0.001. Error bars represent SEM. All groups were compared to LM-TT + GEM. (C) TT expression and CD4 T cells were analyzed in KPC tumors by IHC of Listeria-TT + GEM–treated and control mice (saline, GEM, and LM-TT). Arrows point to TT and CD4 T cells around the neoplastic pancreatic ducts. (D) Effect of GEM on Listeria in vitro. Average of one experiment; n = 3 wells per concentration, three fields per well. (E) Effect of GEM on Listeria in vivo. The CFU of Listeria was counted 1 day after the treatment. Average of two independent experiments; n = 3 mice per group. Mann-Whitney; *P < 0.05, ***P < 0.001, and ****P < 0.0001. LM-TT, Listeria-TT; GEM, gemcitabine. In (D), all groups were compared to untreated Listeria (none).
Fig. 3.
Fig. 3.. Generation and recall of memory CD4 and CD8 T cell responses to TT.
(A) Generation of CD4 (left) and CD8 (right) memory T cells to TT by immunization of mice with tetanus vaccine (TTvac) before tumor development as represented by IFNy-producing cells. All groups were compared to TTvacc. (B) Reactivation of TT-specific memory CD4 (left) and CD8 (right) T cells in KPC mice after tumor development through the Listeria-TT + GEM treatment cycle. The y axis represents the number of spleen cells producing IFNγ, and the x axis shows the spleen cell populations depleted or not depleted for CD4 or CD8 T cells. All groups were compared to nondepleted groups. (C) C57BL/6 mice with Panc-02 tumors received one high and multiple low doses of Listeria alone as described in fig. S4. Spleen cells were isolated and analyzed for T cell responses to Survivin protein by ELISPOT. A similar experiment was performed in KPC mice with pancreatic tumors but now received Listeria-TT + GEM. Representative results of two experiments are shown; n = 3 mice per group (pooled), six wells per group. Statistical significance by Mann-Whitney test: **P < 0.01, and ****P < 0.0001. All groups were compared to nondepleted groups. (D) ELISPOT analysis of CD45+ IFNγ-producing immune cells isolated from orthotopic Panc-02 tumors in mice treated with Listeria-TT + GEM. (E) Flow cytometry of IFNγ-producing CD4+ T cells in the CD45+ fraction, isolated from orthotopic Panc-02 tumors. In each group, tumors of five mice were pooled. Mann-Whitney; **P < 0.01, ***P < 0.001, and ****P < 0.0001. The error bars represent SEM.
Fig. 4.
Fig. 4.. CD4 memory T cells migrate to TME and are activated by Listeria-TT + GEM.
KPC mice were treated with saline, GEM, Listeria-TT, or Listeria-TT + GEM as outlined in fig. S4. Three days after the last treatment, the pancreas with tumors including lymph node–like structures (LNS) were excised and processed for TT, CD4, perforin, and granzyme B staining by IHC. (A) Quantification of CD4 T cells in KPC tumors and the production of perforin and granzyme B in the KPC tumors and LNS. CD4 T cell numbers were counted in the tumor areas of all treatment groups. Also, the number of perforin and granzyme B–producing cells was counted in the tumor areas and LNS of all treatment groups. In each group, 4 to 10 fields were measured, and the number of cells per 1 mm2 was calculated. All groups were compared to the saline group. Results of three mice per group were averaged. Mann-Whitney; *P < 0.05, **P < 0.01, and ***P < 0.001. (B) Production of perforin and granzyme B in KPC tumors by IHC. (C) Representative IHC of CD4 T cells in the KPC tumors and the presence of LNS were analyzed in all treatment groups. (D) Production of perforin and granzyme B in KPC LNS, by IHC.
Fig. 5.
Fig. 5.. Listeria-TT + GEM activates immune responses in primary tumors and LNS.
(A) Isolation and flow cytometry analysis of CD4 and CD8 T cells in a LNS of a mouse that received Listeria-TT. The CD45+ cells were gated, followed by CD3CD4 or CD3CD8 gating, followed by gating of CD3CD4 and CD3CD8 T cells producing intracellular IFNγ, followed by staining to identify T cells with memory phenotype (CD44+CD62L). (B) RNA-seq analysis of immune responses and tumor cell death pathways in pancreatic tumors of KPC mice in response to Listeria-TT + GEM treatment and control groups. The results of two mice in each group were averaged. The heatmap was generated by unbiased hieratical clustering at the following statistical parameters. Statistical parameters for the paired-wise comparison: P < 0.05. The signature contains 20 genes. (C) Flow cytometric analysis of changes in MDSC (CD11b+Gr1+) in blood and tumors and TAMs (CD11b+F4/80+) in tumors of Panc-02 mice in response to the Listeria-TT + GEM treatment. All groups were compared to the saline group. The gating strategy of MDSCs and TAMs is shown in fig. S13 (A and B). Average of a single experiment of MDSCs in blood with n = 3 mice per group and the average of two independent experiments of MDSCs and TAMs in tumors with n = 3 mice per group. The error bars represent SEM. Mann-Whitney *P < 0.05, ***P < 0.001, ****P < 0.0001.
Fig. 6.
Fig. 6.. Listeria-TT + GEM reduces advanced pancreatic cancer in KPC mice.
KPC mice received the combined treatment as outlined in fig. S4. (A) Effect of treatment on advanced pancreatic cancer in KPC mice. Averages are shown for a single experiment with five mice in the Listeria-TT + GEM group and two mice in each other treatment group. Listeria-TT + GEM was started at age 3 to 5.5 months, after tumors and metastases were verified through PET scan. SUVmax of tumors and metastases was measured before (black bar) and after treatment (cyan blue bar). (B) KPC mice of 10 to 20 weeks of age were treated with Listeria-TT + GEM or saline as described in fig. S4, with two high doses of Listeria-TT, 1 week apart. At the end of treatments, mice were monitored until death, and survival was assessed, when defined clinical end points were reached. This was one experiment with eight mice per group. Significant differences were determined by the Mantel-Cox test P < 0.0001. (C) Mice with Panc-02 tumors and metastases were treated with anti-CD4 and anti-CD8 antibodies during Listeria-TT +GEM treatment. The antibodies (300 μg/200 μl) were administered intraperitoneally every third day (five doses total). Appropriate isotype antibodies were used as negative control. At the conclusion of the experiment, the tumor weight and number of metastases were determined. n = 7 mice per group. Mann-Whitney; *P < 0.05 and **P < 0.01. All mice were compared to the LM-TT + GEM group. (D) Example of CD4 T cells of TT-vaccinated mice destroying TT-expressing Panc-02 tumor cells in vitro. Effector (CD4 T cells) and target (tumor cells) were mixed at ratios 10:1, 5:1, and 0:1 and cultured for 3 hours. Percentage of dead TT-expressing was compared to non–TT-expressing tumor cells by trypan blue. Percentage of dead TT- and non–TT-expressing tumor cells in the presence and absence of TT-specific memory T cells was compared. (E) Results were quantified and analyzed by Mann-Whitney test. **P < 0.01 and ****P < 0.0001. Each dot represents the percentage of dead tumor cells per field. Ten fields spread over 10 wells per group were analyzed, and the results were averaged within each group. (F) Panc-02 mice with advanced pancreatic cancer received the Listeria-TT ± TTvac as outlined in fig. S4, and tumor weight and number of metastases were measured. (G) Panc-02 mice received Listeria-TT with and without prior TTvacc; at end point, tumors were weighted and the number of metastases was counted. The results of two experiments were averaged with n = 8 to 9 mice per group and analyzed by Mann-Whitney test; *P < 0.05, **P < 0.01, and ***P < 0.001. Error bars represent SEM.

Comment in

  • Bacteria deliver the goods.
    Villanueva MT. Villanueva MT. Nat Rev Drug Discov. 2022 May;21(5):336. doi: 10.1038/d41573-022-00065-7. Nat Rev Drug Discov. 2022. PMID: 35393548 No abstract available.

References

    1. Kulke MH, Blaszkowsky LS, Ryan DP, Clark JW, Meyerhardt JA, Zhu AX, Enzinger PC, Kwak EL, Muzikansky A, Lawrence C, Fuchs CS, Capecitabine plus erlotinib in gemcitabine-refractory advanced pancreatic cancer. J. Clin. Oncol 25, 4787–4792 (2007). - PubMed
    1. Maitra A, Hruban RH, Pancreatic cancer. Annu. Rev. Pathol 3, 157–188 (2008). - PMC - PubMed
    1. Moore MJ, Goldstein D, Hamm J, Figer A, Hecht JR, Gallinger S, Au HJ, Murawa P, Walde D, Wolff RA, Campos D, Lim R, Ding K, Clark G, Voskoglou-Nomikos T, Ptasynski M, Parulekar W; National Cancer Institute of Canada Clinical Trials Group, Erlotinib plus gemcitabine compared with gemcitabine alone in patients with advanced pancreatic cancer: A Phase III trial of the National Cancer Institute of Canada clinical trials group. J. Clin. Oncol 25, 1960–1966 (2007). - PubMed
    1. Abbruzzese JL, Grunewald R, Weeks EA, Gravel D, Adams T, Nowak B, Mineishi S, Tarassoff P, Satterlee W, Raber MN, A phase I clinical, plasma, and cellular pharmacology study of gemcitabine. J. Clin. Oncol 9, 491–498 (1991). - PubMed
    1. Von Hoff DD, Ramanathan RK, Borad MJ, Laheru DA, Smith LS, Wood TE, Korn RL, Desai N, Trieu V, Iglesias JL, Zhang H, Soon-Shiong P, Shi T, Rajeshkumar NV, Maitra A, Hidalgo M, Gemcitabine plus nab-paclitaxel is an active regimen in patients with advanced pancreatic cancer: A phase I/II trial. J. Clin. Oncol 29, 4548–4554 (2011). - PMC - PubMed

Publication types