. 2022 Apr 1;127(4):1054-1066.
doi: 10.1152/jn.00017.2022. Epub 2022 Mar 23.

Bursting emerges from the complementary roles of neurons in a four-cell network

Affiliations

Bursting emerges from the complementary roles of neurons in a four-cell network

Akira Sakurai et al. J Neurophysiol. .

Abstract

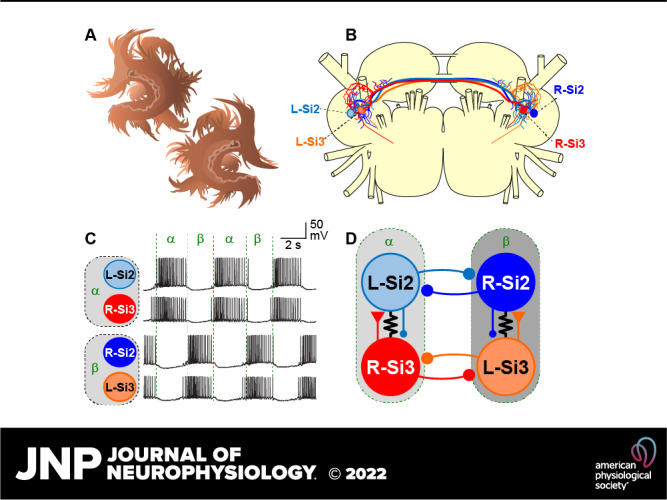
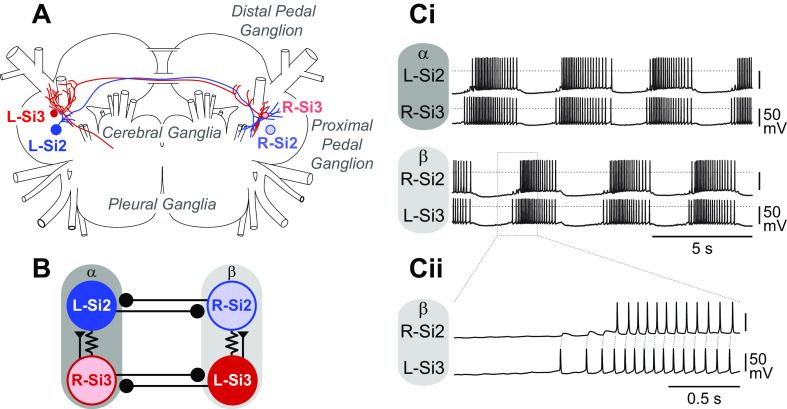
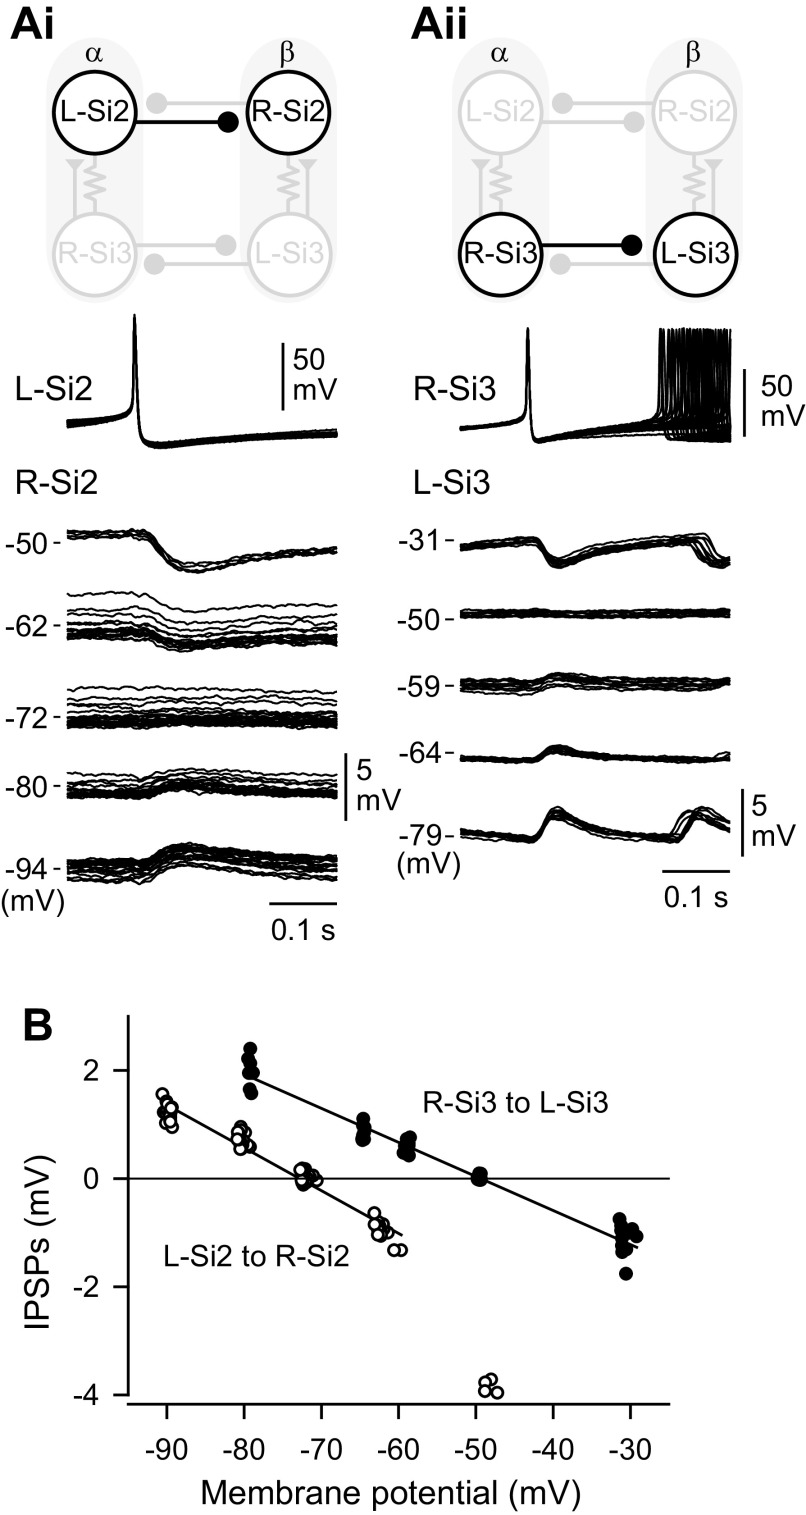
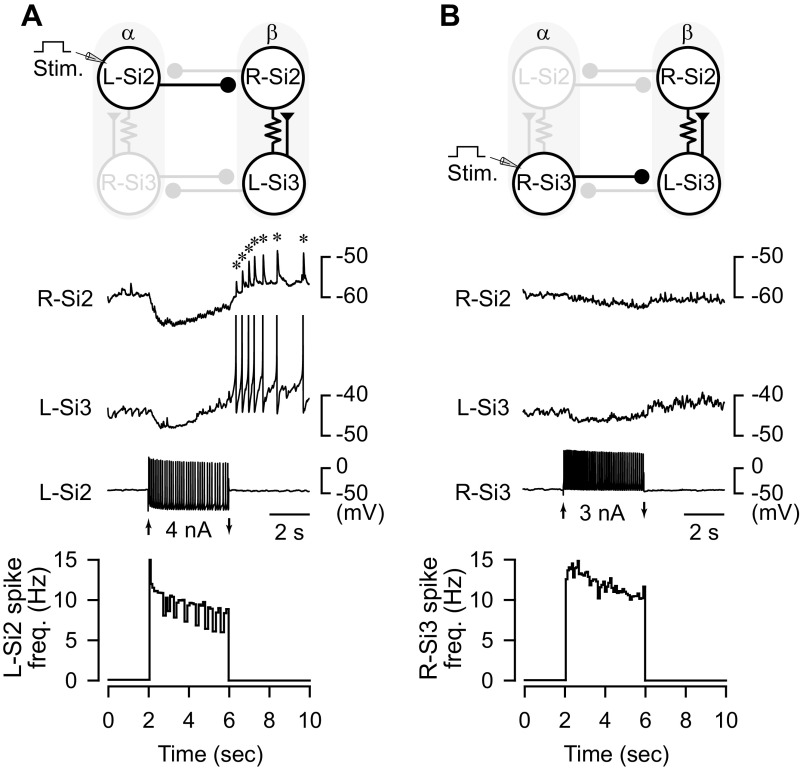
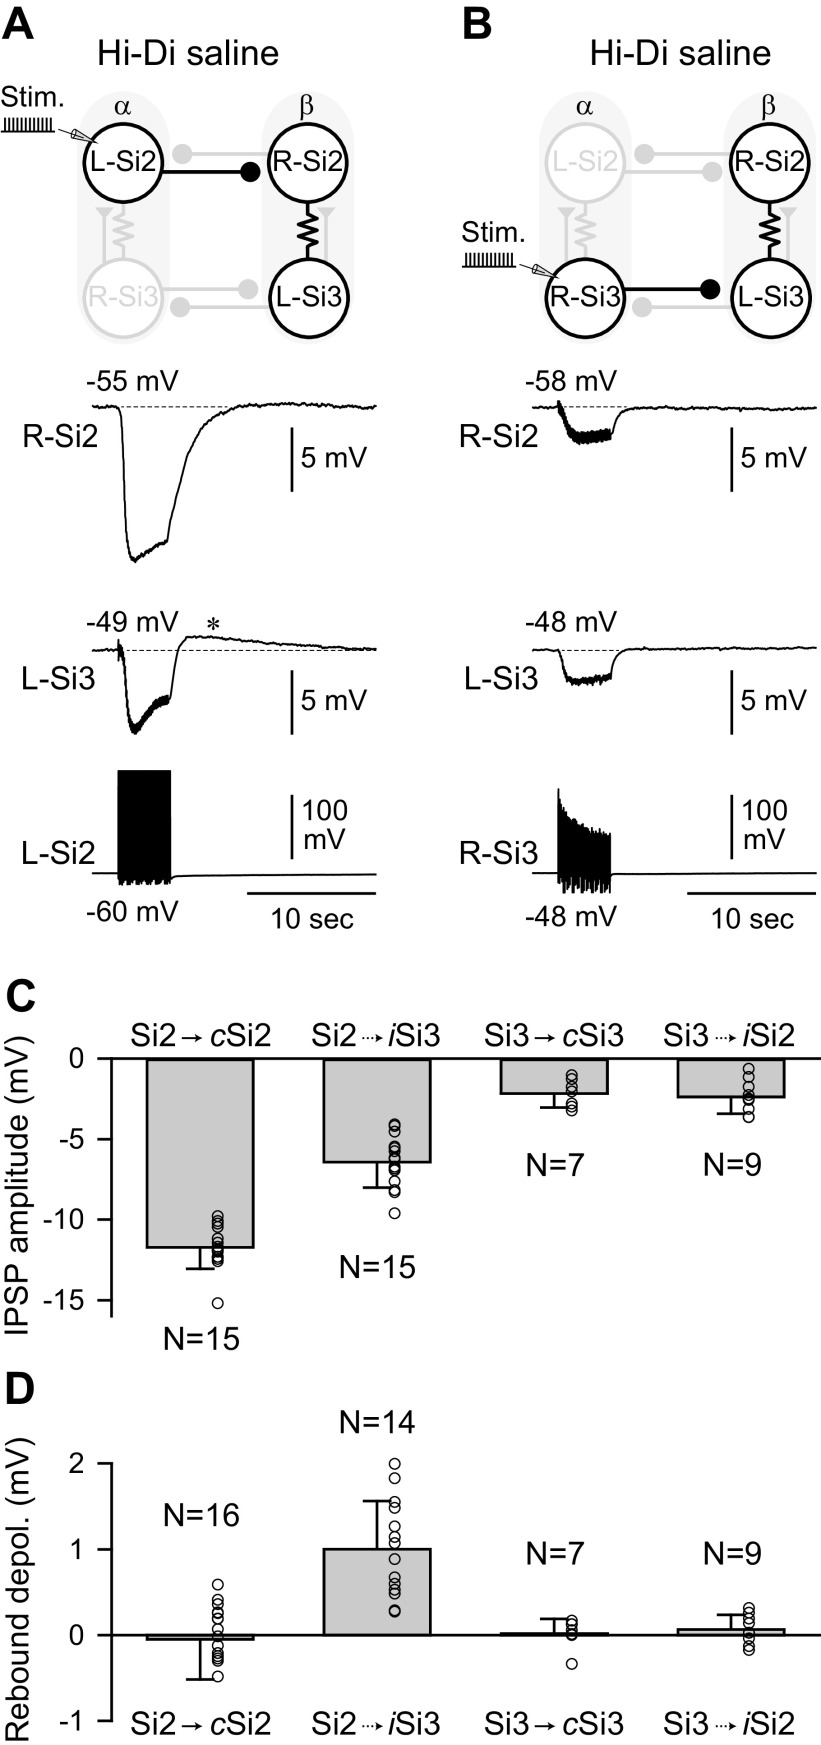
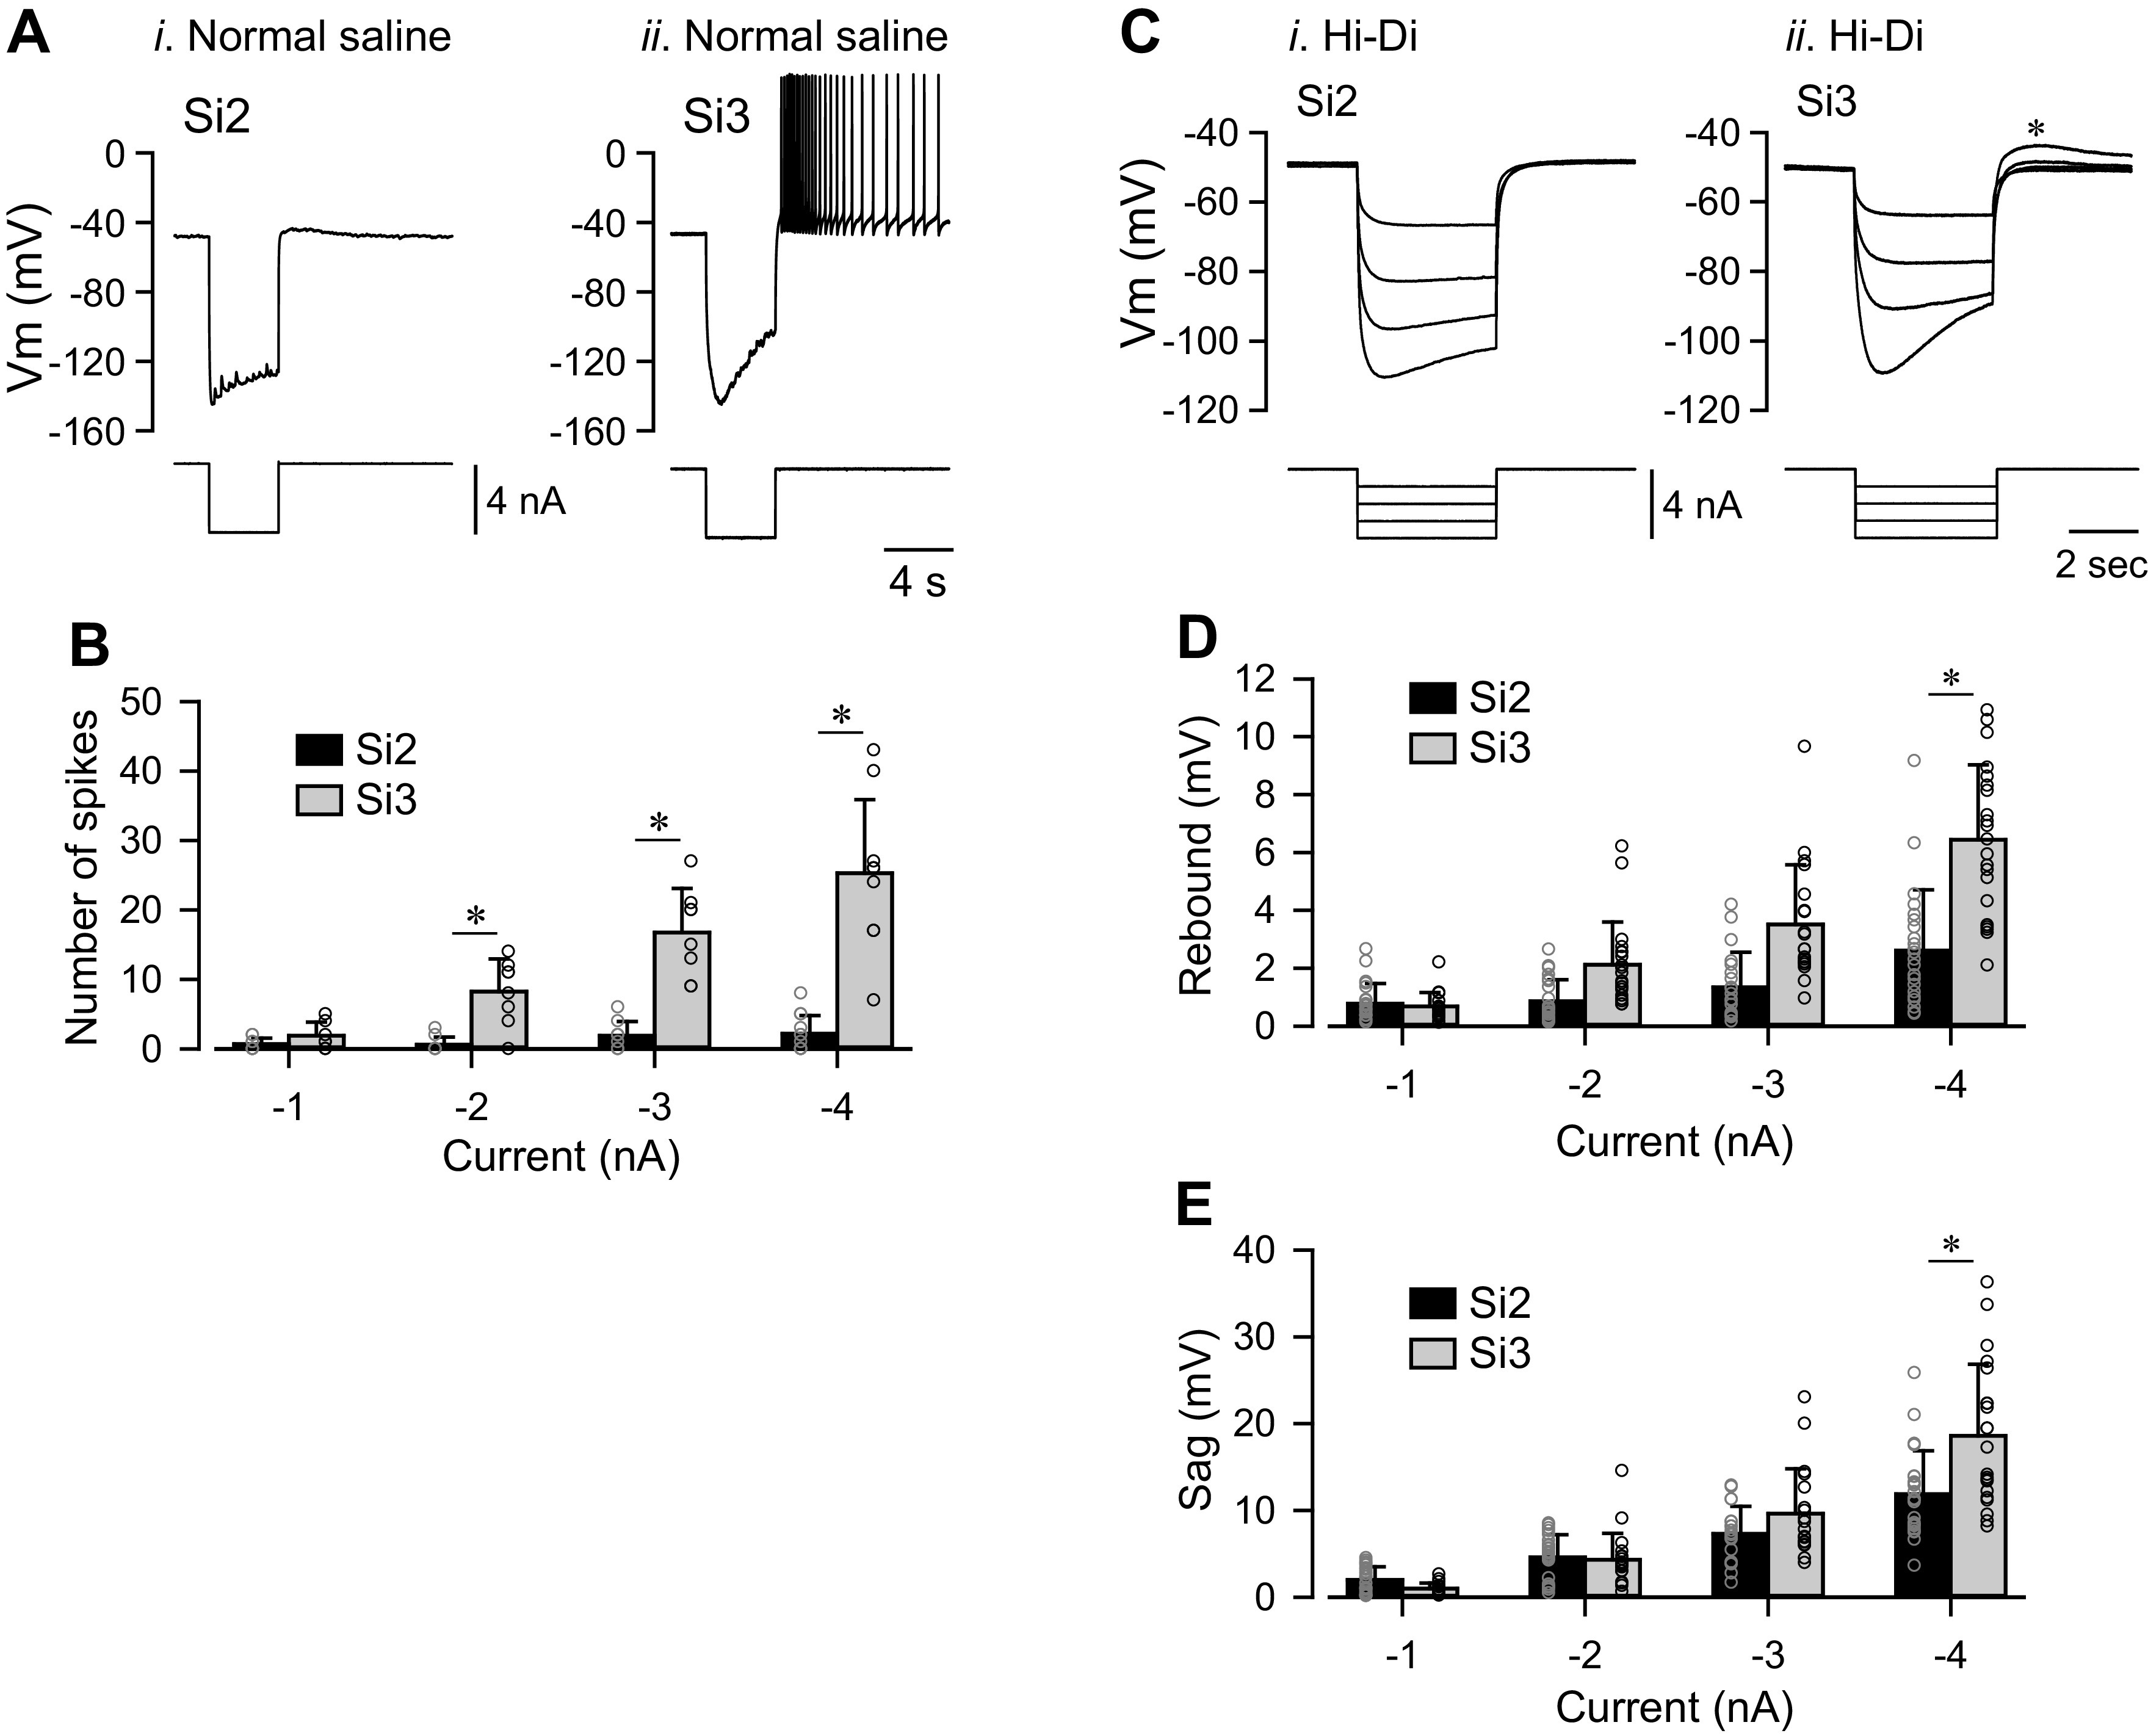
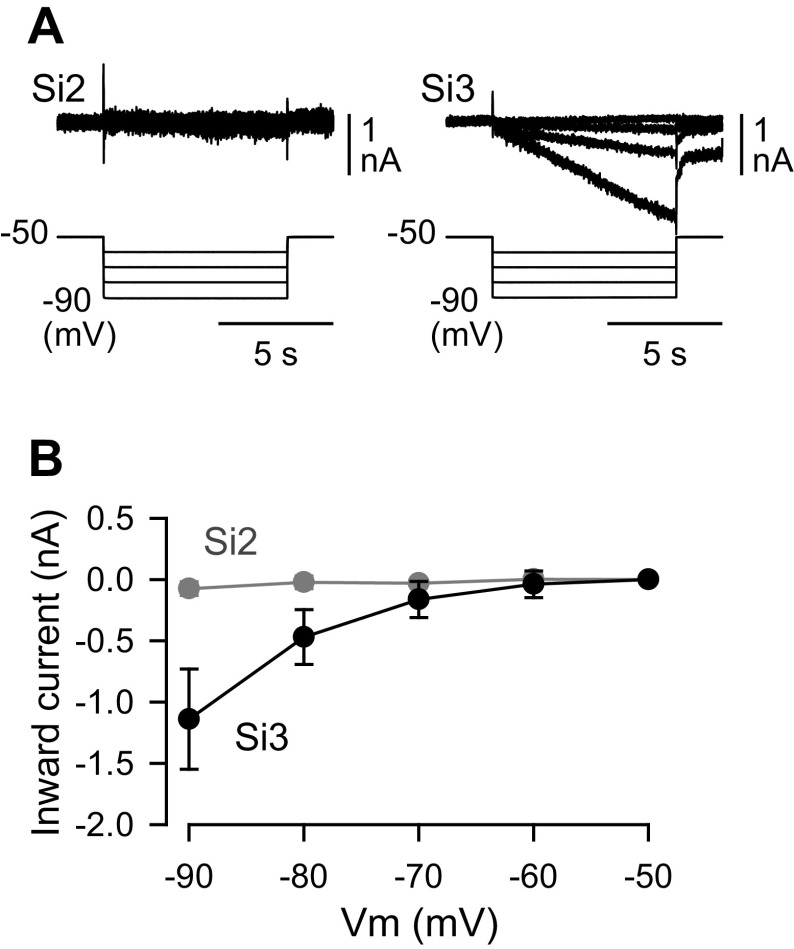
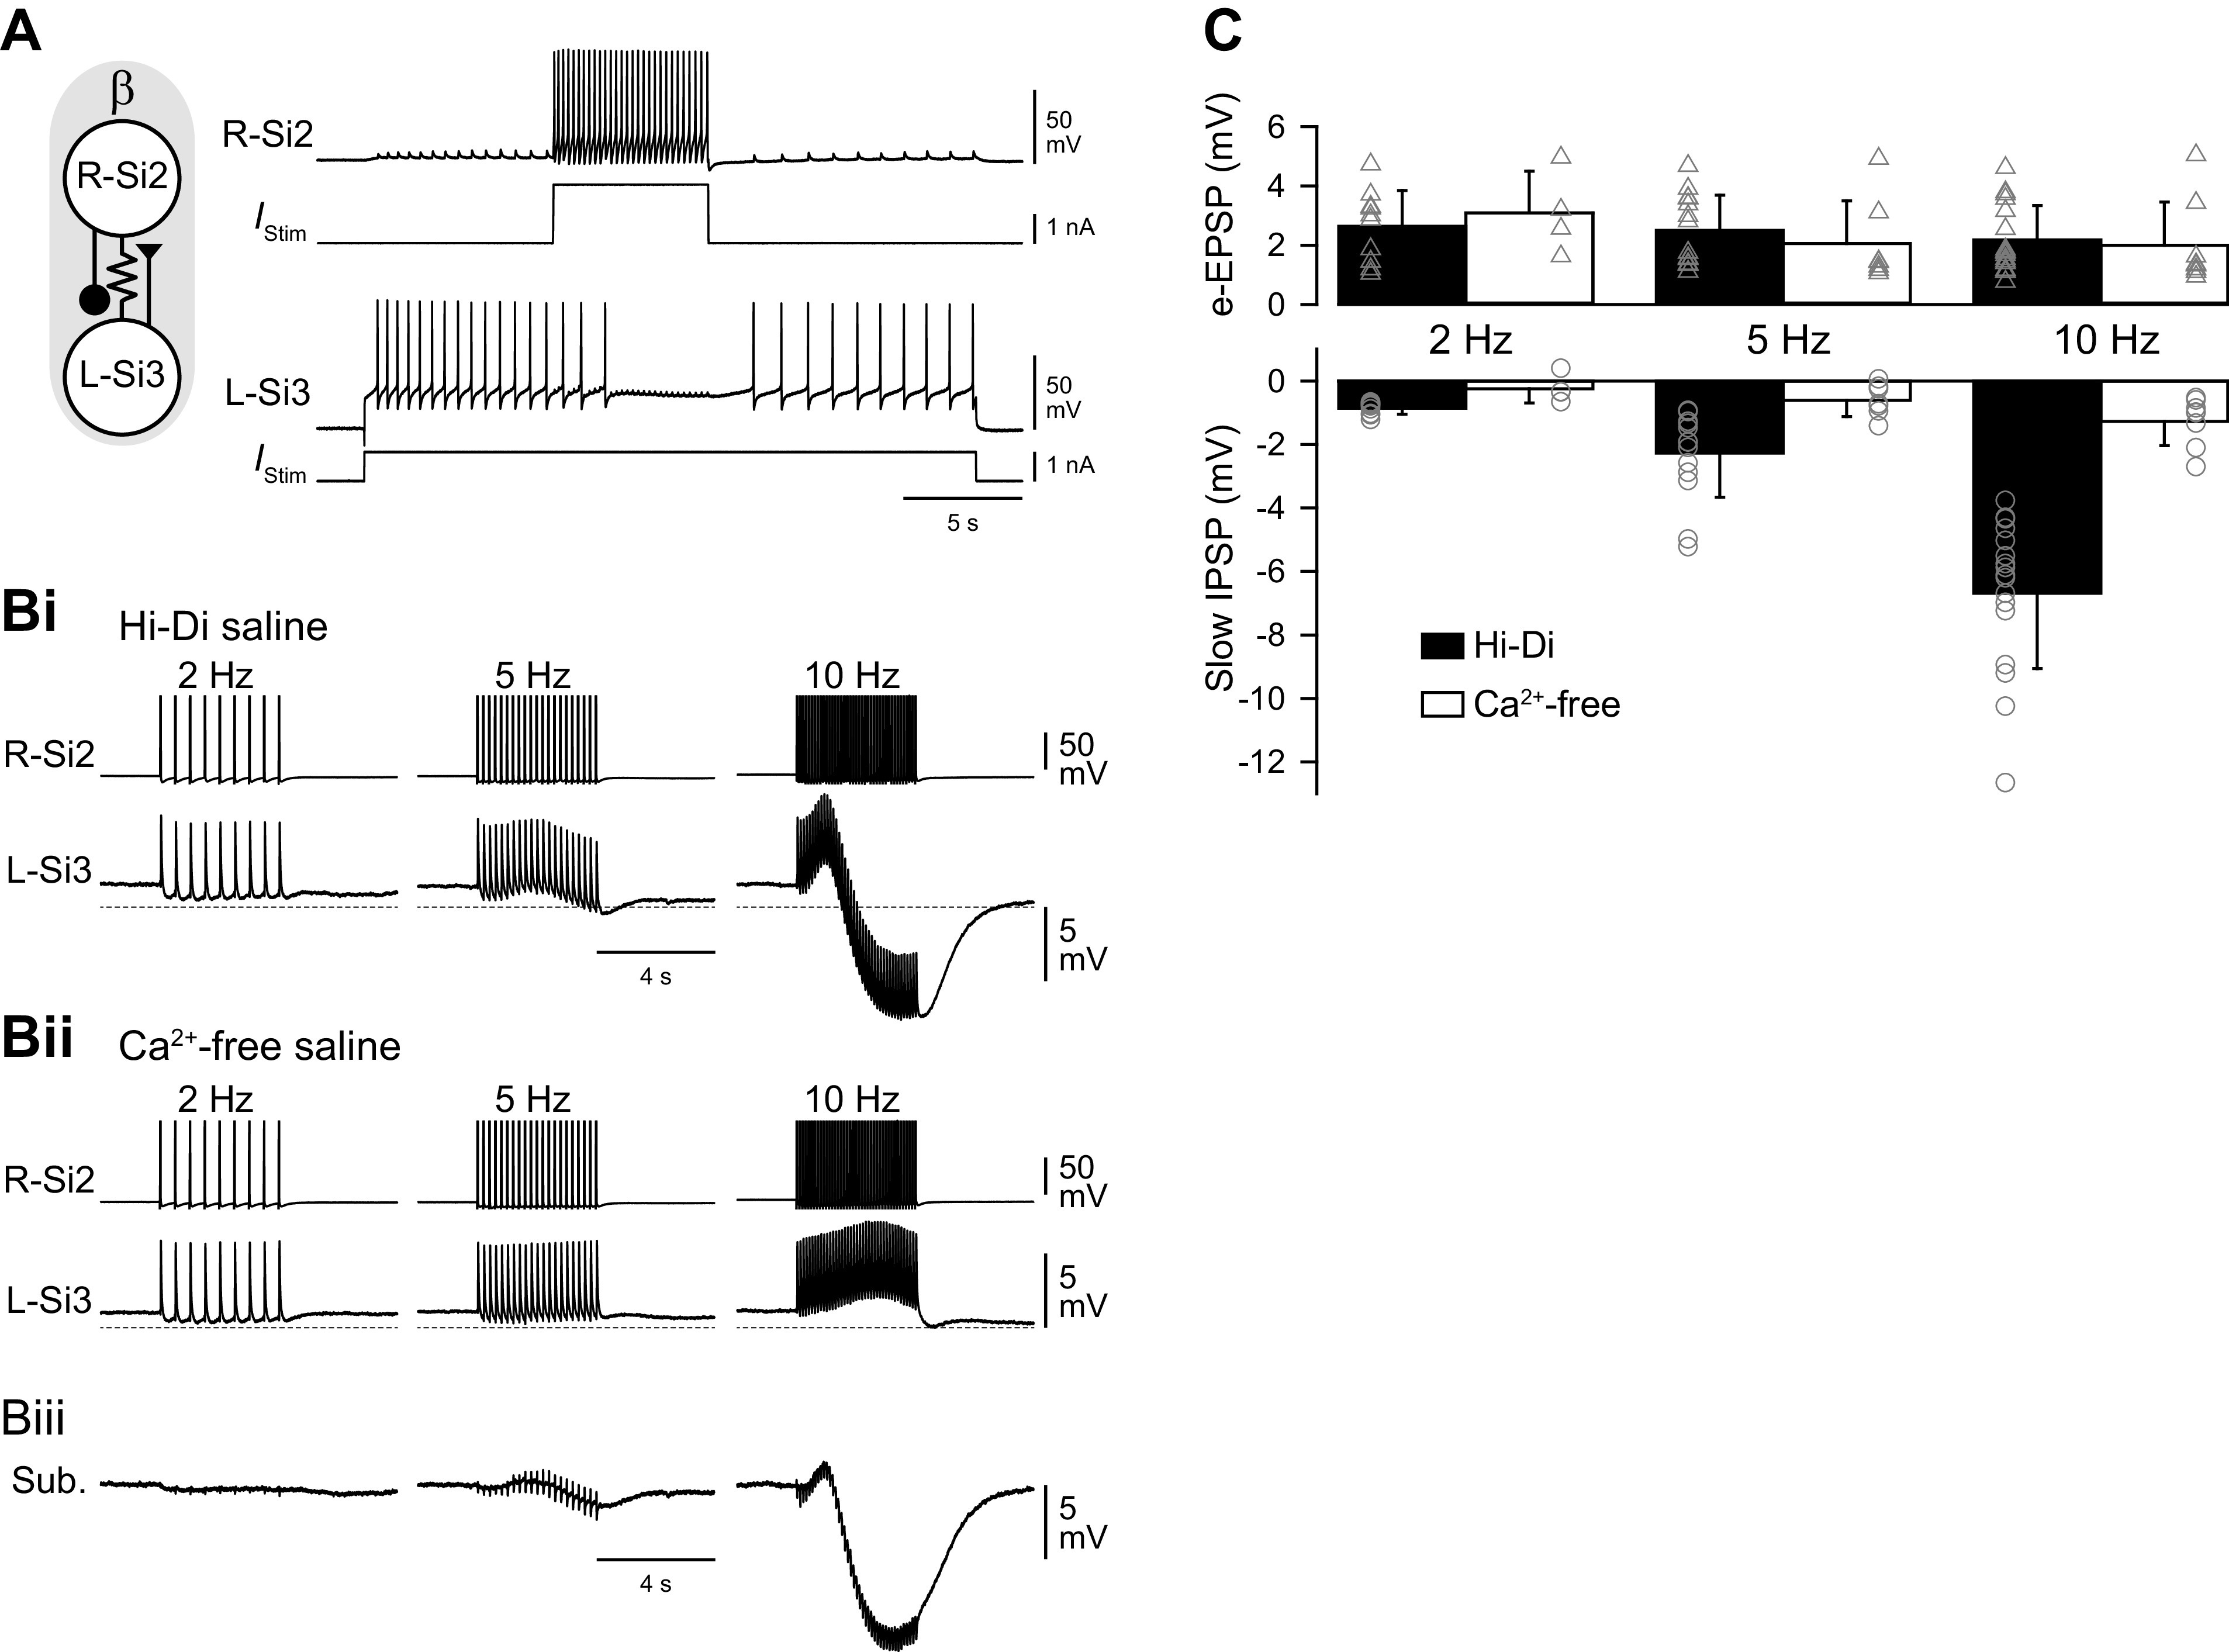
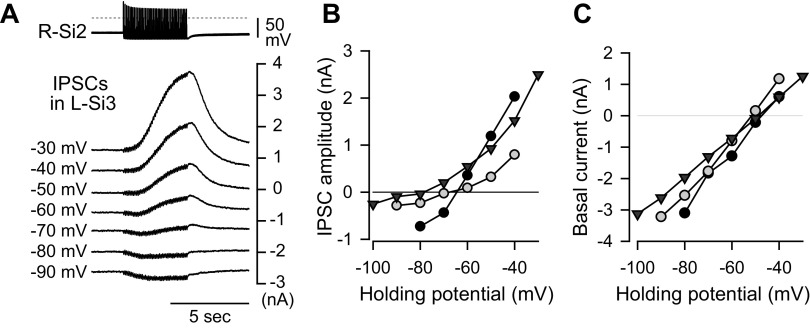
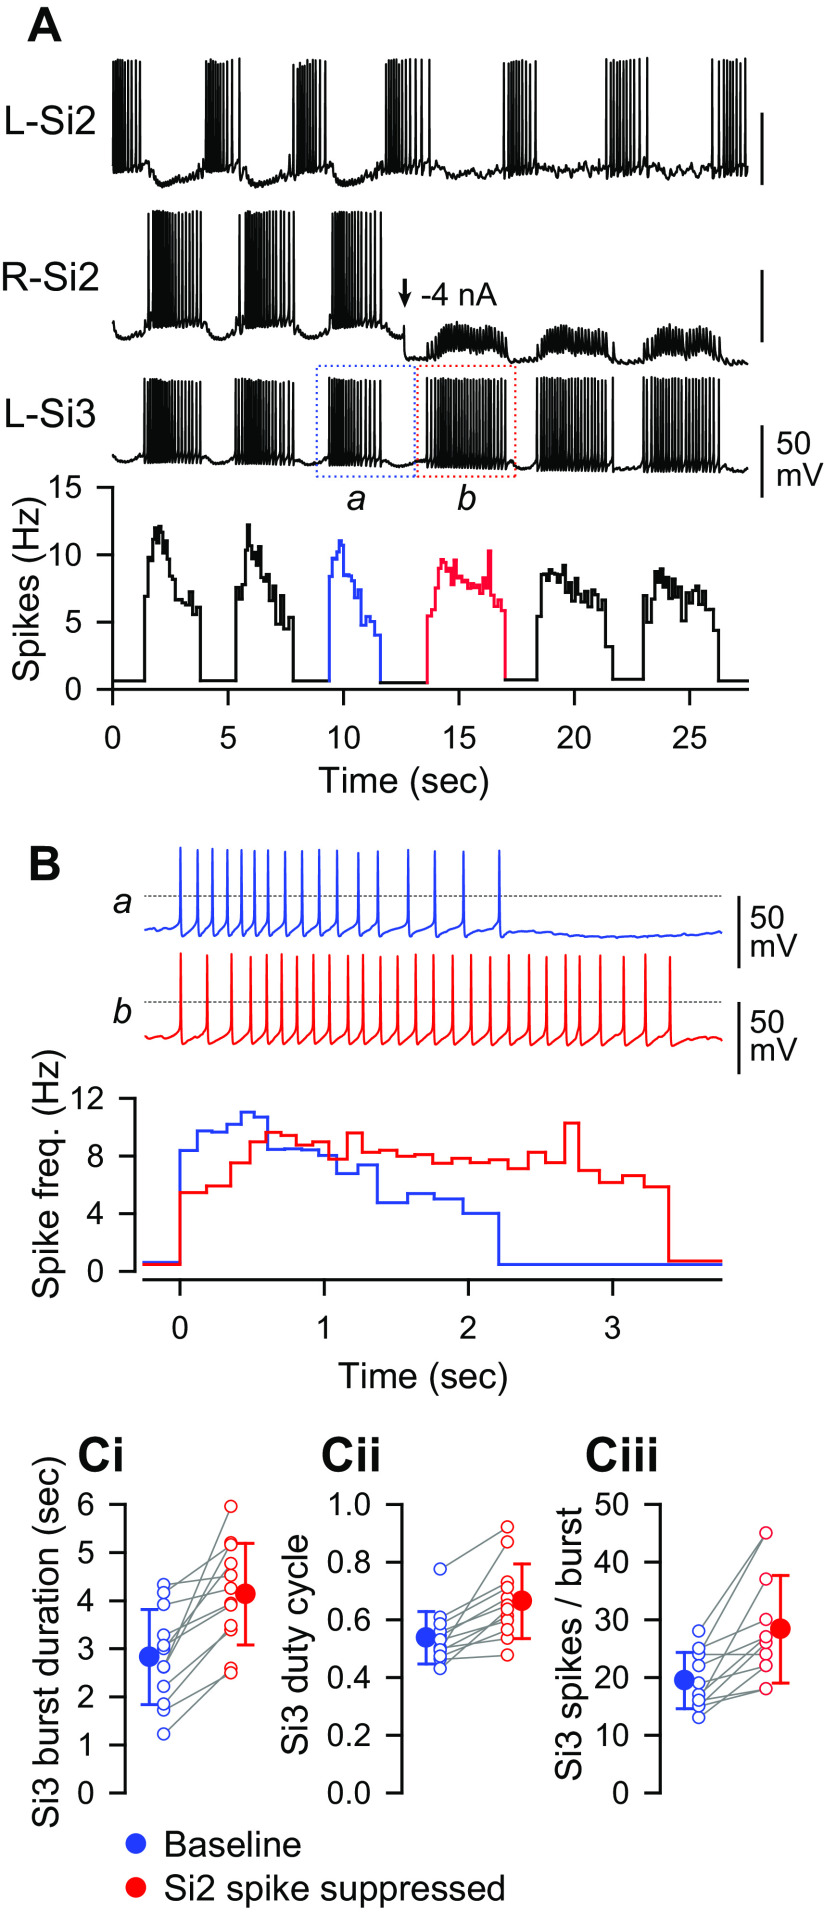
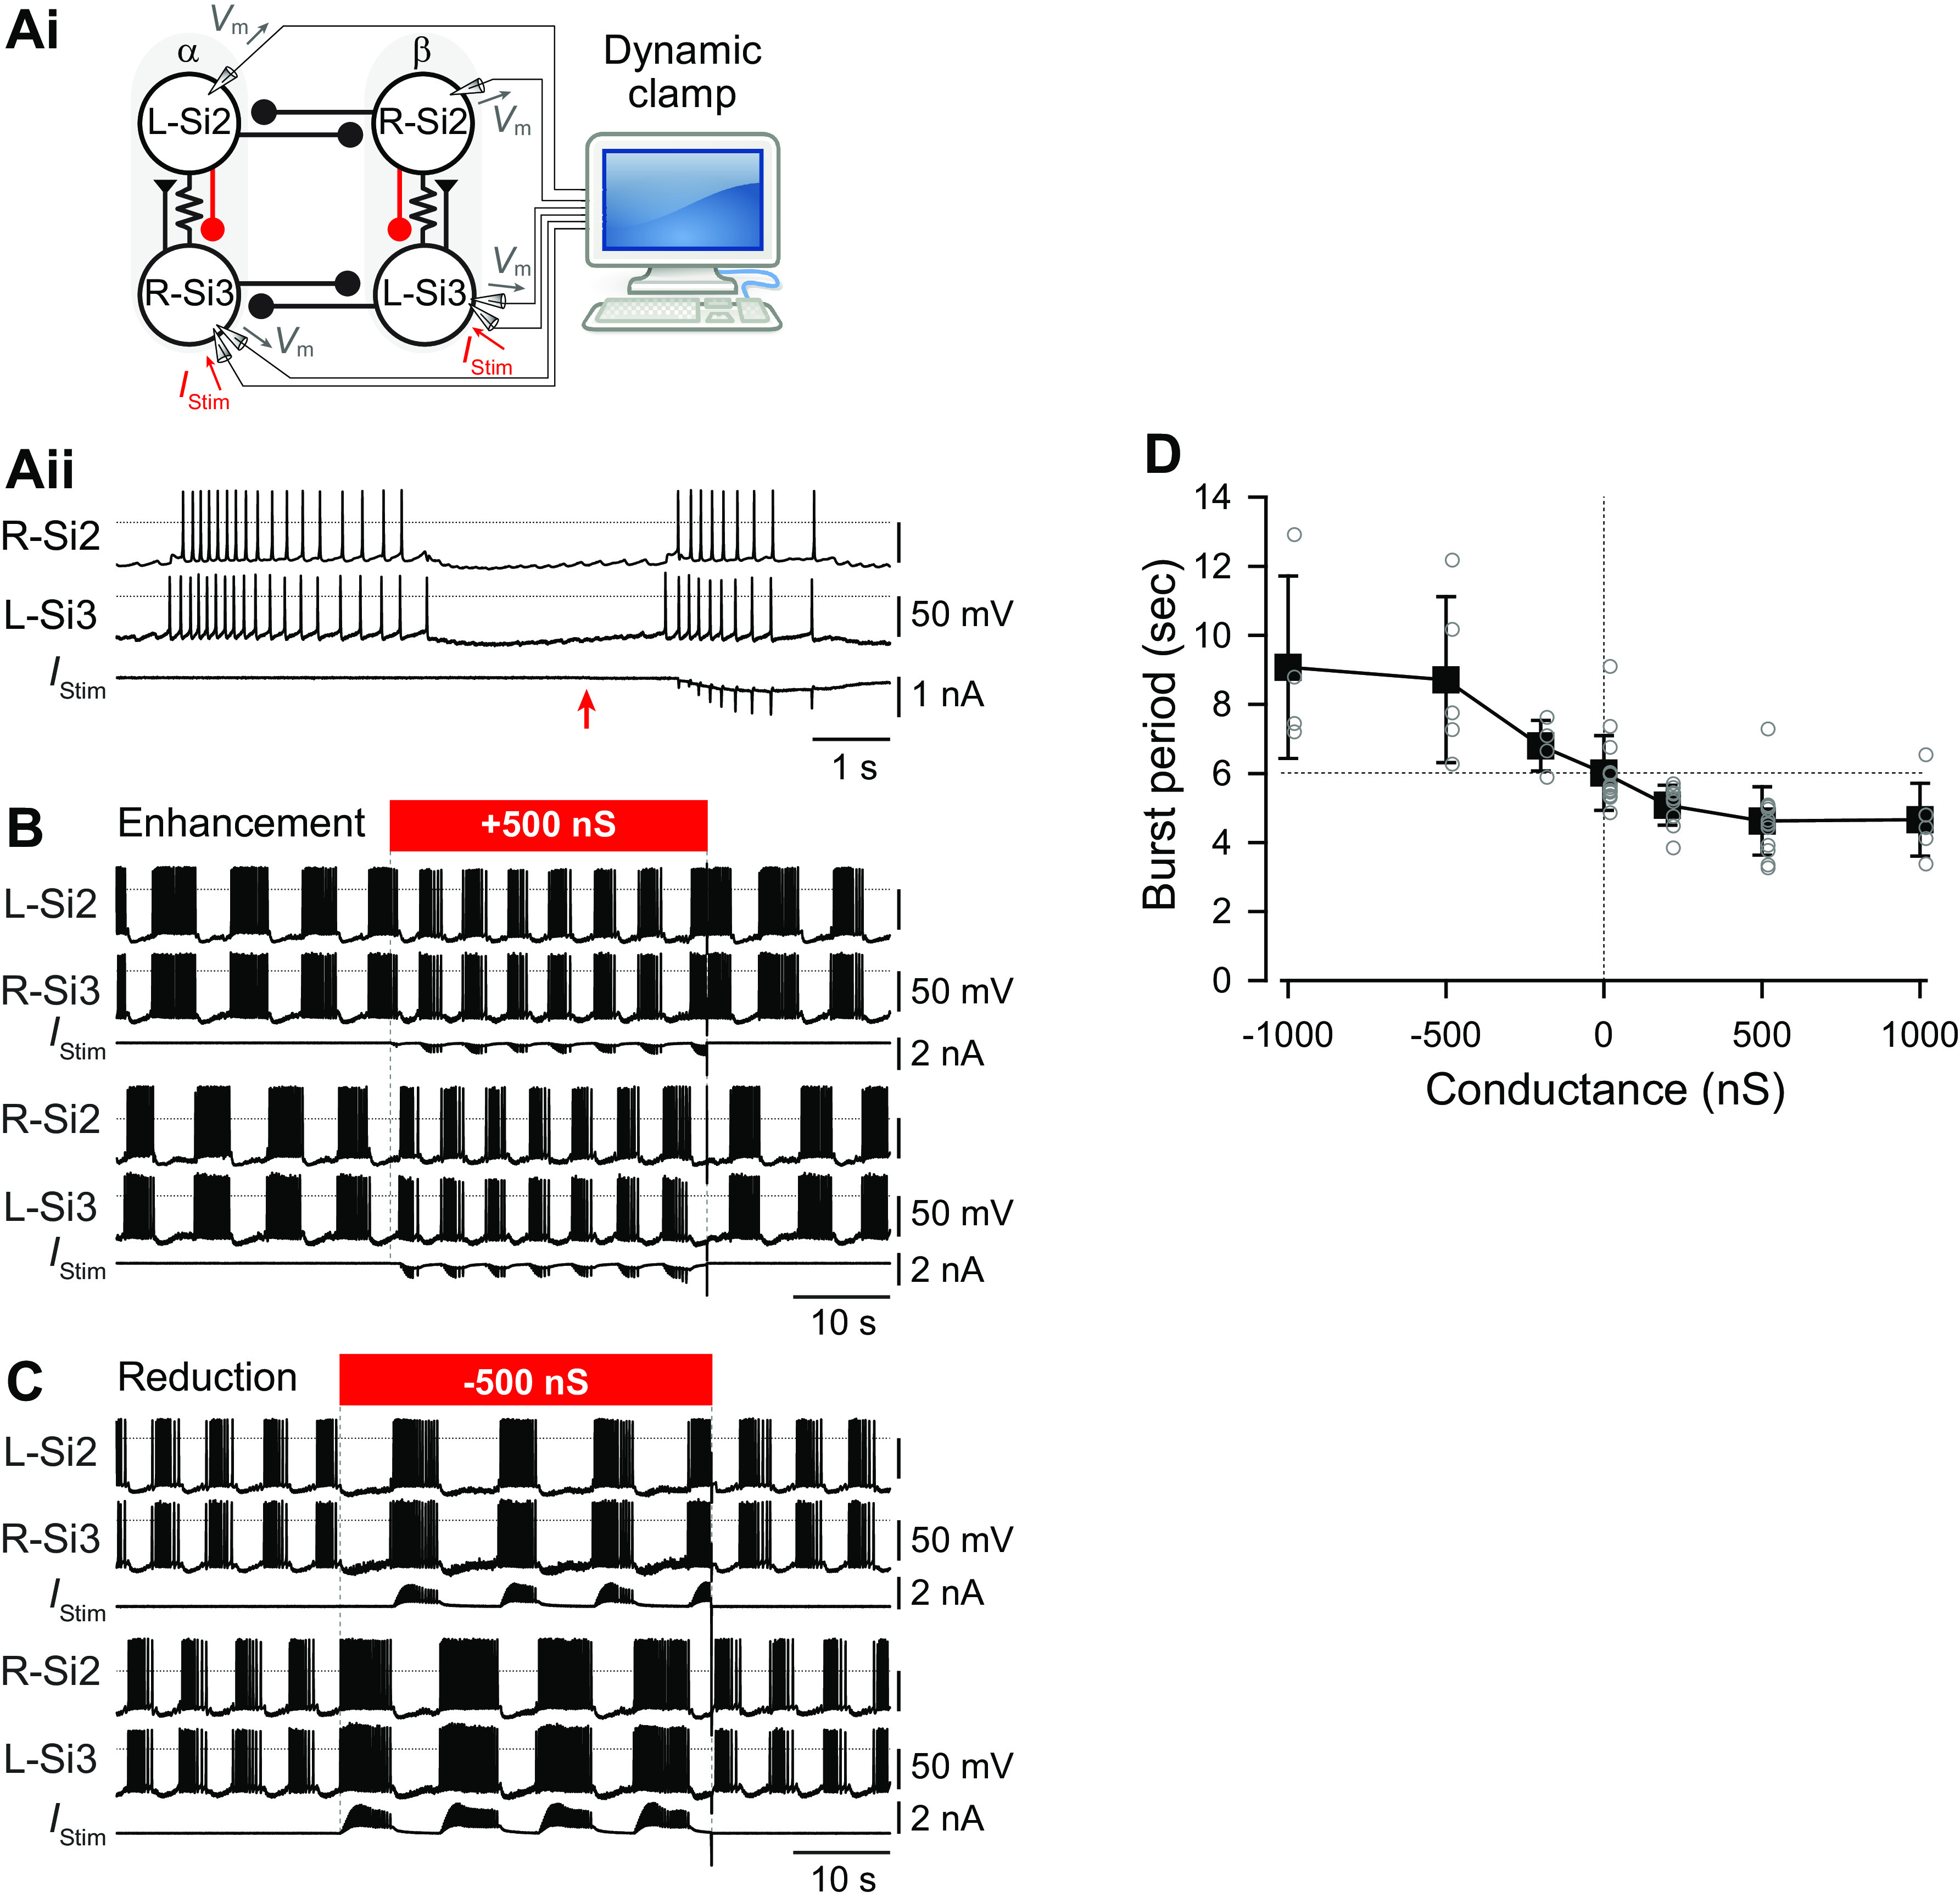
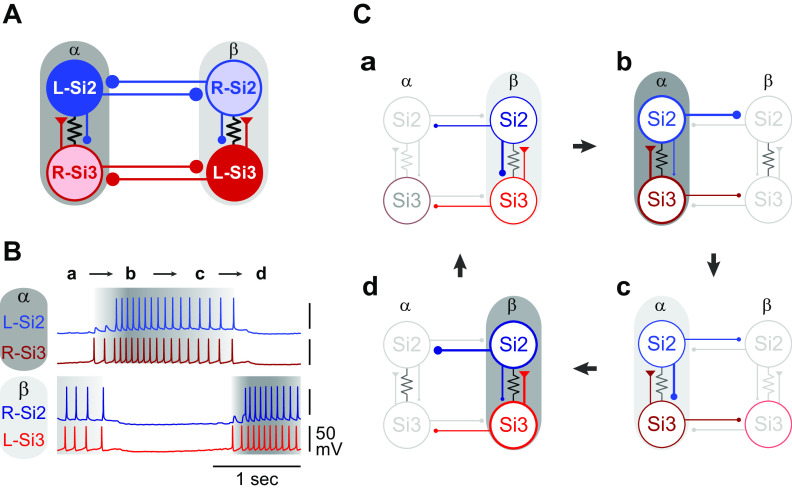
Reciprocally inhibitory modules that form half-center oscillators require mechanisms for escaping or being released from inhibition. The central pattern generator underlying swimming by the nudibranch mollusc, Dendronotus iris, is composed of only four neurons that are organized into two competing modules of a half-center oscillator. In this system, bursting activity in left-right alternation is an emergent property of the network as a whole; none of the neurons produces bursts on its own. We found that the unique synaptic actions and membrane properties of the two neurons in each module (Si2 and the contralateral Si3) play complementary roles in generating stable bursting in this network oscillator. Although Si2 and Si3 each inhibits its contralateral counterpart, Si2 plays a dominant role in evoking fast and strong inhibition of the other module, the termination of which initiates postinhibitory rebound in the Si3 of that module by activating a hyperpolarization-activated inward current. Within each module, the synaptic actions and membrane properties of the two neurons complement each other: Si3 excites Si2, which then feeds back slow inhibition to Si3, terminating the burst. Using dynamic clamp, we showed that the magnitude of the slow inhibition sets the period of the oscillator. Thus, the synaptic actions of Si2 provide the hyperpolarization needed for the other module to rebound stably, whereas the membrane properties of Si3 in each module cause it to rebound first and excite Si2 to maintain the burst until terminated by the slow inhibition from Si2, which releases the other module to become active.NEW & NOTEWORTHY Half-center oscillators composed of reciprocally inhibitory neurons have been posited for over a century to underlie the production of rhythmic movements. The Dendronotus swim central pattern generator may be the simplest such circuit with only two pairs of bilaterally represented neurons. This study completes the description of the mechanism by which this network oscillator functions, showing how stable rhythmic activity arises from the complementary membrane and synaptic properties of the two neurons in the competing modules.

Keywords: gastropod; invertebrate; locomotion; rhythmogenesis; voltage clamp.


Conflict of interest statement

No conflicts of interest, financial or otherwise, are declared by the authors.

Figures

None
Graphical abstract
Figure 1.
Figure 1.
The central pattern generator (CPG) underlying the swimming behavior of Dendronotus iris. A: schematic drawing of the cell body locations and the axonal projections of the swim CPG neurons, Si2 (blue) and Si3 (red), in the Dendronotus brain, showing cerebral, pleural, and two pedal (proximal and distal) ganglia based on Sakurai and Katz (16). Si2 and Si3 have their cell bodies in the proximal pedal ganglion. They each project an axon to the contralateral pedal ganglion through one of the two pedal commissures. Only L-Si2 and R-Si3 axon projections are depicted. B: the previously published connectivity of the Dendronotus swim CPG. Each module of the half-center oscillator (HCO) that constitutes the swimming circuit is composed of Si2 and Si3 with cell bodies on opposite sides. Module α consists of the left Si2 and right Si3, and module β consists of the right Si2 and left Si3. Lines terminating in triangles indicate excitatory synapses, filled circles inhibitory synapses. Resistor symbols indicate electrical connections. C: the swim motor pattern recorded intracellularly from all four swim interneurons (Ci). Si2 and Si3 in the same module fire bursts of action potentials together. The two modules exhibit alternating bursts. A portion of the traces indicated by the dotted box is enlarged in Cii. L-Si3 spikes evoke EPSPs in the R-Si2, leading to one-for-one spikes. EPSP, excitatory postsynaptic potential.
Figure 2.
Figure 2.
The inhibitory synaptic potentials generated by Si2 and Si3 have different reversal potentials. A: schematic diagrams of synaptic connections in the swim CPG and overlaid traces of L-Si2 to R-Si2 (Ai) and R-Si3 to L-Si3 (Aii) synaptic potentials in high-divalent cation (Hi-Di) saline. One electrode was inserted into L-Si2 (Ai) or R-Si3 (Aii) to record the presynaptic action potentials, while two electrodes (one for voltage recording and the other for current injection) were inserted into R-Si2 (Ai) or L-Si3 (Aii), respectively. Positive or negative current was injected into the postsynaptic cell (R-Si2 or L-Si3) to change its membrane potential. The numbers on the left side of the traces indicate the postsynaptic membrane potential. Ten traces were overlaid for each voltage level. Traces were triggered at the peak of presynaptic action potentials. B: the relationships between the amplitude of the IPSPs and the membrane potential of the postsynaptic cells are shown. The values used are derived from the data shown in A. The white circles indicate the Si2-evoked IPSPSs in the contralateral Si2, and the filled circles are the Si3-evoked IPSPs in the contralateral Si3. The regression lines were drawn for the linear portion only. IPSP, inhibitory postsynaptic potential.
Figure 3.
Figure 3.
An Si2 spike train causes a postinhibitory rebound discharge in Si3 of the contralateral module. Top: schematic of circuit with recorded neurons highlighted. Middle: simultaneous intracellular microelectrode recordings. Bottom: plot of instantaneous spike frequency of stimulated neuron. A: depolarization of the L-Si2 with a 4-s, 4 nA current pulse, caused it to fire spike train with a peak frequency of 15 Hz, which declined to about 10 Hz. Si2 spiking evoked hyperpolarizing responses in Si2 and Si3 of the other module, followed by postinhibitory discharges in the L-Si3 that evoked EPSPs in the R-Si2 (*). B: depolarization of the R-Si3 with a 4-s, 3 nA current pulse caused it to fire with a peak frequency of 14 Hz, which decayed to 10 Hz. Si3 spiking produced only small hyperpolarization in the neurons of the other module and caused no rebound discharge. EPSP, excitatory postsynaptic potential.
Figure 4.
Figure 4.
A Si2 spike train causes a sag depolarization and a postinhibitory rebound depolarization in postsynaptic Si3. A: a 4-s, 10-Hz spike train evoked with brief current pulses (10 nA, 20 ms) in the L-Si2 caused hyperpolarization of both Si2 and Si3 in Module β. After the stimulation, the membrane potential of the postsynaptic Si2 slowly recovered back to the resting potential, whereas Si3 showed a faster recovery and a rebound depolarization (*), which lasted for 10–15 s. B: a 10-Hz spike train in the R-Si3 caused hyperpolarization of both Si2 and Si3 in Module β. The amplitude of hyperpolarization was smaller than those evoked by Si2 in A, and there was no rebound depolarization after the stimulus. C: amplitudes of the Si2- and Si3-evoked hyperpolarization in contralateral (c) and ipsilateral (i) postsynaptic neurons. Each bar represents means ± SD (n = 7–15). D: amplitudes of the postinhibitory rebound depolarization. Each bar represents means ± SD (n = 7–16). Hi-Di, high-divalent cation; IPSP, inhibitory postsynaptic potential.
Figure 5.
Figure 5.
Si3 but not Si2 showed sag potential and rebound depolarization. A: membrane potential responses (upper traces) of Si2 i) and Si3 ii) to a hyperpolarizing current pulse (−4 nA for 4 s, bottom trace) in normal saline. B: the numbers of spikes in Si2 (black) and Si3 (gray) evoked after hyperpolarizing current pulses of various amplitudes (−1, −2, −3, and −4 nA). Each bar represents means ± SD (Si2, n = 9–12; Si3, n = 7–10). The asterisk indicates significant difference (see text). C: overlaid membrane potential responses (top traces) of Si2 i) and Si3 ii) to hyperpolarizing current pulses (4 s, −1 to −4 nA, bottom traces) in high-divalent cation (Hi-Di) saline. The asterisk indicates a depolarizing overshoot. D: amplitudes of peak rebound depolarization with respect to resting membrane potential in Si2 (black) and Si3 (gray) after hyperpolarizing current injections (−1 to −4 nA, 4 s). The asterisk indicates significant difference (see text). E: the amplitudes of sag depolarization, measured from peak hyperpolarization to value at end of pulse, in Si2 (black) and Si3 (gray) during the hyperpolarizing current injection (−1 to −4 nA, 4 s). The asterisk indicates significant difference (see text). Vm, membrane potential.
Figure 6.
Figure 6.
Si3, but not Si2, exhibited a hyperpolarization-activated inward current. A: membrane current responses (top traces) and command voltage pulses (bottom traces). The membrane potentials of Si2 (left) and Si3 (right) were held at −50 mV under voltage clamp and then were stepped to −60, −70, −80, and −90 mV. Each neuron was impaled with two electrodes (one for voltage recording and the other for current injection). All voltage-clamp experiments were performed in high-divalent cation (Hi-Di) saline. B: the amplitudes (nA, means ± SD; Si2, n = 5; Si3, n = 8) of membrane current are plotted against the command voltage values (mV). Vm, membrane potential.
Figure 7.
Figure 7.
A spike train in Si2 evokes a slow inhibitory synaptic potential in Si3 in the same module. A: an Si2 spike train inhibited ongoing spiking activity of Si3. Simultaneous intracellular records of Si2 and Si3 and the injected current traces. Tonic spiking in L-Si3 was evoked by 25 s, 1 nA current pulse. A 5 s, 2 nA current pulse in the R-Si2 inhibited spiking of the L-Si3. The schematic on the left shows synaptic interactions between Si2 and Si3 within the module. B: a spike train of Si2 (top trace) produced complex membrane potential responses of Si3 (bottom trace) in the same module, part of which was mediated by chemical transmitter release. Trains of action potentials in R-Si2 were evoked by injecting repetitive current pulses (7-15 nA, 20 ms) at 2, 5, and 10 Hz. Bi: in high-divalent cation (Hi-Di) saline, the R-Si2 spikes produced sharp electrotonic EPSPs in L-Si3, which overrode on a slow hyperpolarizing potential. Bii: Ca2+-free saline blocked the slow hyperpolarizing potential, leaving the electrotonic EPSPs relatively unchanged. Biii: subtraction of the Bii waveform from the Bi waveform revealed the slow hyperpolarizing component that was largely blocked by the Ca2+-free saline. C: amplitudes of electrotonic EPSPs (top graph) and the slow hyperpolarizing potentials (slow IPSPs; bottom graph) recorded in Hi-Di saline (black bars) and in Ca2+-free Hi-Di saline (white bars). Ca2+-free saline diminished the slow IPSPs but had little effect on the electrotonic EPSPs. Bars are means ± SD. EPSP, excitatory postsynaptic potential; IPSP, inhibitory postsynaptic potential.
Figure 8.
Figure 8.
R-Si2 evoked a slow outwardly rectifying current in L-Si3. A: example traces of the synaptic currents at different holding potentials. Spike trains were evoked in R-Si2 by injecting repetitive current pulses (10 nA, 20 ms) at 10 Hz. Seven traces of the Si2 spike trains are overlaid and shown at the top, whereas the slow IPSPs in L-Si3, which was voltage-clamped at various potential levels, are shown below. The holding potentials (from −90 mV to −30 mV) are shown on the left side of the trace. B: the amplitudes of the slow IPSPs plotted against the holding potential of the postsynaptic Si3. C: the holding current was linear with respect to the holding potentials used in this voltage-clamp experiment. IPSP, inhibitory postsynaptic potential.
Figure 9.
Figure 9.
Suppression of the R-Si2 spiking prolonged Si3 bursts. A: simultaneous intracellular recordings of an Si2 pair and an L-Si3. A plot of instantaneous spike frequency is shown at the bottom. From the time indicated by the arrow, a hyperpolarizing current of −4 nA was applied to suppress the action potential firing of R-Si2. During the hyperpolarization, trains of EPSPs evoked by the L-Si3 spikes are visible in R-Si2. The bursts before and during the hyperpolarizing current injection are boxed by blue (a) and red (b) dotted lines. The spike frequency during the period is indicated by the same color in the plot below. B: a comparison /of bursts before (a; blue) and during the hyperpolarizing current injection (b; red), expanded from A. The dotted lines indicate 0 mV. C: comparisons of burst duration (Ci), burst duty cycle (Cii), and the number of Si3 spikes per burst (Ciii) before (blue) and immediately after (red) the suppression of the Si2 spikes by hyperpolarizing current injection. All three factors increased when the Si2 spikes were suppressed. Means ± SD represented by filled circle and error bars. EPSP, excitatory postsynaptic potential.
Figure 10.
Figure 10.
Artificial enhancement or suppression of the slow inhibitory synaptic action of Si2 onto Si3 within each half-center module changed the burst period during a swim motor pattern. Ai: the experimental arrangement for dynamic clamp. Every time the membrane potential (Vm) of Si2 surpassed a specified threshold (50% of spike height), an artificial synaptic current (IStim) was calculated by the computer and injected into the contralateral Si3 to boost the existing Si2-to-Si3 slow synapse (red). Traces in Aii show the change in the burst before and during the application of dynamic clamp. The red arrow indicates the time when the dynamic clamp was started. The horizontal dotted lines show 0 mV. B: simultaneous intracellular recording from all four neurons shows the effect of dynamic clamping (red bar). The synaptic boost caused by adding artificial synaptic conductance (500 nS) with the dynamic clamp shortening the duration of bursts and decreased the period. C: synaptic suppression by counteracting IPSPs with a negative postsynaptic conductance to Si3 extended the burst duration and consequently increased the period. D: plot of burst periods against the conductance of artificial synapses from Si2 to Si3 in the same half-center module. Increasing the synaptic conductance reduced the burst period, whereas counteracting it extended the burst period. IPSP, inhibitory postsynaptic potential.
Figure 11.
Figure 11.
Sequence of activities of the central pattern generator (CPG) neurons. A: the updated connectivity of the Dendronotus swim CPG. In each module (α and β) Si3 makes an excitatory synapse on the contralateral Si2, which returns a slow inhibitory synapse onto the Si3. Lines terminating in triangles indicate excitatory synapses, filled circles inhibitory synapses. Resistor symbols indicate electrical connections. B: the activity of a circuit neuron is divided into four parts (a, b, c, and d) shown schematically in C. In phase a, Si2 inhibition of Si3 increases, causing the firing frequency of Si2 and Si3 in module β to decline, thereby decreasing inhibition of module α. Phase b, Si3 in module α starts firing, and Si2, which is driven by Si3, begins to fire a little later. Phase c, Si2 inhibition of Si3 increases, causing the firing frequency of Si2 and Si3 in module α to decline, thereby decreasing inhibition of module β. Phase d, Si3 in module β escapes or is released from inhibition and starts firing together with Si2 and suppressing activity in module α.

Similar articles

Cited by

References

    1. Brown TG. The intrinsic factors in the act of progression in the mammal. Proc R Soc Lond B 84: 308–319, 1911. doi:10.1098/rspb.1911.0077. - DOI
    1. Moult PR, Cottrell GA, Li WC. Fast silencing reveals a lost role for reciprocal inhibition in locomotion. Neuron 77: 129–140, 2013. doi:10.1016/j.neuron.2012.10.040. - DOI - PMC - PubMed
    1. Grillner S, El Manira A. The intrinsic operation of the networks that make us locomote. Curr Opin Neurobiol 31: 244–249, 2015. doi:10.1016/j.conb.2015.01.003. - DOI - PubMed
    1. Kiehn O. Decoding the organization of spinal circuits that control locomotion. Nat Rev Neurosci 17: 224–238, 2016. doi:10.1038/nrn.2016.9. - DOI - PMC - PubMed
    1. Friesen WO, Stent GS. Neural circuits for generating rhythmic movements. Annu Rev Biophys Bioeng 7: 37–61, 1978. doi:10.1146/annurev.bb.07.060178.000345. - DOI - PubMed

Publication types

LinkOut - more resources