. 2022 Mar 29;119(13):e2121822119.
doi: 10.1073/pnas.2121822119. Epub 2022 Mar 23.

Sympatric speciation of the spiny mouse from Evolution Canyon in Israel substantiated genomically and methylomically

Affiliations

Sympatric speciation of the spiny mouse from Evolution Canyon in Israel substantiated genomically and methylomically

Yinjia Wang et al. Proc Natl Acad Sci U S A. .

Abstract

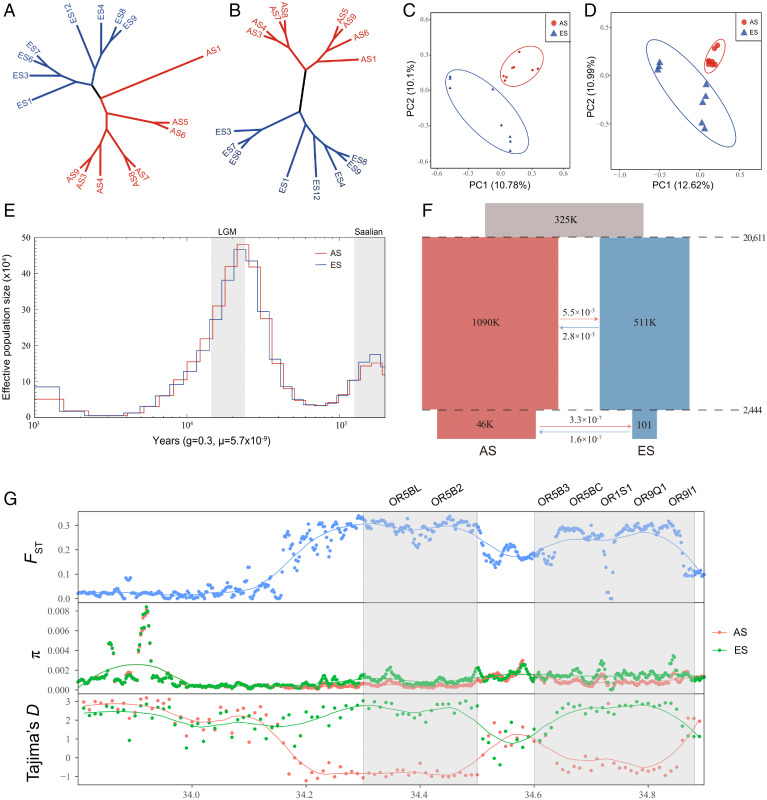
SignificanceWhether sympatric speciation (SS) is rare or common is still debated. Two populations of the spiny mouse, Acomys cahirinus, from Evolution Canyon I (EC I) in Israel have been depicted earlier as speciating sympatrically by molecular markers and transcriptome. Here, we investigated SS both genomically and methylomically, demonstrating that the opposite populations of spiny mice are sister taxa and split from the common ancestor around 20,000 years ago without an allopatric history. Mate choice, olfactory receptors, and speciation genes contributed to prezygotic/postzygotic reproductive isolation. The two populations showed different methylation patterns, facilitating adaptation to their local environment. They cope with abiotic and biotic stresses, due to high solar interslope radiation differences. We conclude that our new genomic and methylomic data substantiated SS.

Keywords: adaptation; genome divergence; methylation; population genetics; sympatric speciation.


Conflict of interest statement

The authors declare no competing interest.

Figures

Fig. 1.
Fig. 1.
A. cahirinus genome, phylogenetic and evolutionary analyses. (A) Overview of the spiny mouse genome. From a to e, represented genomic positions (in Mb) of the 19 pseudochromosomes of spiny mouse, guanine-cytosine content, TE content, gene density, and interconnections of paralogs, respectively. (B) Phylogenetic tree of 14 species and the evolution of gene families. The x axis shows the estimated divergence time of each node (million years ago, Mya). The number of expaned and contracted gene families are indicated by red and green numbers, respectively. (C) The ration of three topologies (t1–t3) around focal internal branches (node 2) of ASTRAL species trees. The numbers 1, 3, 20, and 24 represent different branches in the species tree.
Fig. 2.
Fig. 2.
Population structure and divergence. (A and B) neighbor-joining tree based on SVs and SNPs, respectively. (C and D) PCA based on SVs and SNPs, respectively. Colors in red and blue represent AS and ES, respectively. (E) Demographic history estimated using PSMC. Saalian and LGM are shown in a gray plot. Red and blue lines represent Ne of AS and ES, respectively. (F) The best-fit model was simulated by fastsimcoal2.7. Effective population sizes, divergence time, and an estimate of gene flow are shown. (G) The divergence of seven OR genes in pseudochromosome17 (33-Mb to 35-Mb segments). FST (in blue) is significantly elevated, π is declined, and Tajima's D is significantly differentiated between AS (in red) and ES (in green) populations.
Fig. 3.
Fig. 3.
DNA methylation divergence across the whole genome between two populations. (A) PCA on CpGs between the AS and ES populations. (B) Methylation at TSS, gene bodies, and adjacent upstream and downstream regions in AS and ES. Red line and blue line represent AS and ES, respectively. (C) Differences in average methylation levels between TE regions (DNA, LINE, SINE, LTR, other classes) and background regions. Asterisk represents significantly elevated methylation levels compared to background regions (P < 0.01). (D) Differences in methylation between selected genes and nonselected regions. (E) DMR genes are associated with four functional enrichments, including DNA damage repair, circadian rhythm, kidney system development and liquid balancing, and lipid storage and usage.
Fig. 4.
Fig. 4.
Circadian wake/sleep differences between the AS and ES populations. (A and B) Circadian activities of AS and ES populations, respectively. (C) Center of gravity (hours after lights on) in AS and ES (one-tail t test, P < 0.01). (D) The circadian periods of activity rhythms of AS and ES individuals under constant darkness (one tail t test, P = 0.05).

Similar articles

Cited by

References

    1. Li K., et al. , Sympatric speciation revealed by genome-wide divergence in the blind mole rat Spalax. Proc. Natl. Acad. Sci. U.S.A. 112, 11905–11910 (2015). - PMC - PubMed
    1. Li K., et al. , Transcriptome, genetic editing, and microRNA divergence substantiate sympatric speciation of blind mole rat, Spalax. Proc. Natl. Acad. Sci. U.S.A. 113, 7584–7589 (2016). - PMC - PubMed
    1. Li K., et al. , Incipient sympatric speciation in wild barley caused by geological-edaphic divergence. Life Sci. Alliance 3, 12 (2020). - PMC - PubMed
    1. Barluenga M., Stölting K. N., Salzburger W., Muschick M., Meyer A., Sympatric speciation in Nicaraguan crater lake cichlid fish. Nature 439, 719–723 (2006). - PubMed
    1. Kondrashov A. S., Kondrashov F. A., Interactions among quantitative traits in the course of sympatric speciation. Nature 400, 351–354 (1999). - PubMed

LinkOut - more resources