. 2022 Mar 29;119(13):e2114619119.
doi: 10.1073/pnas.2114619119. Epub 2022 Mar 23.

The virota and its transkingdom interactions in the healthy infant gut

Affiliations

The virota and its transkingdom interactions in the healthy infant gut

Leen Beller et al. Proc Natl Acad Sci U S A. .

Abstract

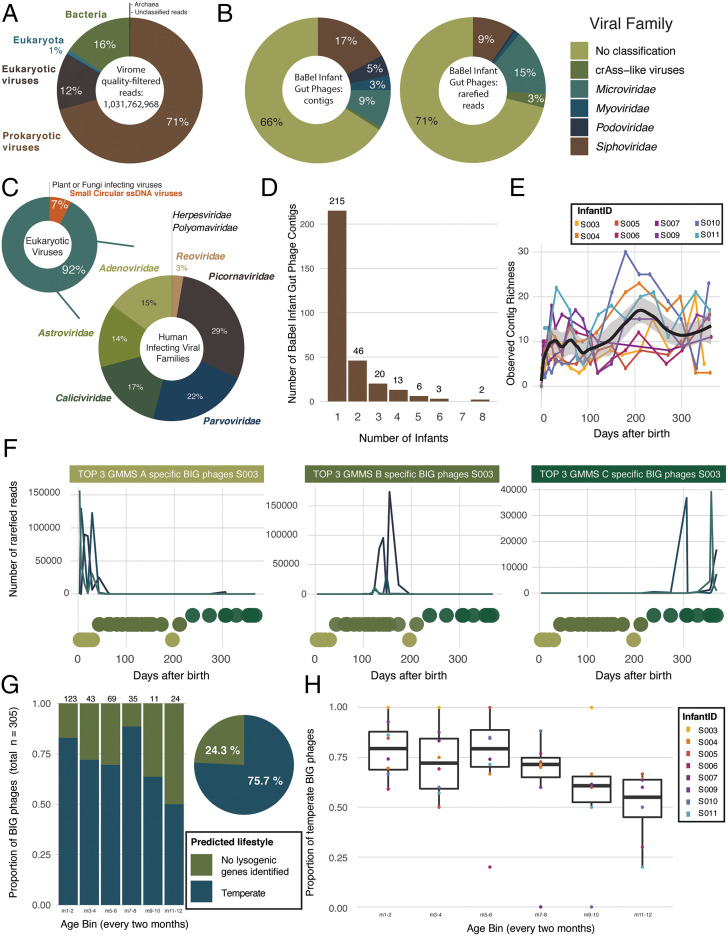
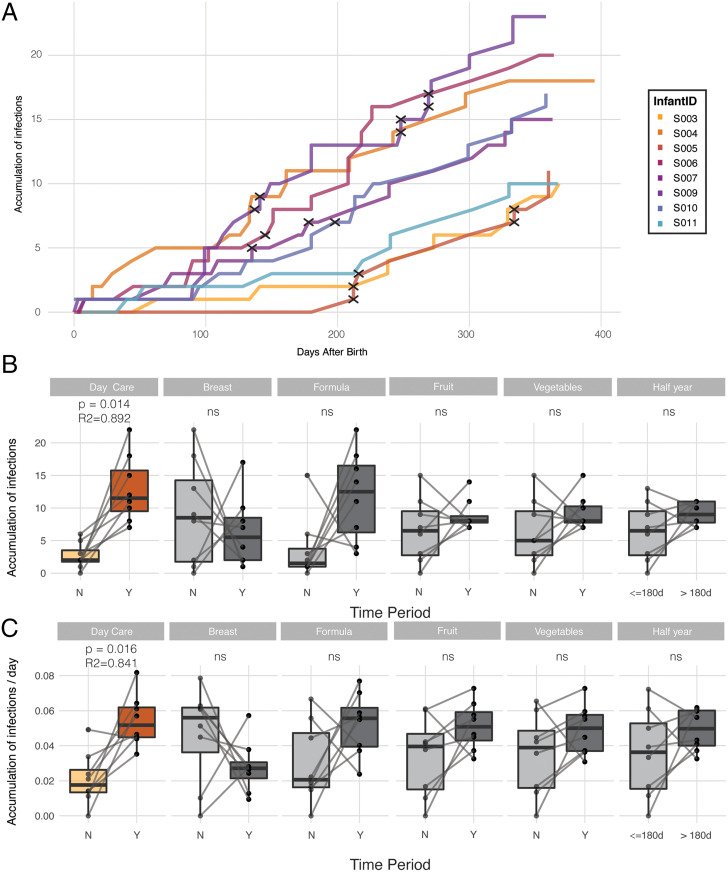
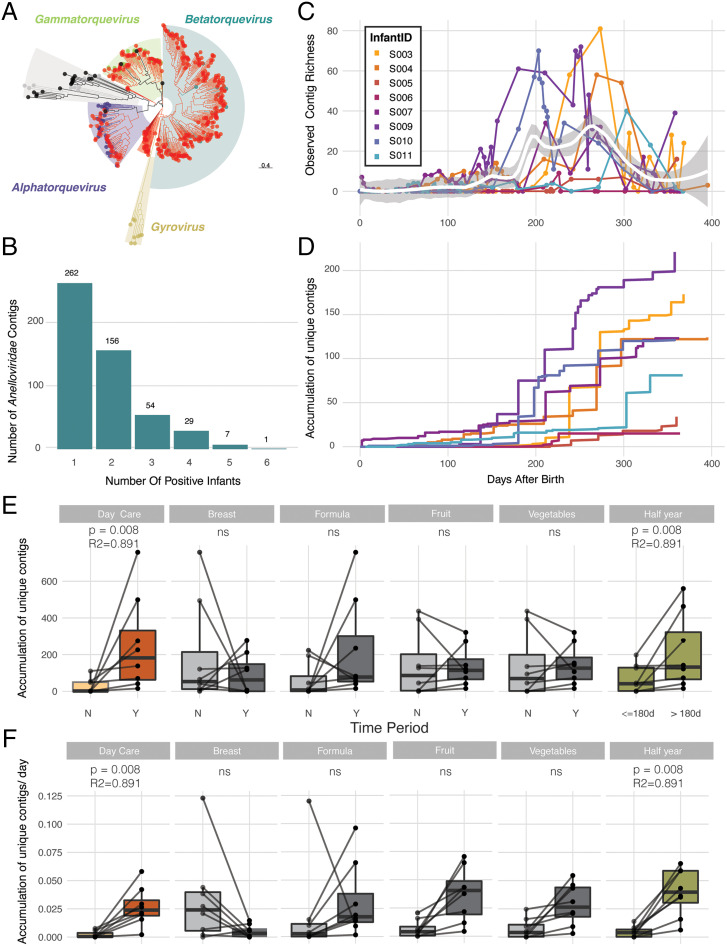
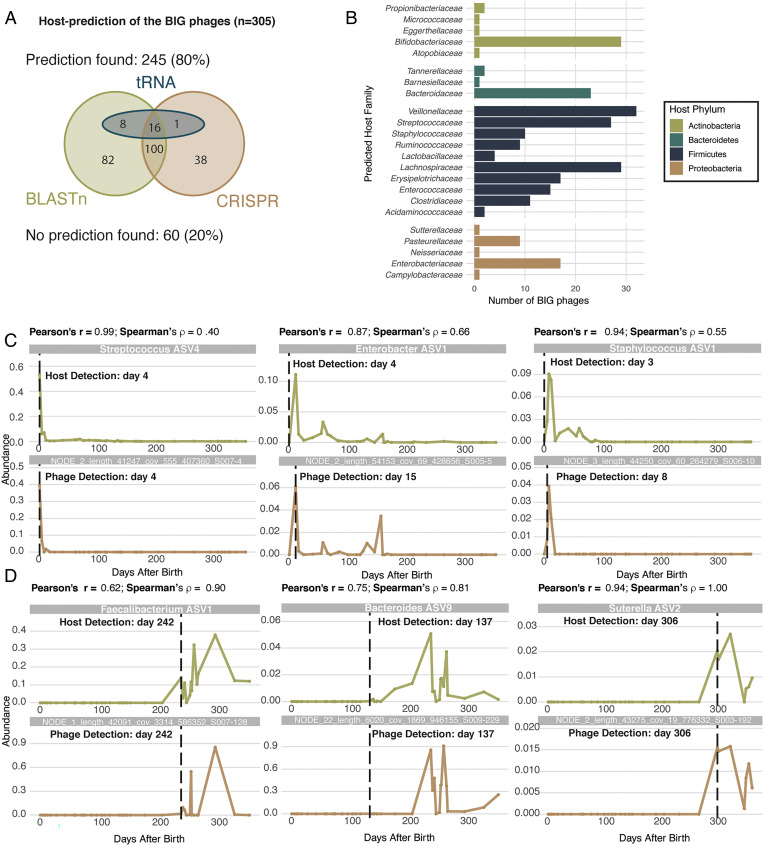
SignificanceMicrobes colonizing the infant gut during the first year(s) of life play an important role in immune system development. We show that after birth the (nearly) sterile gut is rapidly colonized by bacteria and their viruses (phages), which often show a strong cooccurrence. Most viruses infecting the infant do not cause clinical signs and their numbers strongly increase after day-care entrance. The infant diet is clearly reflected by identification of plant-infecting viruses, whereas fungi and parasites are not part of a stable gut microbiota. These temporal high-resolution baseline data about the gut colonization process will be valuable for further investigations of pathogenic viruses, dynamics between phages and their bacterial host, as well as studies investigating infants with a disturbed microbiota.

Keywords: infant; microbiota; transkingdom; virome; virota.


Conflict of interest statement

The authors declare no competing interest.

Figures

Fig. 1.
Fig. 1.
Members of the infant gut virome. (A) Overview of the distribution of the quality-filtered shotgun reads per classification category. On average, 70.7% of the quality-filtered shotgun reads represent prokaryotic viruses. (B) Taxonomic classification of the BIG phages in terms of number of reads (Left) and number of contigs (Right). (C) Overview of the taxonomic distribution of sequenced quality-filtered virome reads belonging to eukaryotic viruses. (C, Top Left) The taxonomy of all eukaryotic viruses is shown per category: human-infecting viruses, small circular ssDNA viruses, and FiVs and/or PiVs. (D) Sharing of the BIG phages by different infants. More than 70% of the BIG phages are individual infant–specific. (E) Richness of the BIG phages over time colored per infant shown here for the samples at predefined time points where the infants were not sick (n = 143; Loess smoothing with span equals 0.25). (F) Examples of BIG phages from infant S003 with a clear preference for a specific GMMS. Preferences for GMMS A are shown (Left) and for GMMS B (Middle) and GMMS C (Right). (G) Proportion of BIG phages according to the predicted lifestyle over different age bins. A BIG phage was assigned to a specific age bin based on the time point of its first detection. The numbers above the bars indicate the number of phages per age bin. (H) Proportion of temperate BIG phages over different age bins per infant separately. A BIG phage was assigned to a specific age bin based on the time point of its first detection per infant separately.
Fig. 2.
Fig. 2.
Overview of the accumulation of DaMiV infections in the healthy infant gut. (A) The accumulation over time of the number of unique infections by DaMiVs (on a species level) detected, colored per infant. Black crosses indicate infections for which an enteric sign (diarrhea or vomiting) was detected, within 7 d after the start of that infection. Note that for the calculation of the accumulation of DaMiV infections, reads attributed to live attenuated rotavirus vaccines were disregarded. (B) The number of accumulated infections before and after the start of specific events of interest (day-care entrance, breast milk, formula milk, fruit, vegetables, the first half-year) is shown in the boxplots and statistically compared using the paired Wilcoxon test. Nonsignificant results (P > 0.05) are indicated (ns). The number of accumulated infections before and after day-care entrance was found to be significantly different (paired Wilcoxon test, n = 8 + 8, R2 = 0.892, P = 0.014). The body of the boxplots represents the first and third quartiles of the distribution and the median line. (C) The number of accumulated infections per day (i.e., infection rate) before and after the start of specific events of interest (day-care entrance, breast milk, formula milk, fruit, vegetables, the first half-year) is shown in the boxplots and statistically compared using the paired Wilcoxon test. The infection rate before and after day-care entrance was found to be significantly different (paired Wilcoxon test, n = 8 + 8, R2 = 0.841, P = 0.016). The body of the boxplots represents the first and third quartiles of the distribution and the median line.
Fig. 3.
Fig. 3.
Overview of the detected members of the family Anelloviridae. (A) Phylogenetic distribution (based on the nucleotide alignment of ORF1) of the Anelloviridae contigs identified in this study (red) and 108 RefSeq anelloviruses downloaded from the NCBI (September 2019). Anelloviridae genera are colored as follows: Alphatorquevirus (purple), Betatorquevirus (blue), Gammatorquevirus (green), Gyrovirus (yellow), and unclassified Anneloviridae (gray). (B) Barplot showing the number of Anelloviridae contigs, shared by different infants. (C) Alpha-diversity measure (observed Anelloviridae contig richness) of the samples over the first year of life (Loess smoothing). (D) The accumulation over time of the number of unique Anelloviridae contigs, colored per infant. (E) The number of accumulated unique Anelloviridae contigs before and after the start of specific events of interest (day-care entrance, breast milk, formula milk, fruit, vegetables, first half-year) is shown in the boxplots and statistically compared using the paired Wilcoxon test. The number of accumulated unique Anelloviridae contigs before and after day-care entrance as well as before and after the first half-year was found to be significantly different (paired Wilcoxon test, n = 8 + 8, P < 0.01). The body of the boxplots represents the first and third quartiles of the distribution and the median line. (F) The number of accumulated unique Anelloviridae contigs per day (i.e., accumulation rate) before and after the start of specific events of interest (day-care entrance, breast milk, formula milk, fruit, vegetables, the first half-year) is shown in the boxplots and statistically compared using the paired Wilcoxon test. The number of accumulated unique Anelloviridae contigs per day before and after day-care entrance as well as before and after the first half-year was found to be significantly different (paired Wilcoxon test, n = 8 + 8, P < 0.01). The body of the boxplots represents the first and third quartiles of the distribution and the median line.
Fig. 4.
Fig. 4.
Transkingdom interactions of the BIG phages. (A) Host prediction of BIG phages according to the different in silico prediction methods used (host calling was based on CRISPR spacers, tRNAs, and BLASTn hits). (B) Distribution of the number of BIG phages for which the bacterial host could be predicted at the family level. (C) Examples of GMMS A–specific BIG phages for which the host could be successfully predicted and confirmed. The cooccurrence profiles of the bacteriophage (Bottom) and the bacterial host (Top) are shown over time. (D) Examples of GMMS C–specific BIG phages for which the host could be successfully predicted and confirmed. The cooccurrence profiles of the bacteriophage (Bottom) and the bacterial host (Top) are shown over time.

Similar articles

Cited by

References

    1. Wang B., Yao M., Lv L., Ling Z., Li L., The human microbiota in health and disease. Engineering 3, 71–82 (2017).
    1. Poyet M., et al. , A library of human gut bacterial isolates paired with longitudinal multiomics data enables mechanistic microbiome research. Nat. Med. 25, 1442–1452 (2019). - PubMed
    1. David L. A., et al. , Host lifestyle affects human microbiota on daily timescales. Genome Biol. 15, R89 (2014). - PMC - PubMed
    1. Perez-Muñoz M. E., Arrieta M.-C., Ramer-Tait A. E., Walter J., A critical assessment of the “sterile womb” and “in utero colonization” hypotheses: Implications for research on the pioneer infant microbiome. Microbiome 5, 48 (2017). - PMC - PubMed
    1. Stewart C. J., et al. , Temporal development of the gut microbiome in early childhood from the TEDDY study. Nature 562, 583–588 (2018). - PMC - PubMed

LinkOut - more resources