. 2022 Jun 2;12(6):1462-1481.
doi: 10.1158/2159-8290.CD-21-1117.

Reverse Transcriptase Inhibition Disrupts Repeat Element Life Cycle in Colorectal Cancer

Affiliations

Reverse Transcriptase Inhibition Disrupts Repeat Element Life Cycle in Colorectal Cancer

Mihir Rajurkar et al. Cancer Discov. .

Abstract

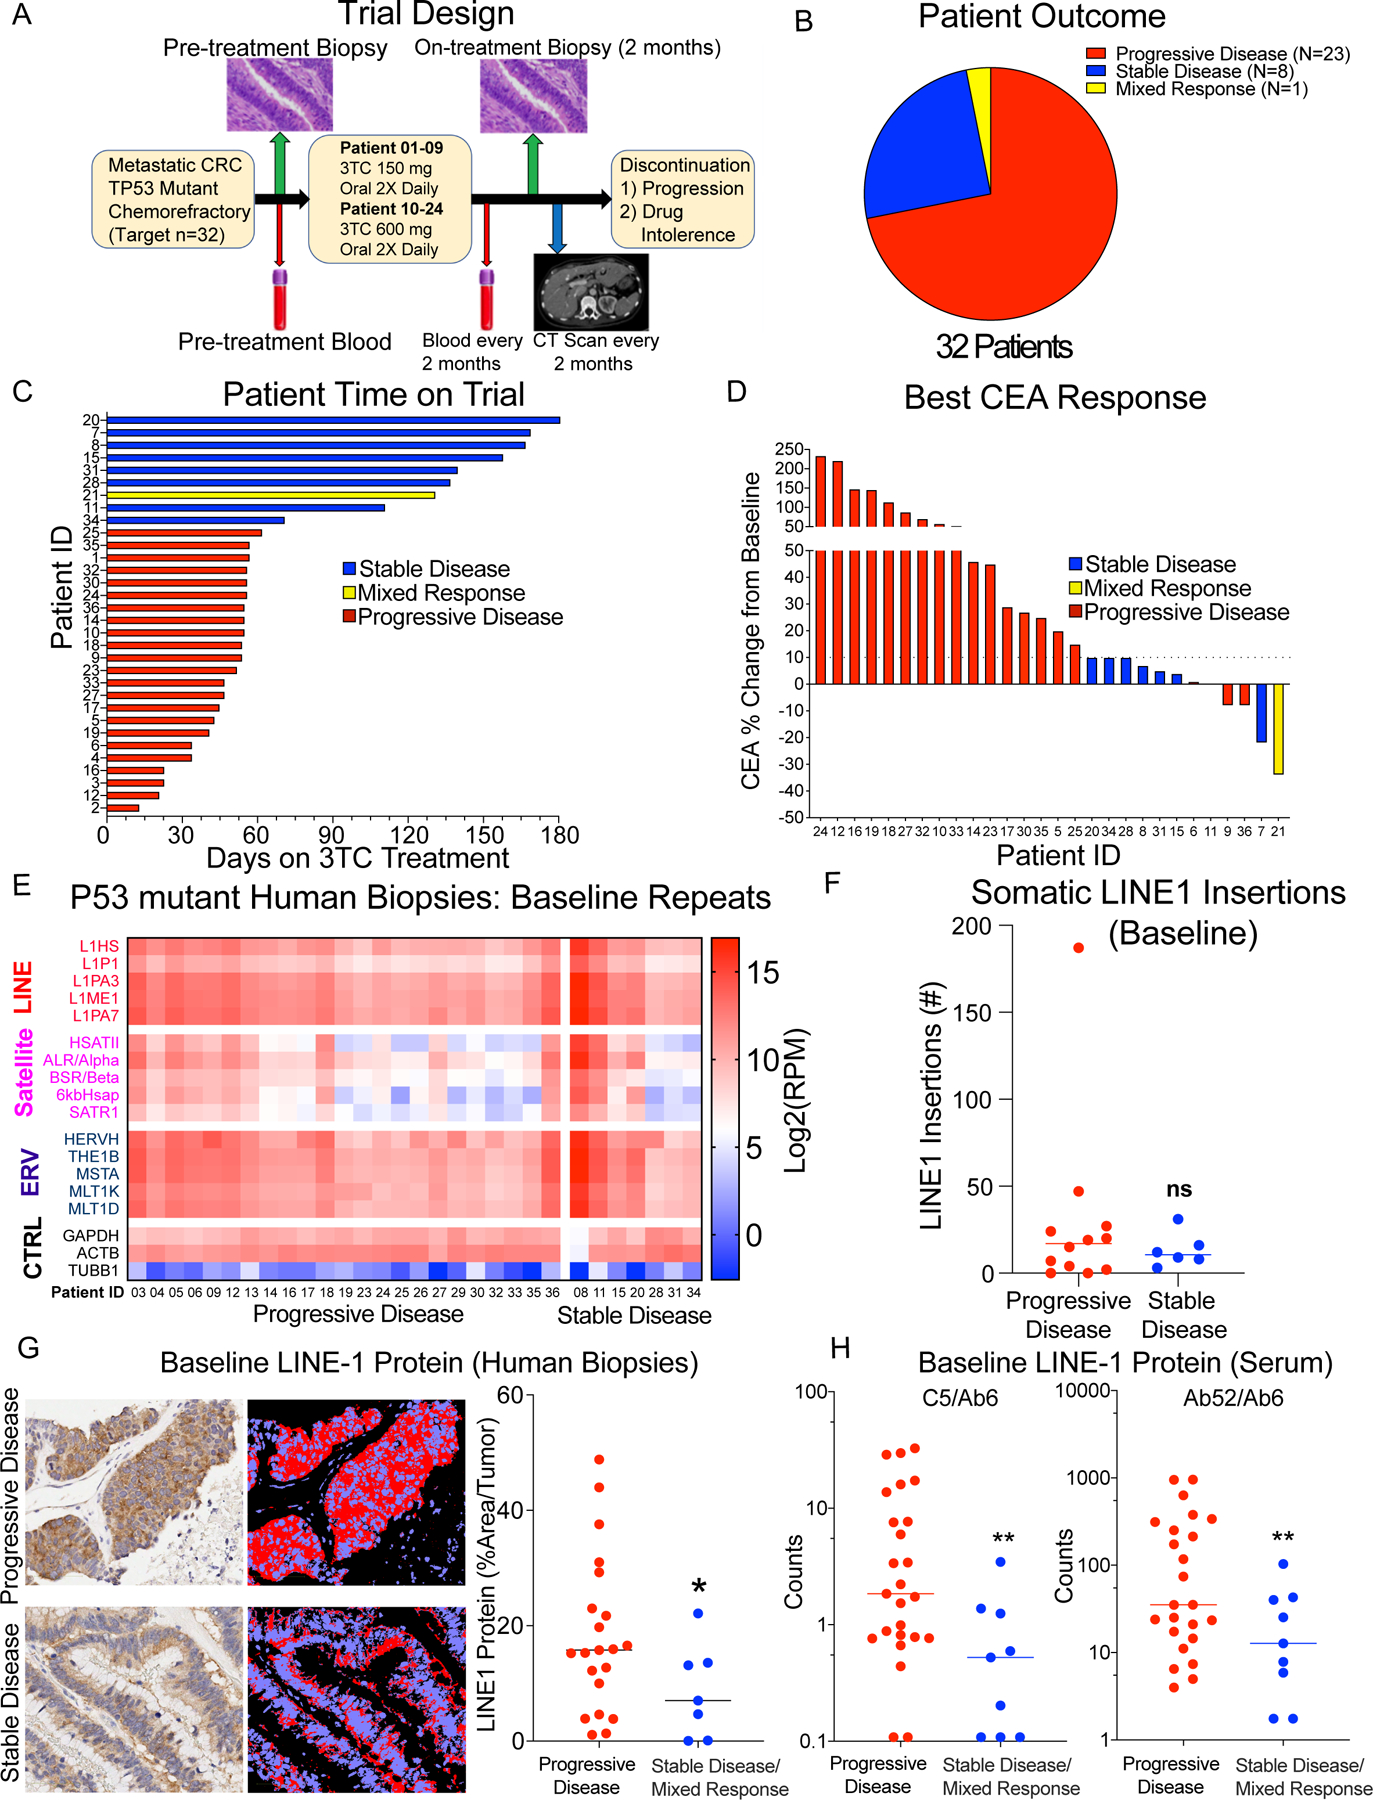
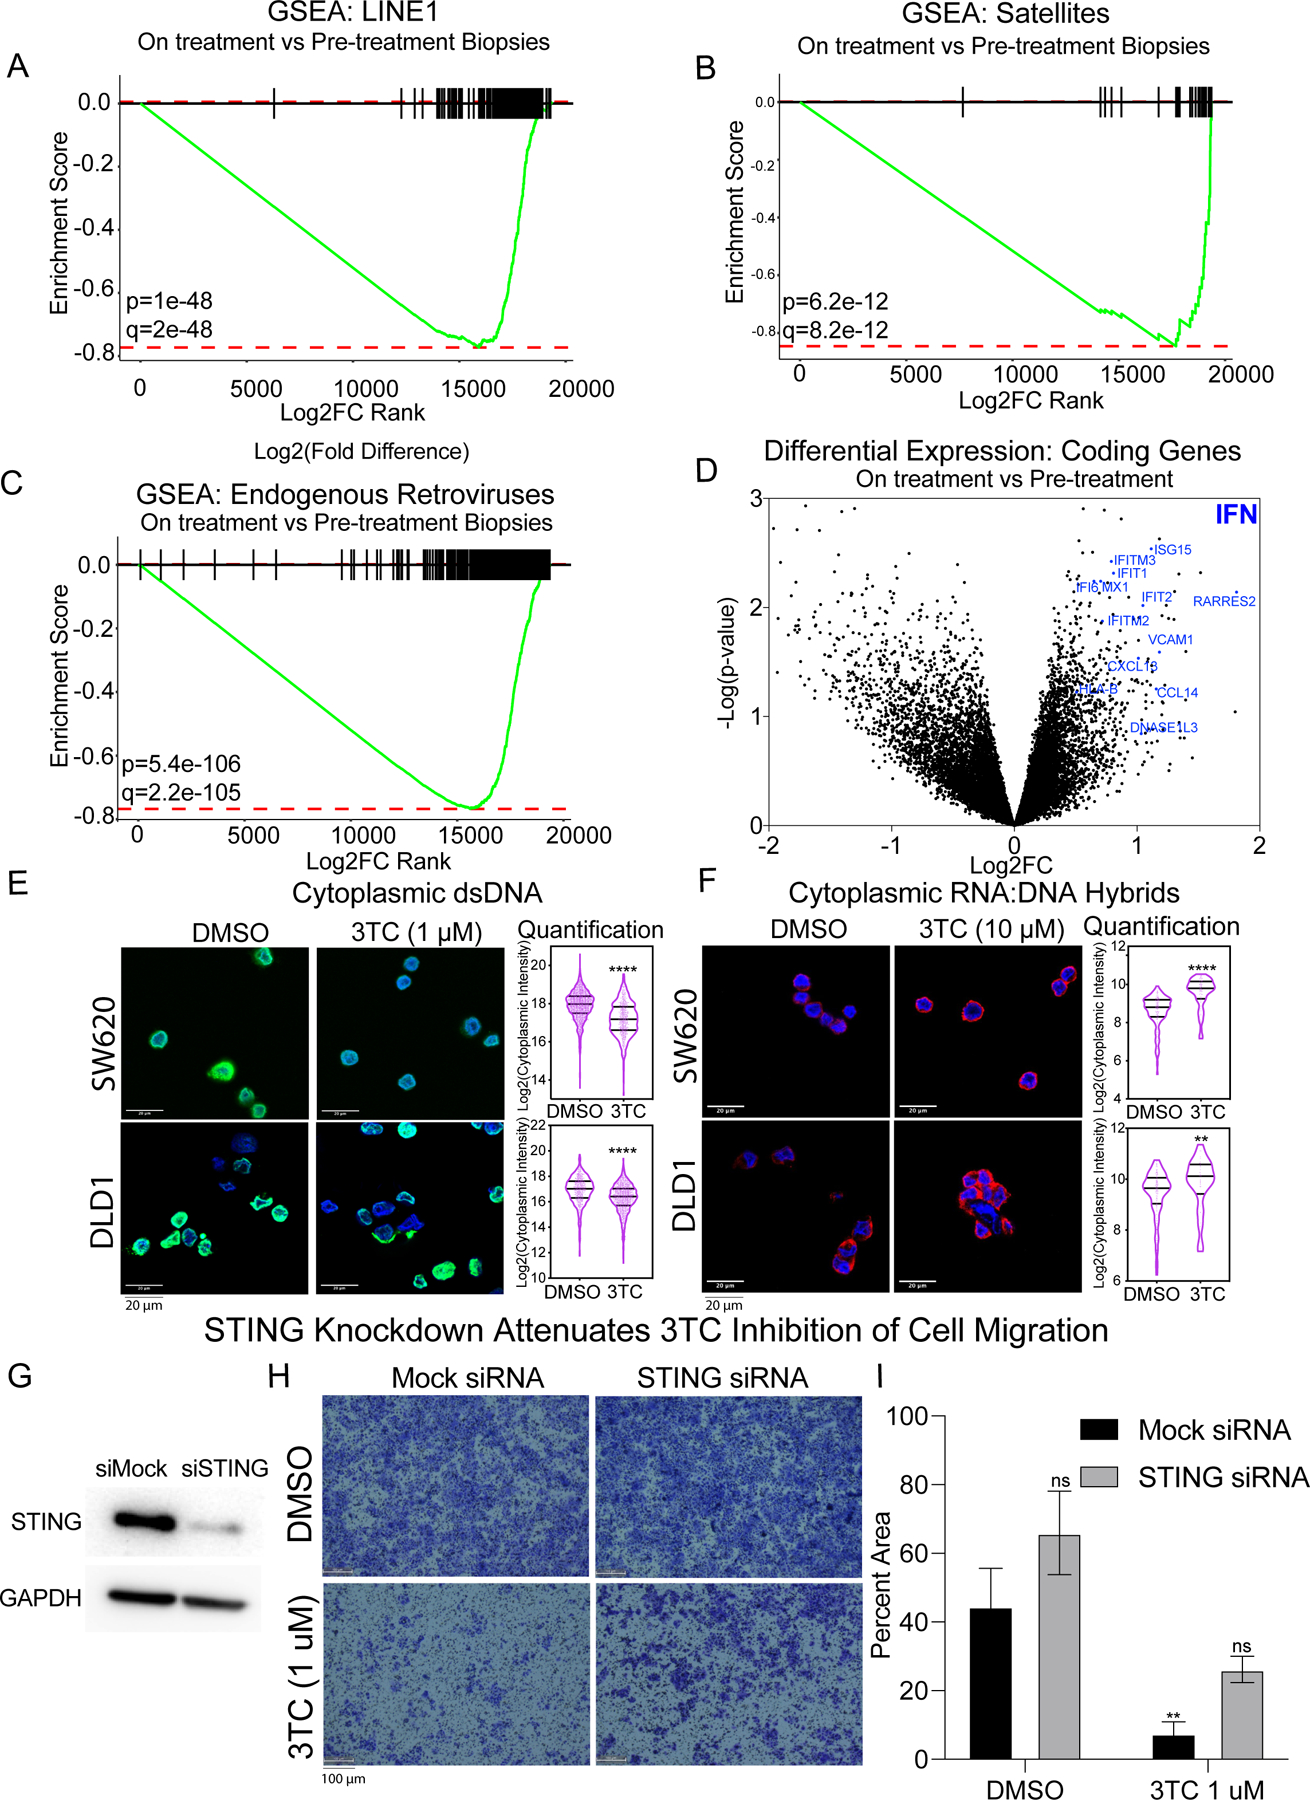
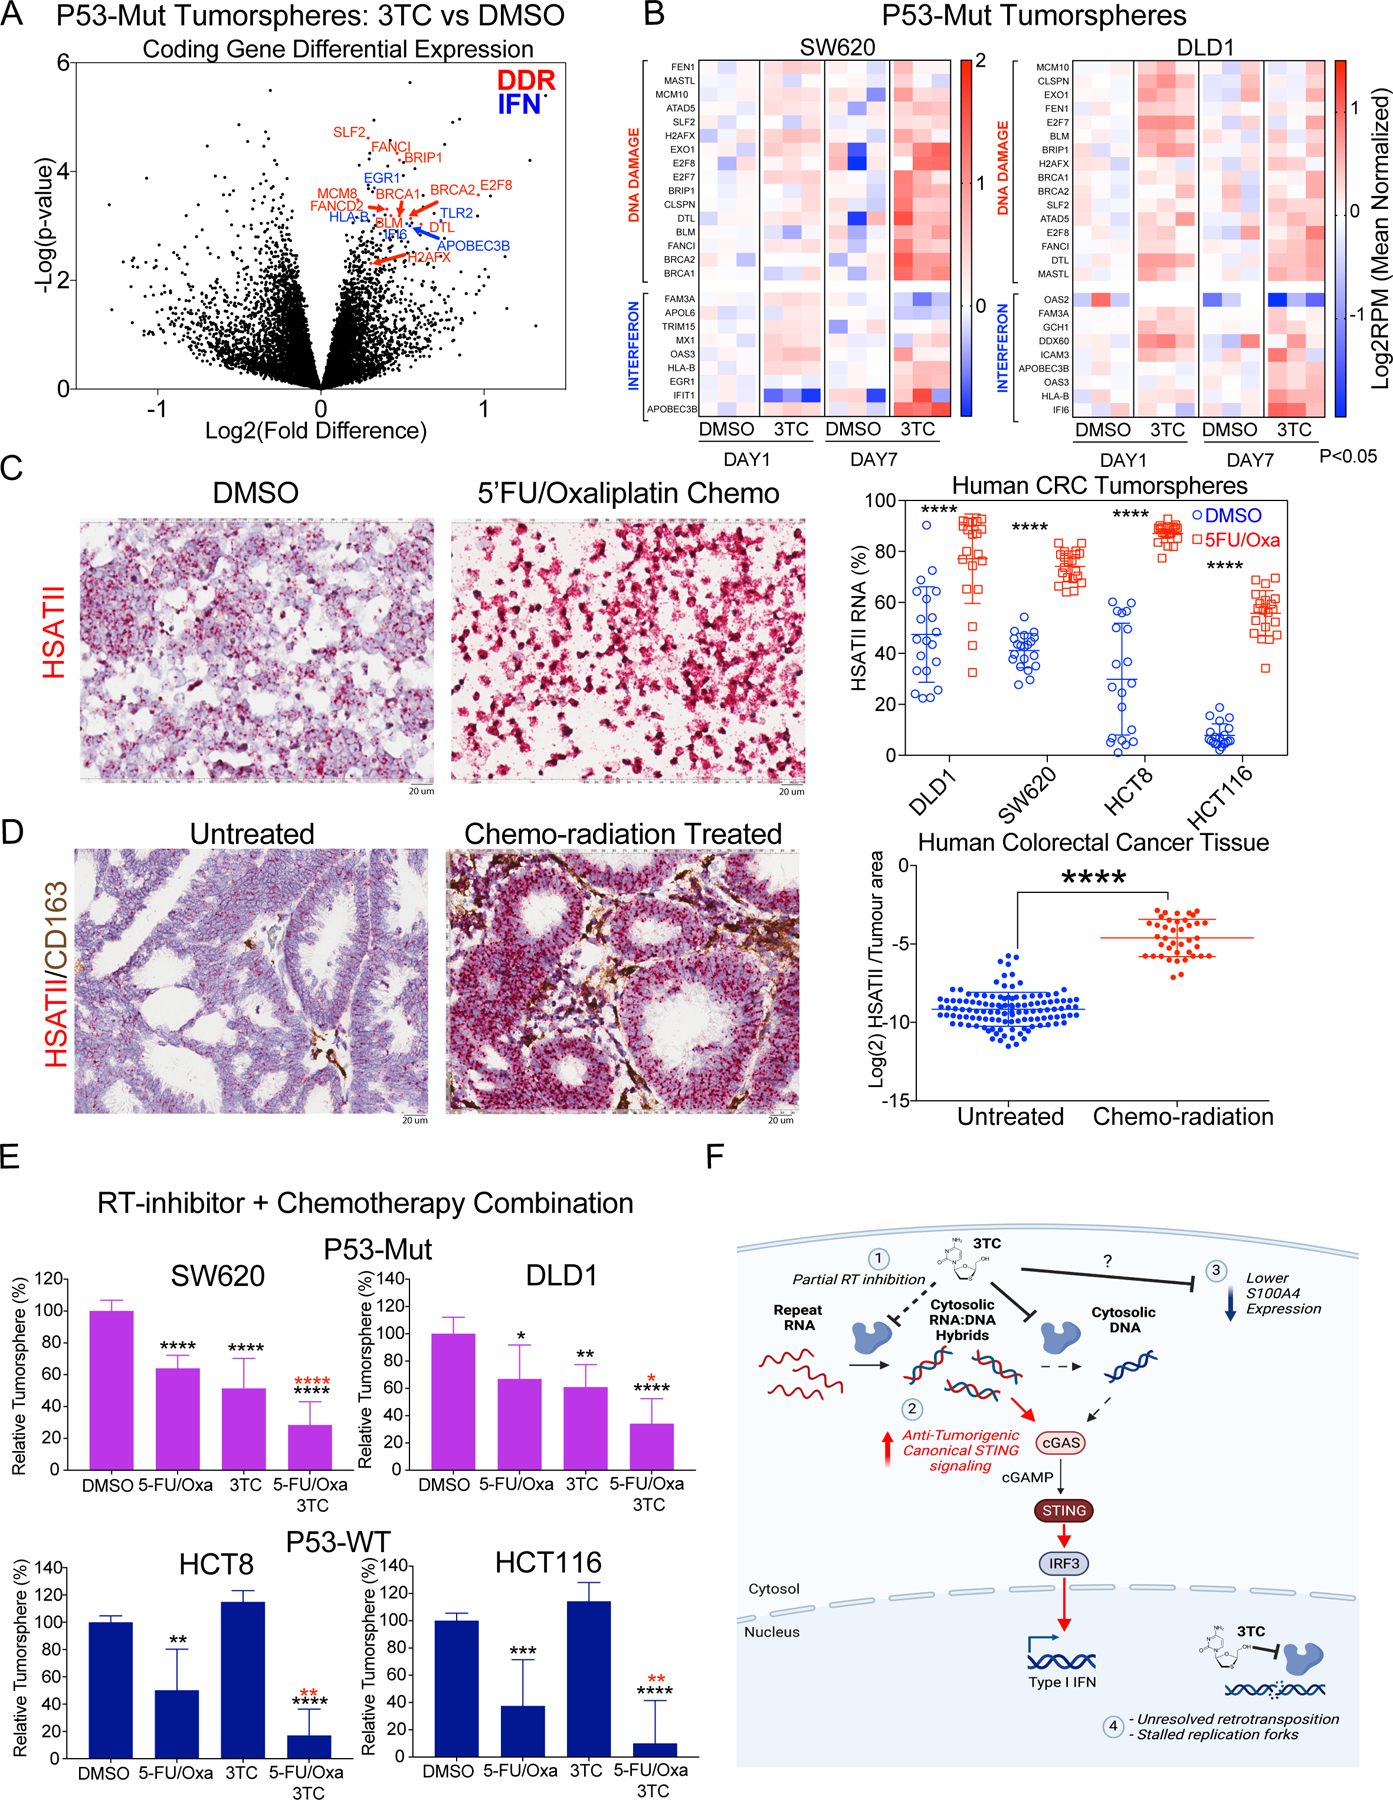
Altered RNA expression of repetitive sequences and retrotransposition are frequently seen in colorectal cancer, implicating a functional importance of repeat activity in cancer progression. We show the nucleoside reverse transcriptase inhibitor 3TC targets activities of these repeat elements in colorectal cancer preclinical models with a preferential effect in p53-mutant cell lines linked with direct binding of p53 to repeat elements. We translate these findings to a human phase II trial of single-agent 3TC treatment in metastatic colorectal cancer with demonstration of clinical benefit in 9 of 32 patients. Analysis of 3TC effects on colorectal cancer tumorspheres demonstrates accumulation of immunogenic RNA:DNA hybrids linked with induction of interferon response genes and DNA damage response. Epigenetic and DNA-damaging agents induce repeat RNAs and have enhanced cytotoxicity with 3TC. These findings identify a vulnerability in colorectal cancer by targeting the viral mimicry of repeat elements.

Significance: Colorectal cancers express abundant repeat elements that have a viral-like life cycle that can be therapeutically targeted with nucleoside reverse transcriptase inhibitors (NRTI) commonly used for viral diseases. NRTIs induce DNA damage and interferon response that provide a new anticancer therapeutic strategy. This article is highlighted in the In This Issue feature, p. 1397.


Conflict of interest statement

Conflict of Interest:

The following authors have filed patents related to targeting repeat RNAs and their use as novel biomarkers (MR, AS, KSA, MNR, VD, BDG, DTT).

DTT and BDG are co-founders, own equity, and receive consulting fees from ROME Therapeutics, a company developing drugs targeting repetitive RNA expressed in cancers and other diseases. This work was not supported by ROME Therapeutics. DTT’s interests were reviewed and are managed by Mass General Brigham in accordance with their conflict of interest policies. Parts of this work was supported by ACD-Biotechne (ASK, VD, MNR, DTT).

DTT has received consulting fees from Tekla Capital Management, Ikena Oncology, NanoString Technologies, Pfizer, Merrimack Pharmaceuticals, Ventana Roche, Foundation Medicine, Inc., and EMD Millipore Sigma, which are not related to this work. DTT is a founder and has equity in PanTher Therapeutics and TellBio, Inc., which are not related to this work.

BDG is a consultant or received honoraria for Darwin Health, Merck, PMV Pharma, ROME Therapeutics, Merck, Bristol–Meyers Squibb, and Chugai Pharmaceuticals and has research funding from Bristol-Meyers Squibb.

ARP is a consultant/advisory board member for Eli Lilly, Natera, Checkmate Pharmaceuticals, Inivata, and Pfizer; holds equity in C2I; serves on the DSMC for Roche; and has research funding from Puretech, PMV Pharmaceuticals, Plexxikon, Takeda, BMS, Novartis, Genentech, Guardant, Array, and Eli Lilly.

MST is a consultant for ROME therapeutics.

JWC is author for McGraw Hill and UpToDate.

LG is a consultant/advisory board member for Alentis, AstraZeneca, Exelixis, and Sirtex, Genentech, Genentech, H3Biomedicine, Incyte, QED Therapeutics, Servier, and Taiho; and has research funding from Adaptimmune, Bayer, Bristol-Myers Squibb, Eisai, Leap Therapeutics, Loxo Oncology, MacroGenics, Merck, Novartis, Nucana, Relay Therapeutics, Genentech, H3Biomedicine, Incyte, QED Therapeutics, Servier, and Taiho.

DPR is a consultant/advisory board member for MPM Capital, Gritstone Oncology, Oncorus, Maverick Therapeutics, 28/7 Therapeutics, Thrive/Exact Sciences; has equity in MPM Capital, Acworth Pharmaceuticals, and Thrive/Exact Sciences; is a legal consultant for Boeringer Ingelheim; and serves as author for Johns Hopkins University Press, UpToDate, McGraw Hill.

RBC is a consultant/advisory board member for Abbvie, Amgen, Array Biopharma/Pfizer, Asana Biosciences, Astex Pharmaceuticals, AstraZeneca, Avidity Biosciences, BMS, C4 Therapeutics, Chugai, Elicio, Erasca, Fog Pharma, Genentech, Guardant Health, Ipsen, Kinnate Biopharma, LOXO, Merrimack, Mirati Therapeutics, Natera, Navire, N-of-one/Qiagen, Novartis, nRichDx, Remix Therapeutics, Revolution Medicines, Roche, Roivant, Shionogi, Shire, Spectrum Pharmaceuticals, Symphogen, Tango Therapeutics, Taiho, Warp Drive Bio, Zikani Therapeutics; holds equity in Avidity Biosciences, C4 Therapeutics, Erasca, Kinnate Biopharma, nRichDx, Remix Therapeutics, and Revolution Medicines; and has research funding from Asana, AstraZeneca, Lilly, Novartis, and Sanofi.

DRW is an inventor of the Simoa technology and a founder, board member, and equity holder of Quanterix Corporation. Interests of DRW have been reviewed and are managed by Brigham and Women’s Hospital and Mass General Brigham in accordance with their policies on competing interests.

KHB has consulted for Rome Therapeutics, Tessera Therapeutics, Transposon Therapeutics, and is the Scientific Co-founder of Oncolinea Pharmaceuticals.

All other authors declare no competing interests.

Figures

Figure 1.
Figure 1.. Reverse transcriptase inhibitor 3TC has preclinical efficacy in colorectal cancer.
A, Schema illustrating experimental procedure for measuring cell migration. B-E, Colon cancer cell line migration data with representative images and quantification of area covered by stained cells in (B, C) P53-Mut and (D, E) P53-WT colon cancer cell lines treated with DMSO or 3TC across 8-μm pore Transwell after 24~72 hr following fixation and staining with crystal violet. Statistical significance calculated by student’s two tailed t-test: * p < 0.05, ** p < 0.01, *** p < 0.001. F-K, Response to 3TC vs DMSO control in soft agar colony assay in (F-H) P53-Mut cell lines SW620 and DLD1 and (I-K) P53-WT cell lines HCT116 and HCT8. (F, I) Representative images of soft agar colonies of SW620 and HCT116 (left) with image quantification markup (right). Scale bar = 2 mm (left), 1 mm (right). Quantification of colony size by digital image analysis shown with violin plot with median and interquartile range in (G-H) P53-Mut cells and (J-K) P53-WT cells treated with DMSO or 3TC at 5 µM and 100 µM. Statistical significance calculated by student’s two tailed t-test: * p < 0.05, ** p < 0.01, *** p < 0.001. L-M, P53-Mut (SW620) and P53-WT (HCT116) CRC xenograft tumors treated with 3TC vs PBS (Control) treatment. Luciferase-expressing (L) SW620 or (M) HCT116 cells were subcutaneously implanted in immunocompromised Nu/Nu mice and grown for 2 weeks after which mice were treated with PBS or 3TC at 50 mg/kg administered by intraperitoneal injection 3 times a week. Tumor luminescence was measured using IVIS imaging every 5 days. Graph represents relative luminescence units (RLU) normalized to Day 0. Significance determined by two-way ANOVA test: **** p < 0.0001.
Figure 2.
Figure 2.. P53 is a direct repressor of Repeat RNA expression.
A, Schematic demonstrating P53-ChIP-seq conducted on colorectal cancer tumorspheres to identify repeatome P53 binding. B, Distribution of significantly enriched repeats (FDR < 0.2) from P53 ChIP-seq in P53-Mut and P53-WT cell lines (SAT = satellite, L1 = LINE-1, ERV = endogenous retrovirus). P53-WT cells show significantly enriched P53 binding to repeat elements compared to P53-Mut cells. Statistical significance is calculated by Chi-squared test. C, Differential expression of repetitive genomic elements measured by RNA-seq of P53-Mut (SW620, DLD1) vs P53-WT (HCT116, HCT8) tumorspheres grown for 14 days represented as volcano plot (y-axis -Log10(p-value) and x-axis Log2(Fold difference)). Highlighted are satellite (SAT), LINE, and ERV repeats. Biological triplicates of RNA-seq were used for each cell line. D, Baseline levels of LINE element RNA L1PA2 (top), and L1HS (bottom) in P53-Mut, and P53-WT cell lines as measured by RNA-seq. Significance determined by student’s two tailed t-test with Welch’s correction calculated pairwise individually for HCT8 and HCT116 cells compared to SW620 and DLD1: * p < 0.05, ** p < 0.01, **** p < 0.0001. Red stars indicate significant difference compared to SW620. Black stars indicate significant difference compared to DLD1. E, HSATII RNA expression in P53-Mut (SW620, DLD1) and P53-WT (HCT8, HCT116) tumorspheres grown for 14 days, measured by RNA in situ hybridization (RNA-ISH). Signal is quantified as percentage of HSATII RNA positive signal per area in tumorspheres across 20 fields. Significance determined by student’s two tailed t-test with Welch’s correction calculated pairwise individually for HCT8 and HCT116 cells compared to SW620 and DLD1: * p < 0.05, ** p < 0.01, **** p < 0.0001. Red stars indicate significant difference compared to SW620. Black stars indicate significant difference compared to DLD1.
Figure 3.
Figure 3.. Phase II clinical trial of Lamivudine (3TC) for colorectal cancer.
A, Schematic of trial of 3TC single agent in P53 mutant CRC with correlative blood, biopsy, and staging scans. B, Representation of patient response to 3TC. 8 out of 32 patients achieved stable disease after treatment, and 1 patient achieved mixed response. C, Swimmer plot of time on 3TC treatment (x-axis days) for 32 patients (y-axis patient ID). D, Best serum Cancer Embryonic Antigen (CEA) response in patients on the clinical trial. Patients with stable disease (SD: blue: 7, 8, 11, 15, 20, 28, 31, 34) had unchanged or decreased serum CEA levels, while most patients with progression (PD: red) had increased CEA. Pt 21 had a mixed response (yellow) with the largest CEA response but had a new metastasis at restaging scans and for grouped with SD for comparative analysis. E, RNA-seq repeat RNA expression of SAT, L1, and ERV and housekeeping genes in pre-treatment biopsy specimens from patients on 3TC trial. Expression shown in Log2(RPM+1). Pre-treatment biopsies have high expression repeats, without significant differences in baseline repeat expression between patients with stable disease and progressive disease. F, Somatic L1 genomic DNA insertions in pre-treatment biopsies. No significant difference is seen in genomic L1 insertions between patients with SD and PD. G, L1 ORF1 protein (L1 ORF1p) expression in pre-treatment biopsy specimens from patients on 3TC trial. Representative image of L1 ORF1p IHC (left) in SD and PD specimen with image analysis markup (right). Quantification shown for each pre-treatment biopsy in 28 patients. Patients with stable disease have significantly lower baseline L1 ORF1p. Significance determined by student’s two tailed t-test with Welch’s correction: * p < 0.05. H, Serum pre-treatment L1 ORF1p levels in patients with progressive disease and stable disease measured with two different antibodies (C5/Ab6 and Ab52/Ab6). Patients with stable disease have significantly lower baseline serum L1 ORF1p. Significance determined by student’s two tailed t-test with Welch’s correction: ** p < 0.01.
Figure 4.
Figure 4.. Reverse transcriptase inhibition leads to decreased cytoplasmic DNA, and increased RNA:DNA hybrid intermediates.
A-C, Gene set enrichment analysis (GSEA) comparing 3TC patient pre-treatment and on treatment biopsy RNA-seq (A) L1, (B) Satellite, and (C) ERV repeats. Repeats were ranked by Log2(Fold Change, on-treatment vs pre-treatment tumor sample) for GSEA. Significant decrease in L1, Satellite, and ERV repeat levels after treatment with 3TC shown in patient biopsies with p value and corrected q value shown (See Supplementary Methods). D, Volcano plot representing differential expression (Log2FC) vs Significance (-LogP) of coding genes in tumor biopsies before treatment, and after treatment with 3TC. Interferon response genes (blue) are significantly upregulated after treatment with 3TC. E, Immunofluorescence (IF) of cytoplasmic dsDNA in P53-Mut tumorspheres treated with DMSO, or 3TC (1 µM) for 7 days. Quantification of cytoplasmic IF signal indicates significant decrease in cytoplasmic dsDNA in response to 3TC. Significance determined by two tailed t-test with Welch’s correction: **** p < 0.0001. F, IF of cytoplasmic RNA:DNA hybrids in P53-Mut tumorspheres treated with DMSO or 3TC (10 µM) for 7 days. Quantification of cytoplasmic IF signal indicates significant increase in cytoplasmic RNA:DNA in response to 3TC. Significance determined by two tailed t-test with Welch’s correction: **** p < 0.0001. G-I, Rescue of effects of 3TC on cell migration by STING knockdown. (G) Western blot analysis confirms knockdown of STING (TMEM173) protein using pooled siRNA compared to non-targeting control in DLD1 cells. (H) Representative images of DLD1 cell migration with siRNA against STING (right) or Mock (left) and treated with DMSO or 3TC. (I) Quantification of DLD1 migrated cells in siRNA STING and 3TC experiments in (H). Statistical significance determined by student’s two tailed t-test as compared to non-targeting control siRNA treated with DMSO: ** p < 0.01.
Figure 5.
Figure 5.. Combination repeatome targeting induces cancer cell death through Necroptosis.
A-B, Efficacy of combination of 9 reverse-transcriptase inhibitors (5 μM) with DNA demethylating agent Azacitidine (AZA) at 300 nM in (A) P53-Mut and (B) P53-WT CRC tumorspheres measured by CellTiter-Glo viability assay after 7 days of treatment. C, Necroptosis pathway inhibition by treatment with RIPK1 inhibitor Necrostatin-1 (Nec-1) at 10 μM attenuates effect of NRTI ddC (5 μM) and DNA demethylating agent AZA (300 nM) as measured by CellTiter-Glo assay after 7 days of treatment. Significance determined by student’s two tailed t-test: * p < 0.05, ** p < 0.01, ***p < 0.001. D, Treatment with antisense locked nucleic acids (LNA) targeting HSATII in P53-Mut cell lines (SW620, DLD1) and P53-WT (HCT8, HCT116) cell lines grown as tumorspheres compared to scrambled LNA, as measured by CellTiter-Glo assay. Significance determined by two way ANOVA test: ** p < 0.01. E, Necroptosis pathway inhibition with Nec-1 (10 μM) rescues effect of anti-HSATII LNA in SW620 tumorspheres. Significance determined by student’s two tailed t-test: *** p < 0.001. F, Schematic showing multiple avenues for repeatome targeting in cancer.
Figure 6.
Figure 6.. Reverse transcriptase inhibition induces DNA damage in colon cancer.
A, Volcano plot of coding gene RNAs with 3TC (5 µM) or DMSO treatment for 7 days in P53-Mut cell lines (DLD1 and SW620; n = 3 for 2 independent experiments per cell line). Highlighted are DNA Damage Response (DDR) and interferon/innate response (IFN) genes B, Tumorsphere RNA-seq expression heatmap of P53-Mut CRC cell lines for DDR and IFN genes at Day 1 and Day 7 post-3TC vs DMSO treatment. Expression is Log2RPM normalized to mean of DMSO per timepoint and cell line. Genes represented have significantly increased expression in response to 3TC at either Day 1, or Day 7, or both (P<0.05 student’s two-tailed t-test). C, HSATII expression in HCT8 tumorspheres grown in the presence of DMSO (control), or 50 μM 5FU + 1.25 μM Oxaliplatin (5FU/Oxa) for 2 weeks. Scale bar = 20 μm. HSATII RNA-ISH in DLD1, SW620, HCT8, and HCT116 tumorspheres treated with DMSO or 5FU/Oxa for 2 weeks. Plots represent HSATII staining as a percentage of tumor area across 20 fields. Significance determined by two tailed t-test with Welch’s correction: **** p < 0.0001. D, HSATII RNA-ISH on human CRC tumors from untreated patients (Left) and patients who received neoadjuvant chemoradiation (Right). Scale bar = 20 μm. HSATII RNA levels quantified as a percentage of tumor area. Significance determined by student’s two tailed t-test with Welch’s correction: **** p < 0.0001. E, Cell viability of CRC tumorspheres treated with either DMSO or 5 μM 3TC for 7 days in the presence of 5FU/Oxa. Significance determined by student’s two tailed t-test: * p < 0.05, ** p < 0.01, *** p < 0.001, **** p < 0.0001. Black stars indicate statistical significance compared to DMSO alone. Red stars indicate statistical significance compared to 5FU/Oxa. F, Schematic of multiple effects of 3TC on colorectal cancer including alterations in cytosolic nucleic acids (1 & 2), S100A4 expression (3), and DNA damage (4).

References

    1. Probst AV, Okamoto I, Casanova M, El Marjou F, Le Baccon P, Almouzni G. A strand-specific burst in transcription of pericentric satellites is required for chromocenter formation and early mouse development. Dev Cell 2010;19(4):625–38 doi 10.1016/j.devcel.2010.09.002. - DOI - PubMed
    1. Kano H, Godoy I, Courtney C, Vetter MR, Gerton GL, Ostertag EM, et al. L1 retrotransposition occurs mainly in embryogenesis and creates somatic mosaicism. Genes Dev 2009;23(11):1303–12 doi 23/11/1303 [pii] 10.1101/gad.1803909. - DOI - PMC - PubMed
    1. Ting DT, Lipson D, Paul S, Brannigan BW, Akhavanfard S, Coffman EJ, et al. Aberrant overexpression of satellite repeats in pancreatic and other epithelial cancers. Science 2011;331(6017):593–6 doi science.1200801 [pii] 10.1126/science.1200801. - DOI - PMC - PubMed
    1. Rooney MS, Shukla SA, Wu CJ, Getz G, Hacohen N. Molecular and genetic properties of tumors associated with local immune cytolytic activity. Cell 2015;160(1–2):48–61 doi 10.1016/j.cell.2014.12.033. - DOI - PMC - PubMed
    1. Zapatka M, Borozan I, Brewer DS, Iskar M, Grundhoff A, Alawi M, et al. The landscape of viral associations in human cancers. Nature genetics 2020;52(3):320–30 doi 10.1038/s41588-019-0558-9. - DOI - PMC - PubMed

Publication types