

Metabolomic changes in Mycobacterium avium subsp. paratuberculosis (MAP) challenged Holstein-Friesian cattle highlight the role of serum amino acids as indicators of immune system activation
- PMID: 35320420
- PMCID: PMC8942901
- DOI: 10.1007/s11306-022-01876-w
Metabolomic changes in Mycobacterium avium subsp. paratuberculosis (MAP) challenged Holstein-Friesian cattle highlight the role of serum amino acids as indicators of immune system activation
Abstract
Introduction: Paratuberculosis, commonly known as Johne's disease, is a chronic granulomatous infection of ruminants caused by Mycobacterium avium subspecies paratuberculosis (MAP). Clinical signs, including reduced milk yields, weight loss and diarrhoea, are typically absent until 2 to 6 years post exposure.
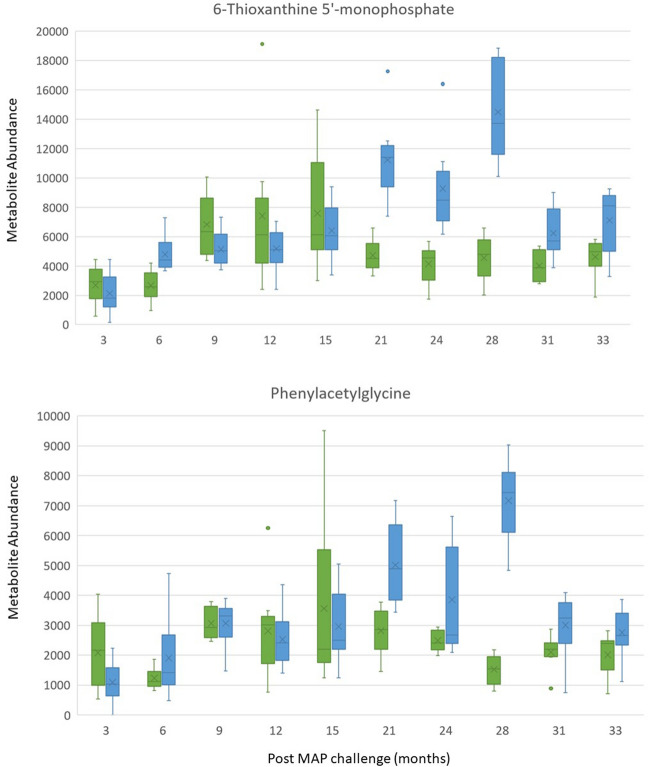
Objectives: To identify metabolomic changes profiles of MAP challenged Holstein-Friesian (HF) cattle and correlate identified metabolites to haematological and immunological parameters.
Methods: At approximately 6 weeks of age, calves (n = 9) were challenged with 3.8 × 10⁹ cells of MAP (clinical isolate CIT003) on 2 consecutive days. Additional unchallenged calves (n = 9) formed the control group. The study used biobanked serum from cattle sampled periodically from 3- to 33-months post challenge. The assessment of sera using flow infusion electrospray high resolution mass spectrometry (FIE-HRMS) for high throughput, sensitive, non-targeted metabolite fingerprinting highlighted differences in metabolite levels between the two groups.
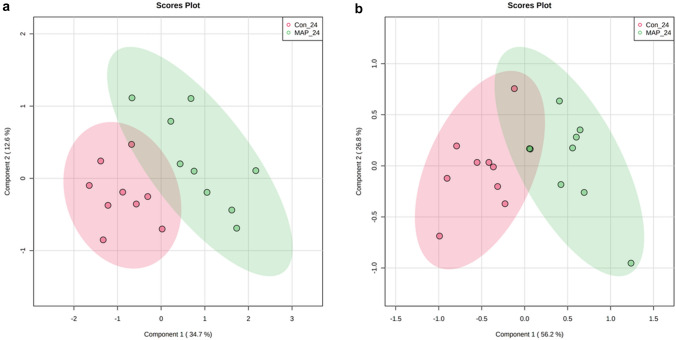
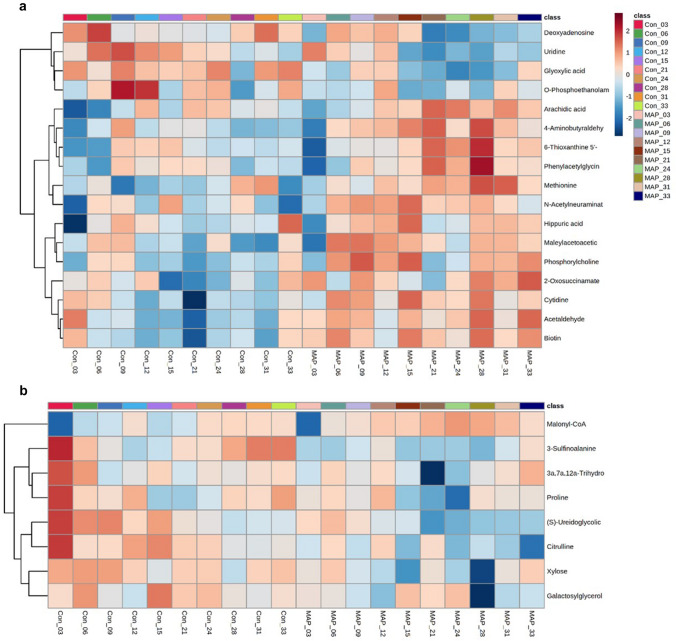
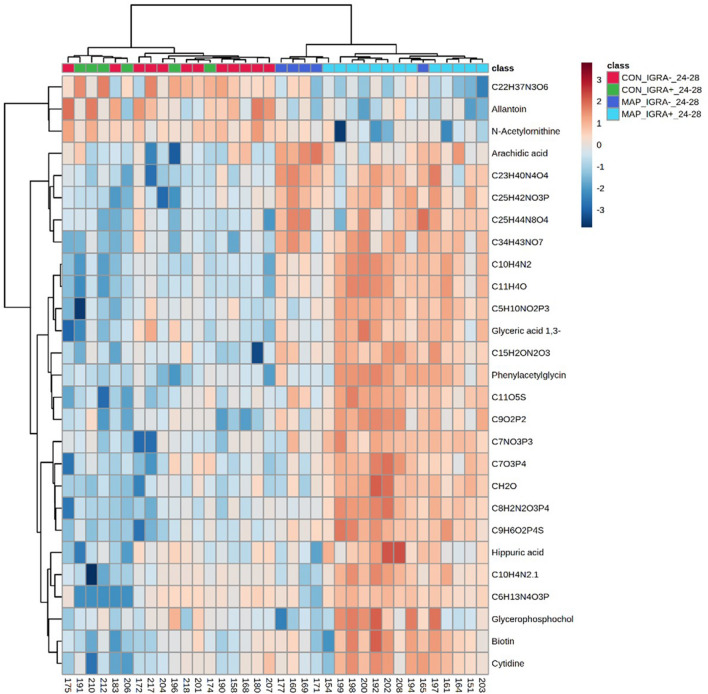
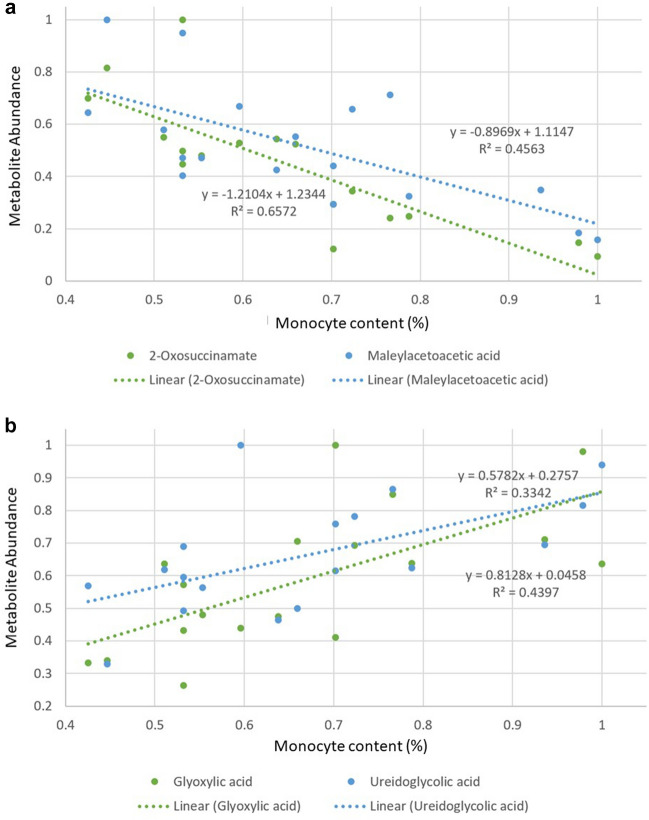
Results: In total, 25 metabolites which were differentially accumulated in MAP challenged cattle were identified, including 20 which displayed correlation to haematology parameters, particularly monocyte levels.
Conclusion: The targeted metabolites suggest shifts in amino acid metabolism that could reflect immune system activation linked to MAP and as well as differences in phosphocholine levels which could reflect activation of the Th1 (tending towards pro-inflammatory) immune response. If verified by future work, selected metabolites could be used as biomarkers to diagnose and manage MAP infected cattle.
Keywords: Amino acids; Haematology; Immune response; Metabolomics; Mycobacterium avium subspecies paratuberculosis.
© 2022. The Author(s).
Conflict of interest statement
Emma N. Taylor, Manfred Beckmann, Bryan K. Markey, Stephen V. Gordon, Glyn Hewinson, David Rooke, Luis A. J. Mur declares that he has no conflict of interest.
Figures
Similar articles
-
Metabolomic changes in polyunsaturated fatty acids and eicosanoids as diagnostic biomarkers in Mycobacterium avium ssp. paratuberculosis (MAP)-inoculated Holstein-Friesian heifers.Vet Res. 2022 Sep 2;53(1):68. doi: 10.1186/s13567-022-01087-0. Vet Res. 2022. PMID: 36056402 Free PMC article.
-
Metabolomic changes in lactating multiparous naturally MAP-infected Holstein-Friesian dairy cows suggest changes in mitochondrial energy pathways.Res Vet Sci. 2022 Dec 20;152:354-363. doi: 10.1016/j.rvsc.2022.09.001. Epub 2022 Sep 8. Res Vet Sci. 2022. PMID: 36108548
-
A long-term bacteriological and immunological study in Holstein-Friesian cattle experimentally infected with Mycobacterium avium subsp. paratuberculosis and necropsy culture results for Holstein-Friesian cattle, Merino sheep and Angora goats.Vet Microbiol. 2007 May 16;122(1-2):83-96. doi: 10.1016/j.vetmic.2006.12.030. Epub 2007 Jan 16. Vet Microbiol. 2007. PMID: 17289303
-
Current perspectives on Mycobacterium avium subsp. paratuberculosis, Johne's disease, and Crohn's disease: a review.Crit Rev Microbiol. 2011 May;37(2):141-56. doi: 10.3109/1040841X.2010.532480. Epub 2011 Jan 22. Crit Rev Microbiol. 2011. PMID: 21254832 Review.
-
Susceptibility to and diagnosis of Mycobacterium avium subspecies paratuberculosis infection in dairy calves: A review.Prev Vet Med. 2015 Oct 1;121(3-4):189-98. doi: 10.1016/j.prevetmed.2015.08.011. Epub 2015 Aug 20. Prev Vet Med. 2015. PMID: 26321657 Review.
Cited by
-
Metabolic signature of Mycobacterium avium subsp. paratuberculosis infected and infectious dairy cattle by integrating nuclear magnetic resonance analysis and blood indices.Front Vet Sci. 2023 Apr 17;10:1146626. doi: 10.3389/fvets.2023.1146626. eCollection 2023. Front Vet Sci. 2023. PMID: 37138915 Free PMC article.
-
Creep Feeding and Weaning Influence the Postnatal Evolution of the Plasma Metabolome in Neonatal Piglets.Metabolites. 2023 Jan 31;13(2):214. doi: 10.3390/metabo13020214. Metabolites. 2023. PMID: 36837833 Free PMC article.
References
-
- Britton, L. E. (2017). The Immunopathology of Mycobacterium avium subspecies paratuberculosis (MAP) Infection in Cattle as a Basis for Novel Diagnostics. [PhD thesis]. [Dublin]: University College Dublin.
Publication types
MeSH terms
Substances
LinkOut - more resources
Full Text Sources
Research Materials
Miscellaneous