

Body Weight-Supported Treadmill Training Ameliorates Motoneuronal Hyperexcitability by Increasing GAD-65/67 and KCC2 Expression via TrkB Signaling in Rats with Incomplete Spinal Cord Injury
- PMID: 35320460
- PMCID: PMC9124175
- DOI: 10.1007/s11064-022-03561-9
Body Weight-Supported Treadmill Training Ameliorates Motoneuronal Hyperexcitability by Increasing GAD-65/67 and KCC2 Expression via TrkB Signaling in Rats with Incomplete Spinal Cord Injury
Abstract
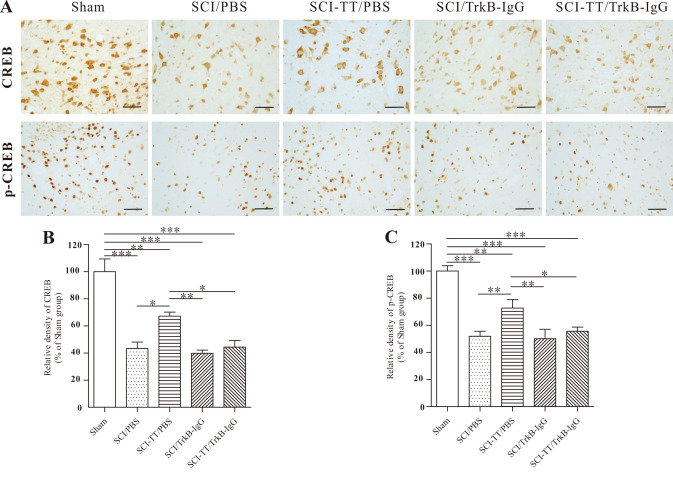
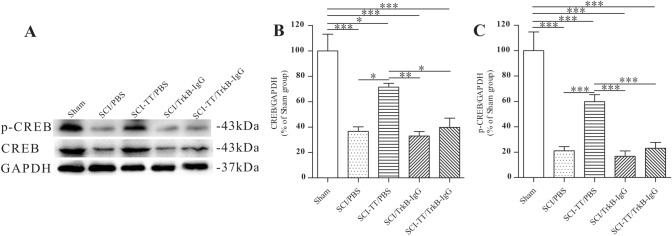
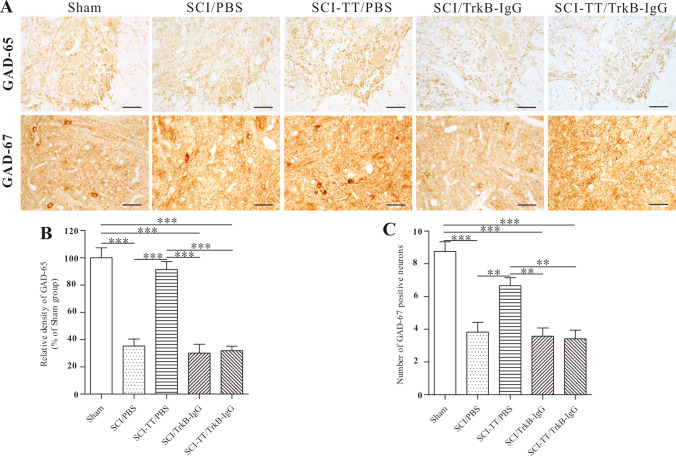
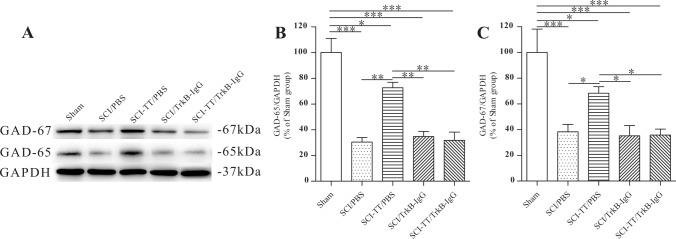
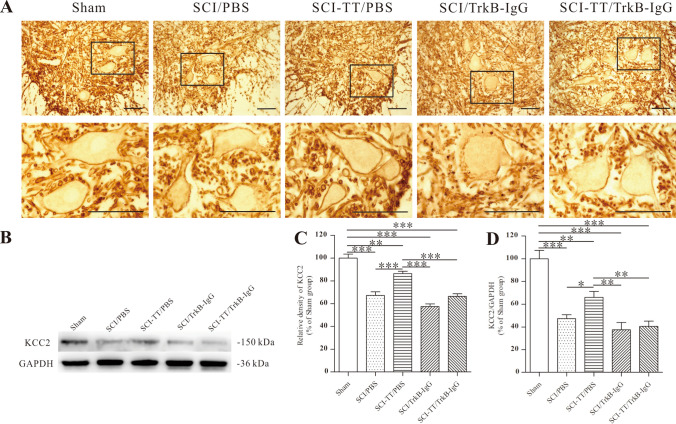
Spasticity is a typical consequence after spinal cord injury (SCI). The critical reasons are reducing the synthesis of Gamma-Aminobutyric Acid (GABA), glycine and potassium chloride co-transporter 2 (KCC2) inside the distal spinal cord. The current work aimed to test whether exercise training could increase the expression of glutamic acid decarboxylase 65/67 (GAD-65/67, the key enzymes in GABA synthesis) and KCC2 in the distal spinal cord via tropomyosin-related kinase B (TrkB) signaling. The experimental rats were randomly assigned to the following five groups: Sham, SCI/phosphate-buffered saline (PBS), SCI-treadmill training (TT)/PBS, SCI/TrkB-IgG, and SCI-TT/TrkB-IgG. After that, the model of T10 contusion SCI was used, then TrkB-IgG was used to prevent TrkB activity at 7 days post-SCI. Body weight-supported treadmill training started on the 8th day post-SCI for four weeks. The Hmax/Mmax ratio and the rate-dependent depression of H-reflex were used to assess the excitability of spinal motoneuronal networks. Western blotting and Immunohistochemistry techniques were utilized for measuring the expression of GAD-65, GAD-67, and KCC2. The findings revealed that exercise training could reduce motoneuronal excitability and boost GAD-65, GAD-67, and KCC2 production in the distal region of the spinal cord after SCI. The effects of exercise training were decreased after the TrkB signaling was inhibited. The present exploration demonstrated that exercise training increases GAD-65, GAD-67, and KCC2 expression in the spinal cord via TrkB signaling and that this method could also improve rats with motoneuronal hyperexcitability and spasticity induced by incomplete SCI.
Keywords: Body-weight supported treadmill training; Glutamic acid decarboxylase 65/67; Potassium chloride co-transporter 2; Spasticity; Spinal cord injury; Tropomyosin-related kinase B.
© 2022. The Author(s).
Conflict of interest statement
The authors declared no potential conflicts of interest for this article's research, authorship, and/or publication.
Figures
Similar articles
-
Exercise training modulates glutamic acid decarboxylase-65/67 expression through TrkB signaling to ameliorate neuropathic pain in rats with spinal cord injury.Mol Pain. 2020 Jan-Dec;16:1744806920924511. doi: 10.1177/1744806920924511. Mol Pain. 2020. PMID: 32418502 Free PMC article.
-
Blocking of BDNF-TrkB signaling inhibits the promotion effect of neurological function recovery after treadmill training in rats with spinal cord injury.Spinal Cord. 2019 Jan;57(1):65-74. doi: 10.1038/s41393-018-0173-0. Epub 2018 Jul 12. Spinal Cord. 2019. PMID: 30002472
-
BDNF Induced by Treadmill Training Contributes to the Suppression of Spasticity and Allodynia After Spinal Cord Injury via Upregulation of KCC2.Neurorehabil Neural Repair. 2015 Aug;29(7):677-89. doi: 10.1177/1545968314562110. Epub 2014 Dec 19. Neurorehabil Neural Repair. 2015. PMID: 25527489
-
Role of the BDNF-TrkB pathway in KCC2 regulation and rehabilitation following neuronal injury: A mini review.Neurochem Int. 2019 Sep;128:32-38. doi: 10.1016/j.neuint.2019.04.003. Epub 2019 Apr 12. Neurochem Int. 2019. PMID: 30986502 Review.
-
Exercise-Induced Plasticity in Signaling Pathways Involved in Motor Recovery after Spinal Cord Injury.Int J Mol Sci. 2021 May 4;22(9):4858. doi: 10.3390/ijms22094858. Int J Mol Sci. 2021. PMID: 34064332 Free PMC article. Review.
Cited by
-
Phenotypes of Motor Deficit and Pain after Experimental Spinal Cord Injury.Bioengineering (Basel). 2022 Jun 20;9(6):262. doi: 10.3390/bioengineering9060262. Bioengineering (Basel). 2022. PMID: 35735505 Free PMC article.
-
Impact of Endurance Training on Regeneration of Axons, Glial Cells, and Inhibitory Neurons after Spinal Cord Injury: A Link between Functional Outcome and Regeneration Potential within the Lesion Site and in Adjacent Spinal Cord Tissue.Int J Mol Sci. 2023 May 11;24(10):8616. doi: 10.3390/ijms24108616. Int J Mol Sci. 2023. PMID: 37239968 Free PMC article.
-
Rate-Dependent Depression of the Hoffmann Reflex: Practical Applications in Painful Diabetic Neuropathy.Diabetes Metab J. 2024 Nov;48(6):1029-1046. doi: 10.4093/dmj.2024.0614. Epub 2024 Nov 21. Diabetes Metab J. 2024. PMID: 39610132 Free PMC article. Review.
-
Continuous Use During Disuse: Mechanisms and Effects of Spontaneous Activity of Unloaded Postural Muscle.Int J Mol Sci. 2024 Nov 20;25(22):12462. doi: 10.3390/ijms252212462. Int J Mol Sci. 2024. PMID: 39596527 Free PMC article. Review.
-
Treadmill running on neuropathic pain: via modulation of neuroinflammation.Front Mol Neurosci. 2024 Jun 26;17:1345864. doi: 10.3389/fnmol.2024.1345864. eCollection 2024. Front Mol Neurosci. 2024. PMID: 38989156 Free PMC article. Review.
References
-
- Field-Fote EC, Furbish CL, Tripp NE, Zanca J, Dyson-Hudson T, Kirshblum S, Heinemann A, Chen D, Felix E, Worobey L, et al. Characterizing the experience of spasticity after spinal cord injury: a national survey project of the spinal cord injury model systems centers. Arch Phys Med Rehab. 2021;S0003–9993:00369–375. - PubMed
MeSH terms
Substances
Grants and funding
LinkOut - more resources
Full Text Sources
Medical
Research Materials
