. 2022 Jul;22(7):1766-1778.
doi: 10.1111/ajt.17038. Epub 2022 Apr 15.

T cell depletion increases humoral response by favoring T follicular helper cells expansion

Affiliations

T cell depletion increases humoral response by favoring T follicular helper cells expansion

Rodrigo Benedetti Gassen et al. Am J Transplant. 2022 Jul.

Abstract

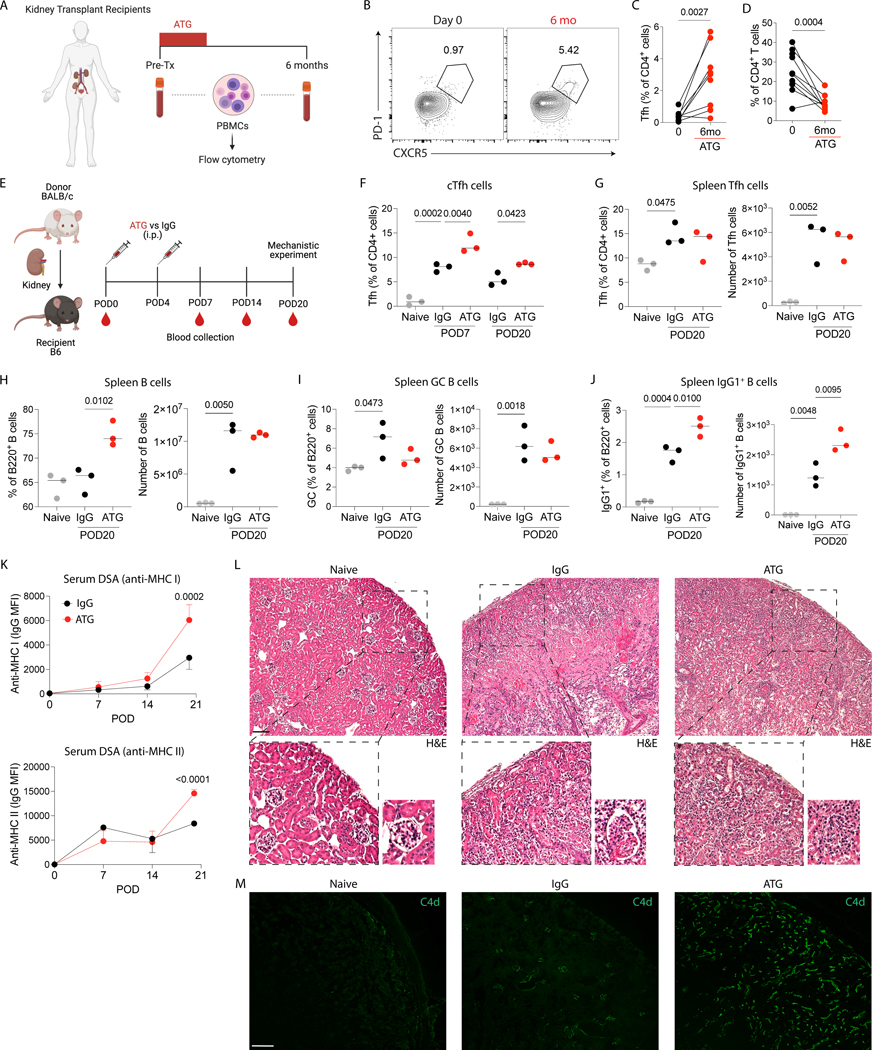
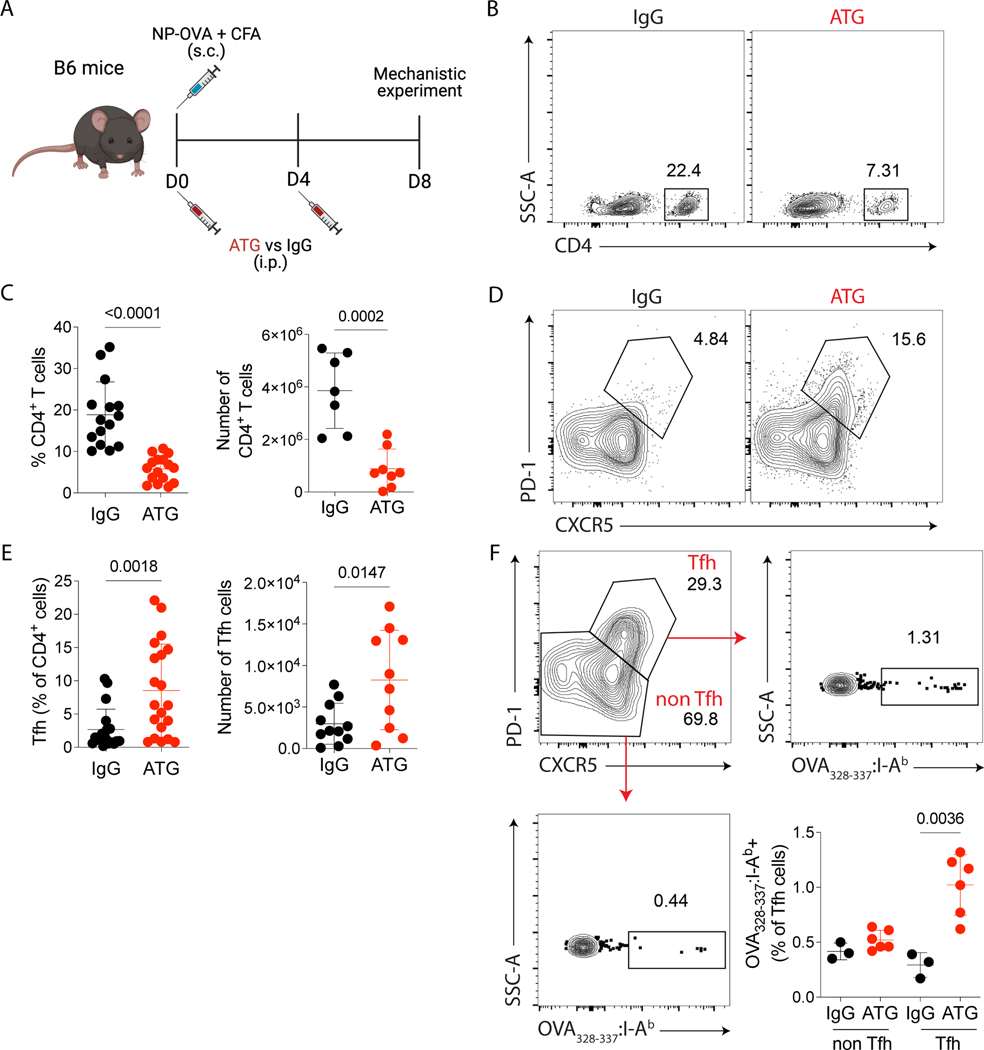
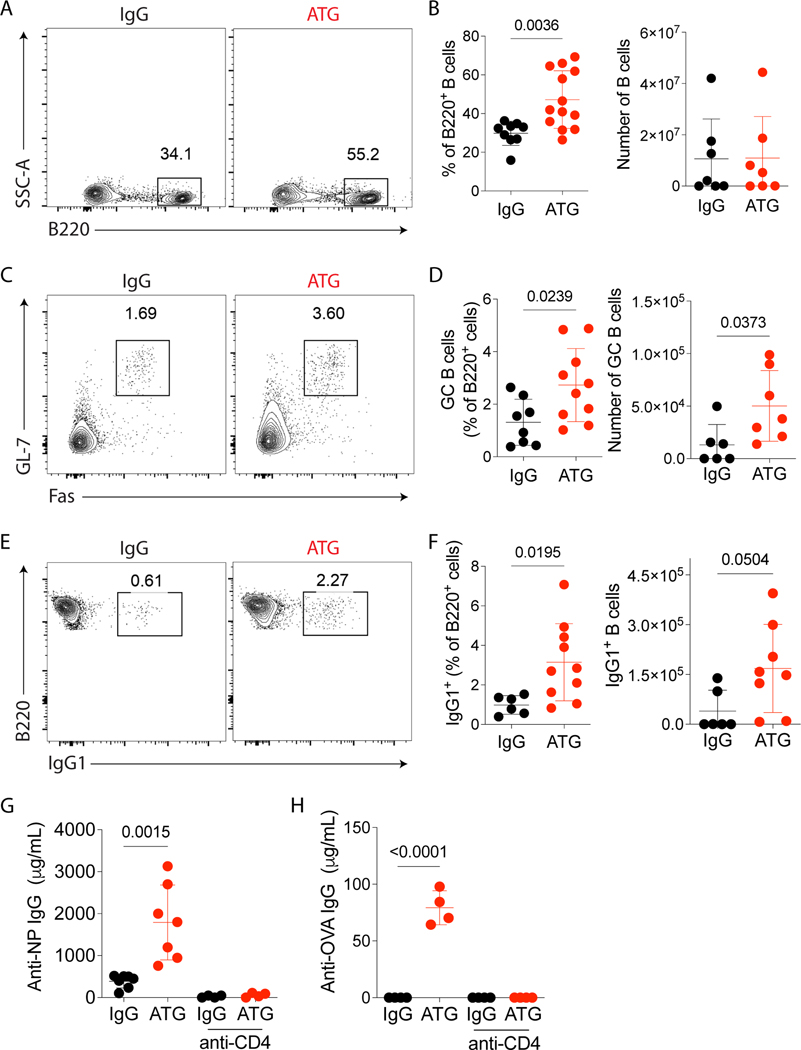
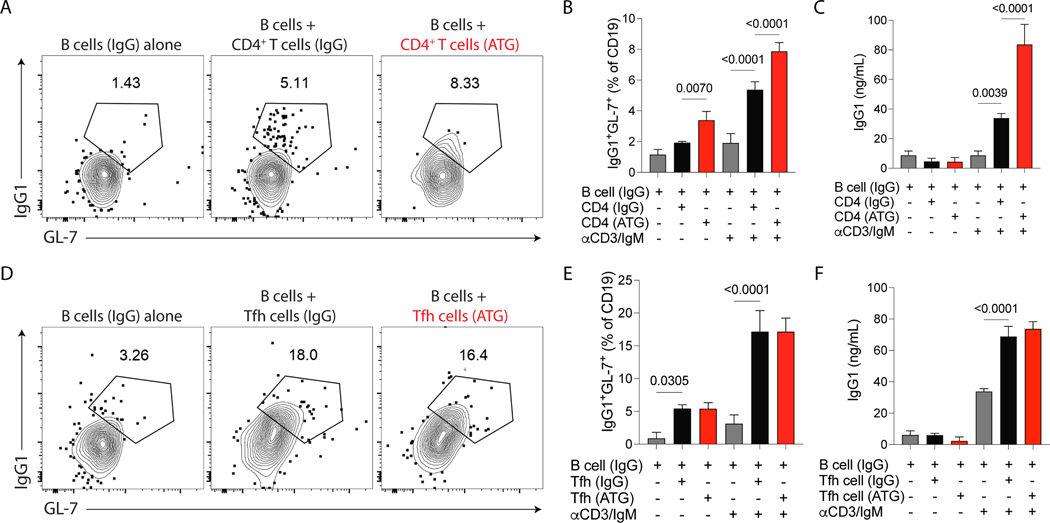
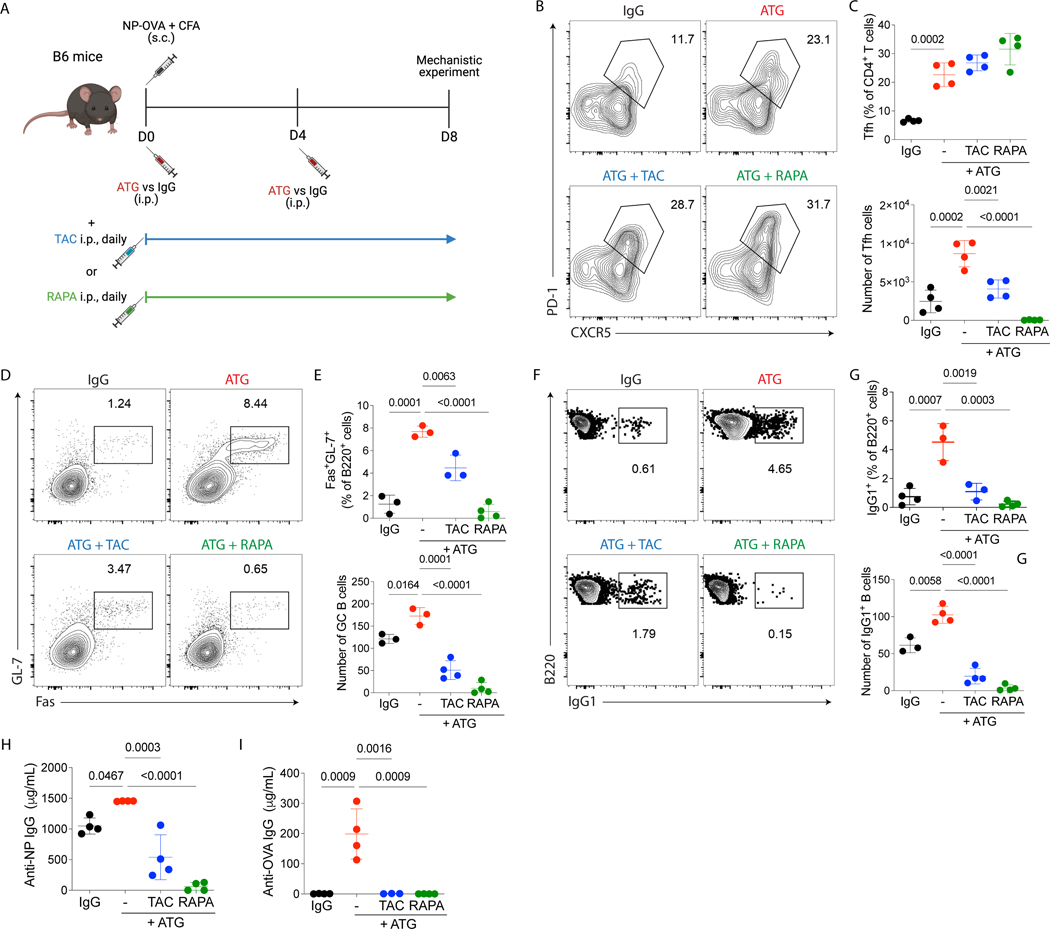
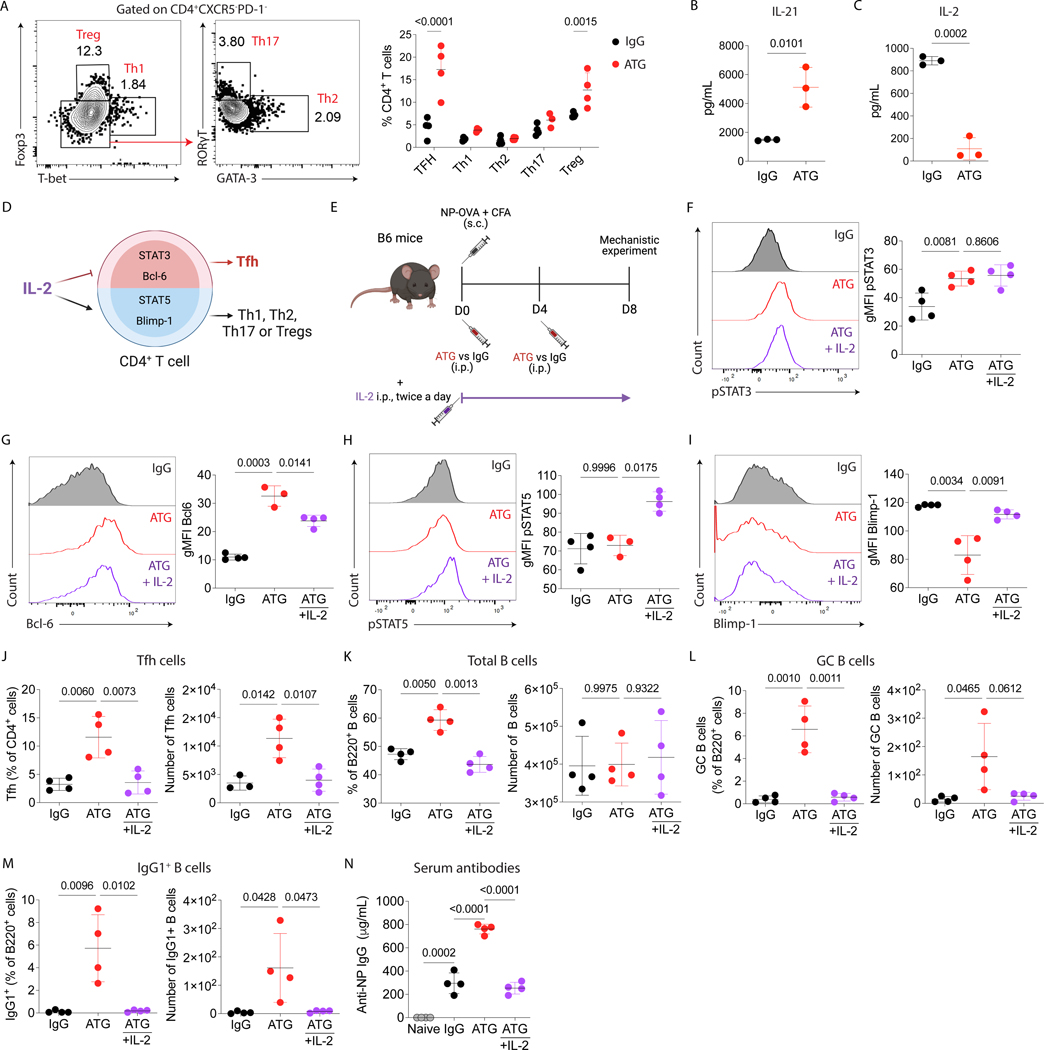
Antibody-mediated rejection is a major cause of long-term graft loss in kidney transplant patients. T follicular helper (Tfh) cells are crucial for assisting B cell differentiation and are required for an efficient antibody response. Anti-thymocyte globulin (ATG) is a widely used lymphocyte-depleting induction therapy. However, less is known about how ATG affects Tfh cell development and donor-specific antibody (DSA) formation. We observed an increase in circulating Tfh cells at 6 months after kidney transplant in patients who received ATG. Using an NP-OVA immunization model, we found that ATG-treated mice had a higher percentage of Tfh cells, germinal center B cells, and higher titers of antigen-specific antibodies compared to controls. ATG-treated animals had lower levels of IL-2, a known Bcl-6 repressor, but higher levels of IL-21, pSTAT3 and Bcl-6, favoring Tfh differentiation. In a mouse kidney transplant model, ATG-treated recipients showed an increase in Tfh cells, DSA and C4d staining in the allograft. Although ATG was effective in depleting T cells, it favored the expansion of Tfh cells following depletion. Concomitant use of IL-2, tacrolimus, or rapamycin with ATG was essential to control Tfh cell expansion. In summary, ATG depletion favors Tfh expansion, enhancing antibody-mediated response.

Keywords: DSA; T cell depletion; anti-thymocyte globulin; antibody-mediated rejection; follicular T helper cells; kidney transplantation.


Figures

Figure 1.
Figure 1.
ATG treatment increases the proportion of Tfh cells in kidney transplant recipients and the alloantibody response in a mouse kidney transplant model. (A) PBMCs from kidney transplant recipients before and six months after kidney transplantation were isolated and characterized by flow cytometry. (B) Representative flow cytometry contour plots, and (C) the frequency of circulating Tfh (CD4+CXCR5+PD-1+) cells and (D) total CD4+ T cells (data from 10 patients; Wilcoxon matched-pairs signed-rank test). (E) BALB/c donor kidneys were transplanted into C57Bl/6 recipients, and the recipients were intraperitoneally treated with 500 μg of murine ATG or IgG control at POD0 and POD4. Mice were euthanized at POD20 after immunization, and blood, graft and spleens were analyzed. Naïve mice were used as additional controls. (F) The frequency of circulating Tfh cells at POD7 and POD20. The frequency and absolute cell number of (G) Tfh cells, (H) total B cells, (I) GC B cells and (J) IgG1+ B cells at POD20 in the spleen. (K) Anti-MHC I and anti-MHC II DSA quantification in the serum over time post-transplantation. (L) Representative H&E and (M) C4d staining in the grafts at POD20. Scale bar, 100 μm. (E-M) Data as mean ± SD are shown (n = 3 per group; statistic by One-Way ANOVA with Tukey multiple comparisons test).
Figure 2.
Figure 2.
ATG treatment induces antigen-specific Tfh cells expansion. (A) C57Bl/6 mice were subcutaneously immunized with NP-OVA + CFA and intraperitoneally treated with 500 μg of murine ATG or IgG control on days 0 and 4. On day 8 after immunization, lymph nodes were analyzed by flow cytometry. (B) Representative flow cytometry contour plots of CD4+ T cells in lymph nodes gated in Dump- live cells. (C) The frequency and absolute cell numbers per lymph node of total CD4+ T cells. (D) Representative flow cytometry contour plots of Tfh (CD4+CXCR5+PD-1+) cells in lymph nodes. (E) The frequency and absolute cell number per lymph node of Tfh (CD4+CXCR5+PD-1+) cells. (F) Representative contour plots of and frequency of OVA323–339-tetramer+ cells in Tfh (CD4+CXCR5+PD-1+) and non-Tfh (CD4+CXCR5- PD-1-) cells. (A-F) Red dots represent the ATG-treated mice, and the black dots represent the IgG-treated mice. Data as mean ± SD are shown (pooled data from three independent experiments, with n = 5 per group; t-test). (C and E) Statistic by t-test. (F) Statistic by Two-way ANOVA with Tukey multiple comparisons test.
Figure 3.
Figure 3.
ATG treatment enhances antibody-specific immune response. C57Bl/6 mice were subcutaneously immunized with NP-OVA + CFA and intraperitoneally treated with 500 μg of murine ATG or IgG control. Mice were euthanized on day 8 after immunization, lymph nodes were analyzed by flow cytometry, as shown in Fig 2A. (A) Representative contour plots of B220+ B cells in lymph nodes gated in Dump-Live cells. (B) The frequency and absolute cell number of B220+ B cells in lymph nodes. (C) Representative contour plots of GC B (B220+GL-7+Fas+) cells in lymph nodes gated in B220+ cells. (D) The frequency and absolute cell number per lymph node of GC B cells. (E) Representative contour plots of B220+ IgG1+ cells in lymph nodes gated in B220+ cells. (F) The frequency and absolute cell number per lymph node of IgG1+ B cells. (G) ELISA quantification of serum NP-specific IgG antibodies and (H) OVA-specific IgG antibodies at day 8 after immunization in controls or ATG-treated mice with subsequent selective depletion of CD4 cells (anti-CD4 depleting antibody). (A-H) Red dots represent the ATG-treated mice, and the black dots represent the IgG-treated mice. Data as mean ± SD are shown (pooled data from three independent experiments, with n = 4–5 per group;). (B, D, and F) Statistic by t-test. (G-H) Statistic by Two-way ANOVA with Tukey multiple comparisons test.
Figure 4.
Figure 4.
Total CD4+ T cells from ATG-treated mice have an increased capacity to induce help to B cells in vitro. C57Bl/6 mice were subcutaneously immunized with NP-OVA + CFA and treated with 500 μg of murine ATG or IgG control. Mice were sacrificed at day 8 after immunization, and B cells, total CD4+ T cells or Tfh cells were sorted from the spleen and cocultured in vitro for 6 days in the presence or not of anti-CD3 and anti-IgM stimulation. (A) Representative contour plots and (B) frequency of IgG1+ GC B cells (B220+GL-7+IgG1+) in B cells cultured with total CD4+ T cells. The IgG1+ GC B cells are gated on CD19+ MHCII+ cells. (C) ELISA quantification of IgG1 antibodies in the supernatant of total CD4+ T cells cultured with B cells. (D) Representative contour plots and (E) frequency of IgG1+ GC B cells (B220+GL-7+IgG1+) in B cells cultured with total Tfh cells. The IgG1+ GC B cells are gated on CD19+ MHCII+ cells. (F) ELISA quantification of IgG1 antibodies in the supernatant of Tfh cells cultured with B cells. (A-F) All the B cells were from IgG-treated animals. Grey bars represent B cells alone, the black bars represent B cells coculture with CD4+ T cells or Tfh cells from IgG-treated mice, and the red bars represent B cells coculture with CD4+ T cells or Tfh cells from ATG-treated mice. Data as mean ± SD are shown (pooled data from three independent experiments; One-way ANOVA with Tukey multiple comparisons test).
Figure 5.
Figure 5.
ATG combinations with tacrolimus or rapamycin control humoral response induced by ATG treatment alone. (A) C57Bl/6 mice were subcutaneously immunized with NP-OVA + CFA and treated with 500μg of murine ATG or IgG control. A subgroup then received either 1 mg/Kg of tacrolimus or 0.5 mg/Kg of rapamycin, intraperitoneally, daily. Mice were euthanized at day 8 after immunization, and serum and lymph nodes were analyzed, as shown in Fig 2A. (B) Representative contour plots of Tfh (CD4+CXCR5+ PD-1+) cells in lymph nodes gated in CD4+ cells. (C) The frequency and absolute cell number per lymph node of Tfh cells. (D) Representative contour plots of GC B (B220+GL-7+ Fas+) cells in lymph nodes gated in B220+ cells. (E) The frequency and absolute cell number per lymph node of GC B cells. (F) Representative contour plots of B220+ IgG1+ cells in lymph nodes gated in B220+ cells. (G) The frequency and absolute cell number per lymph node of IgG1+ B cells. ELISA quantification of serum (H) NP-specific and (I) OVA-Specific IgG antibodies at day 8 after immunization. (A-I) Red dots represent the ATG-treated mice, black dots represent the IgG-treated mice, blue dots represent the ATG + tacrolimus-treated mice, and green dots represent the ATG + rapamycin-treated mice. Data as mean ± SD are shown (data from three independent experiments; with n = 4 per group; One-way ANOVA with Tukey multiple comparisons test).
Figure 6.
Figure 6.
IL-2 signaling inhibits ATG-mediated humoral response. Using the NP-OVA + CFA immunization with either IgG or ATG treatment as shown in Fig 1D, we determined (A) the frequency of Tfh (CD4+CXCR5+PD-1+), Th1 (CD4+CXCR5-PD-1-FOXP3-Tbet+), Th2 (CD4+CXCR5-PD-1-FOXP3-Tbet-Gata3+), Th17 (CD4+CXCR5-PD-1-FOXP3-Tbet-RORyT+), and Treg (CD4+CXCR5- PD-1-FOXP3+ Tbet-) cells at day 8 after NP-OVA + CFA immunization in lymph nodes, (B) serum IL-21 levels after 48 hours of immunization with NP-OVA+CFA, and the (C) serum IL-2 levels after 6 hours of immunization with NP-OVA + CFA with IgG or ATG treatment. (D) Cartoon of the IL-2 signaling pathway in CD4+ T cell differentiation. (E) C57Bl/6 mice were subcutaneously immunized with NP-OVA+CFA and treated with 500 μg of murine ATG or IgG control. A subgroup then received ATG and 30,000 U of recombinant mouse IL-2, intraperitoneally, twice a day. Mice were euthanized at day 8 after immunization, and serum and lymph nodes were analyzed, as shown in Fig 2A. Quantification of the geometric mean fluorescence intensity (gMFI) of (F) pSTAT3, (G) Bcl6, (H) pSTAT5, and (I) Blimp-1 in CD4+ T cells from draining lymph nodes. Red histograms and red dots represent the ATG-treated mice, black histogram and dots represent the IgG-treated mice, and the purple histograms and dots represent the ATG-treated mice that received IL-2. The frequency and absolute cell number of (J) Tfh cells, (K) total B cells, (L) GC B cells, and (M) IgG1+ B cells in the draining lymph node. (N) ELISA quantification of serum NP-specific IgG antibodies at day 8 after immunization. Naïve mice were used as additional controls. Data as mean ± SD are shown (n = 4 per group; One-way ANOVA with Tukey multiple comparisons test).

Similar articles

Cited by

References

    1. Halloran PF et al. Disappearance of T cell-mediated rejection despite continued antibody-mediated rejection in late kidney transplant recipients. J. Am. Soc. Nephrol 26, 1711–1720 (2015). - PMC - PubMed
    1. Sellarés J et al. Understanding the causes of kidney transplant failure: The dominant role of antibody-mediated rejection and nonadherence. Am. J. Transplant 12, 388–399 (2012). - PubMed
    1. Böhmig GA, Eskandary F, Doberer K & Halloran PF The therapeutic challenge of late antibody-mediated kidney allograft rejection. Transpl. Int 32, 775–788 (2019). - PMC - PubMed
    1. Sage PT & Sharpe AH T Follicular Regulatory Cells in the Regulation of B cell Responses. Trends Immunol. 1–9 (2015) doi:10.1016/j.it.2015.05.005. - DOI - PMC - PubMed
    1. Cano-Romero FL et al. Longitudinal profile of circulating T follicular helper lymphocytes parallels anti-HLA sensitization in renal transplant recipients. Am. J. Transplant 19, 89–97 (2019). - PubMed

Publication types