. 2022 Jun 14;55(6):1013-1031.e7.
doi: 10.1016/j.immuni.2022.03.004. Epub 2022 Mar 22.

Single-cell multiomics reveals persistence of HIV-1 in expanded cytotoxic T cell clones

Affiliations

Single-cell multiomics reveals persistence of HIV-1 in expanded cytotoxic T cell clones

Jack A Collora et al. Immunity. .

Abstract

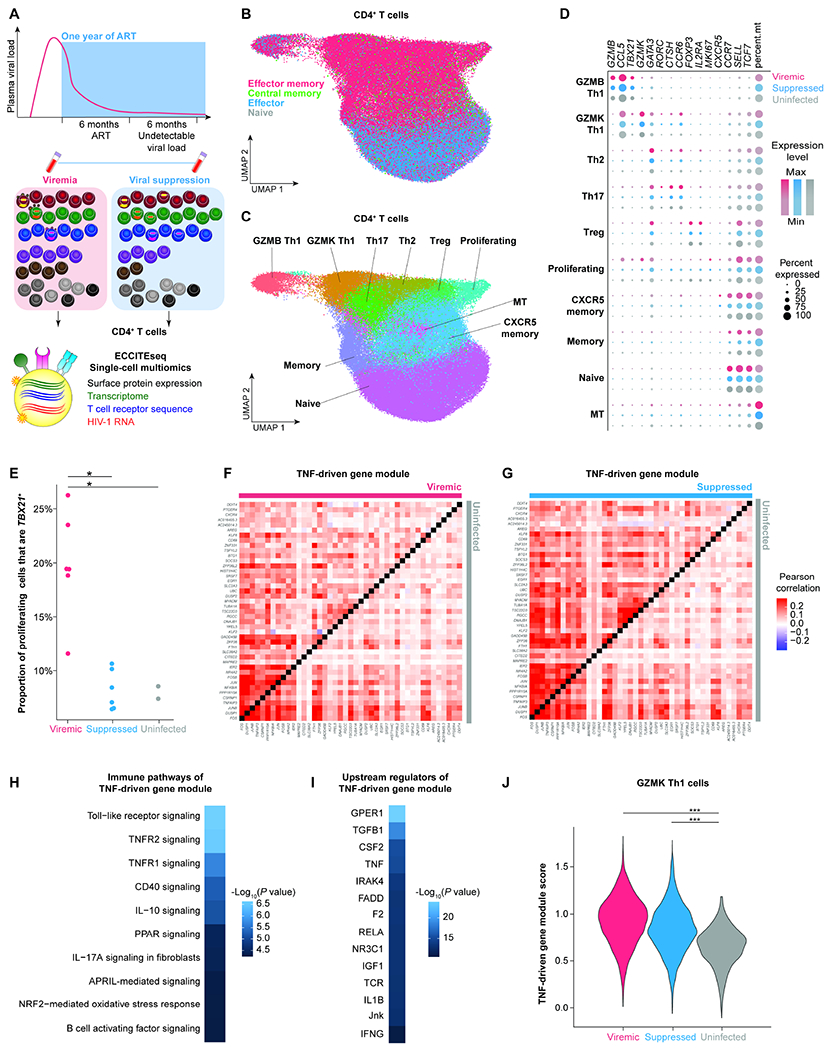
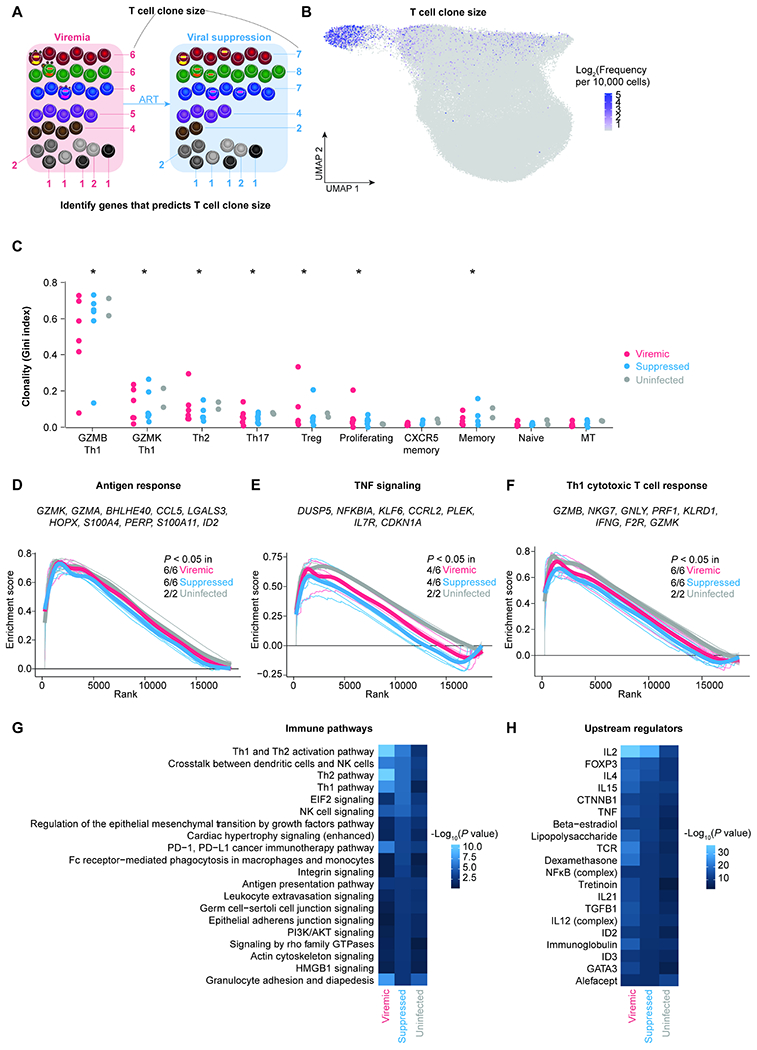
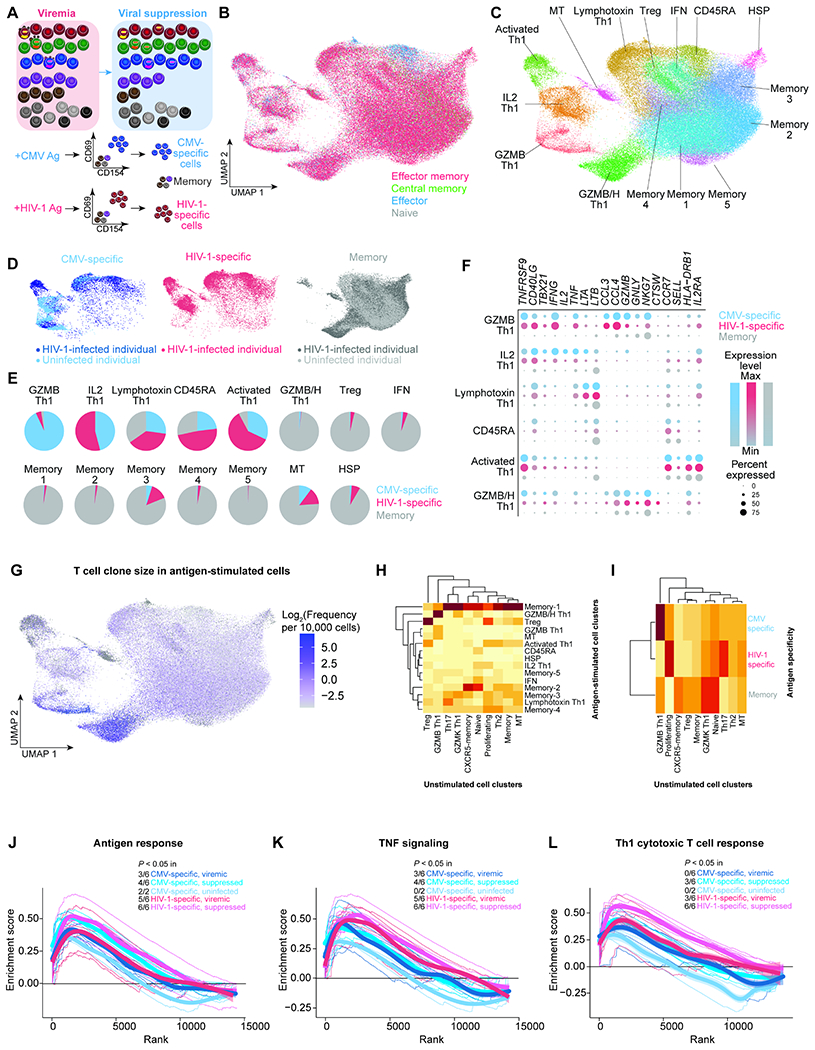
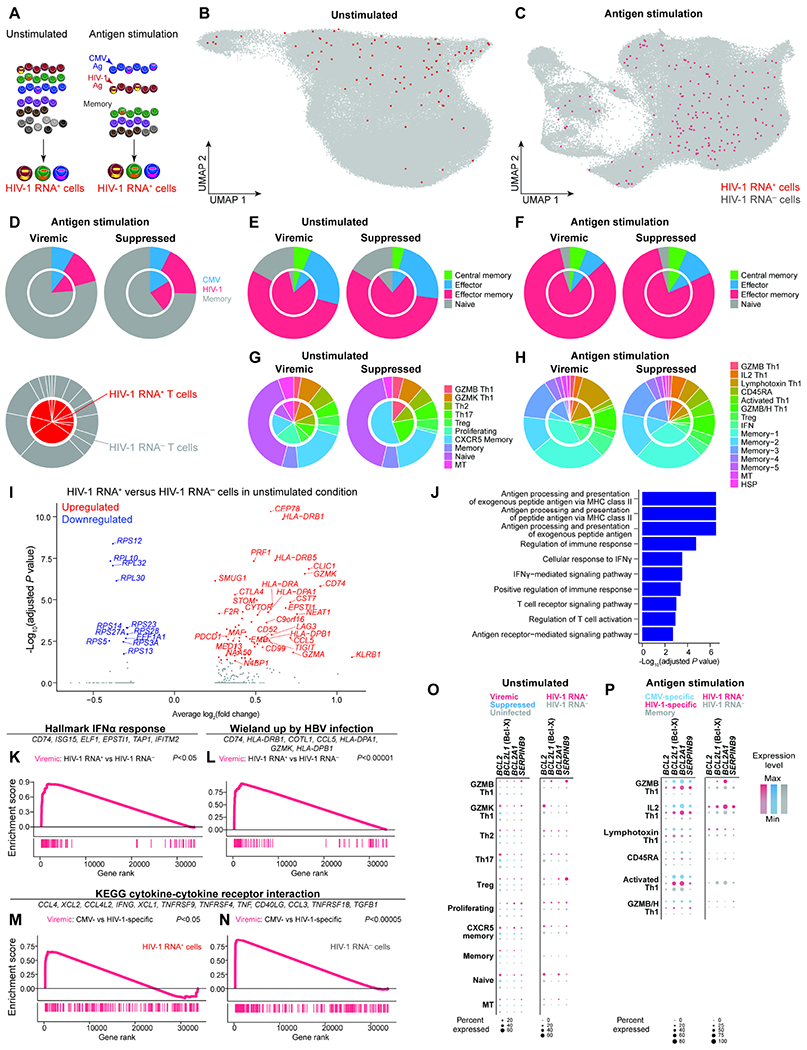
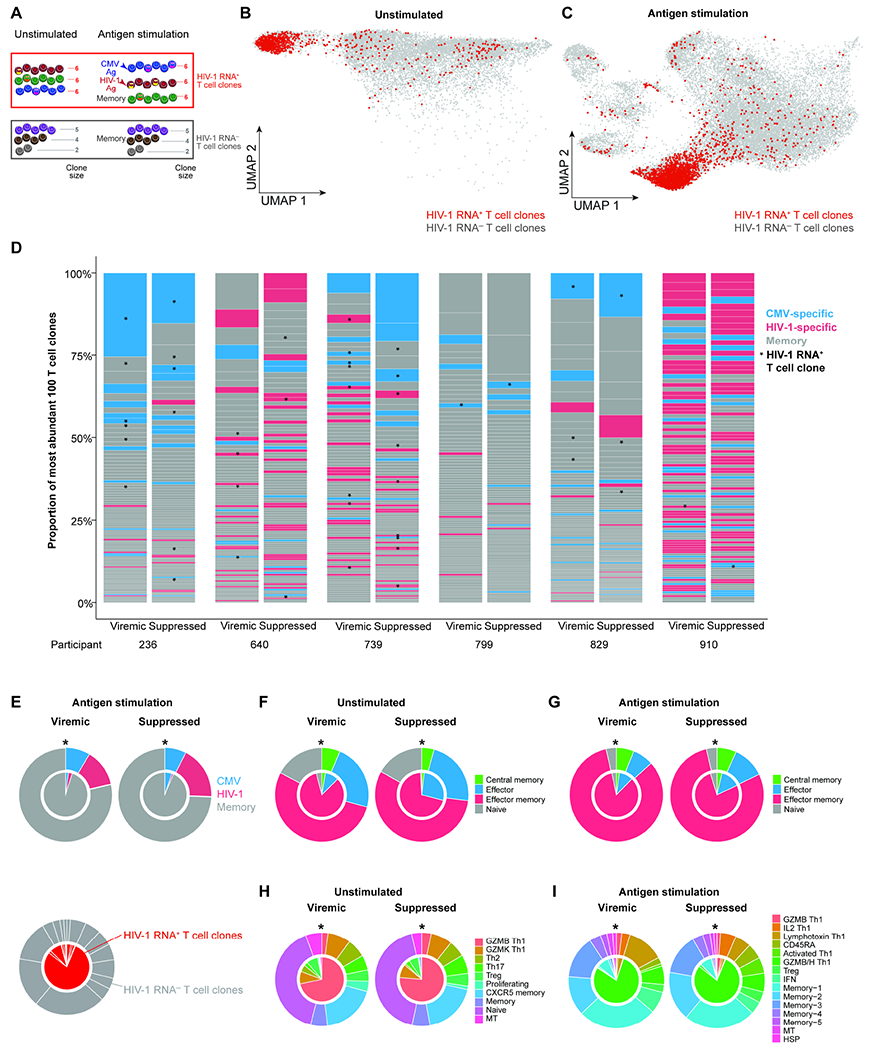
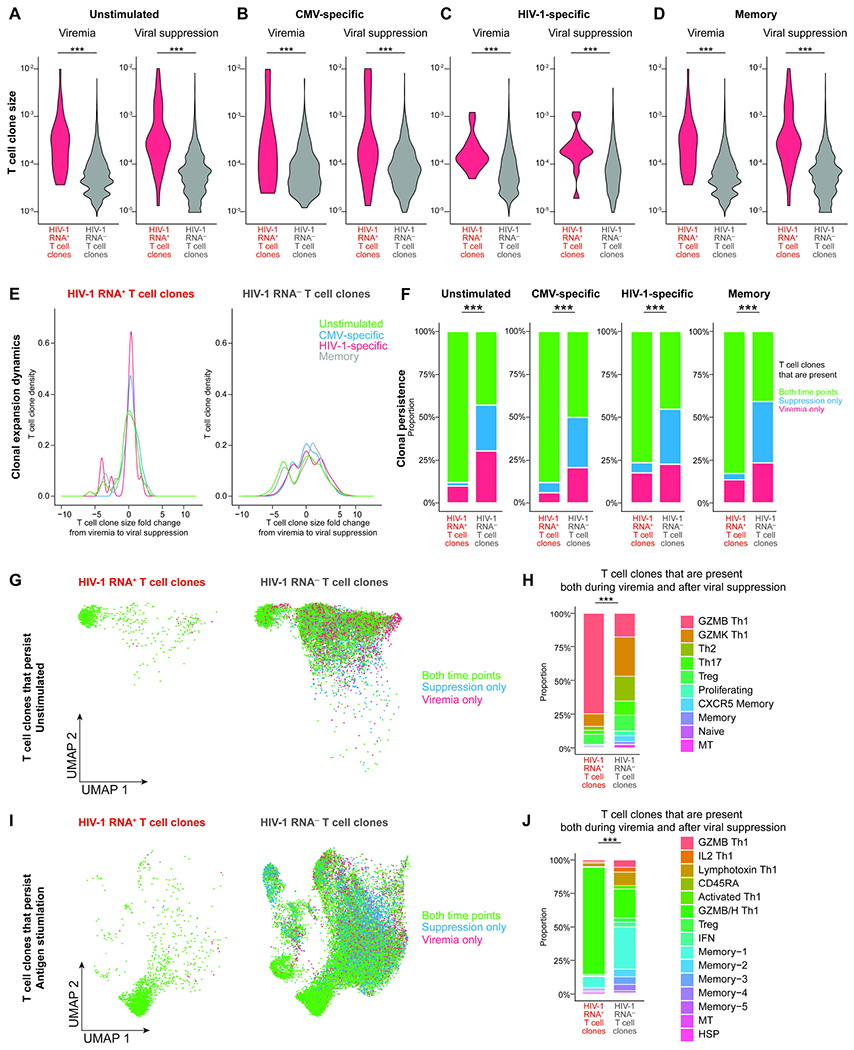
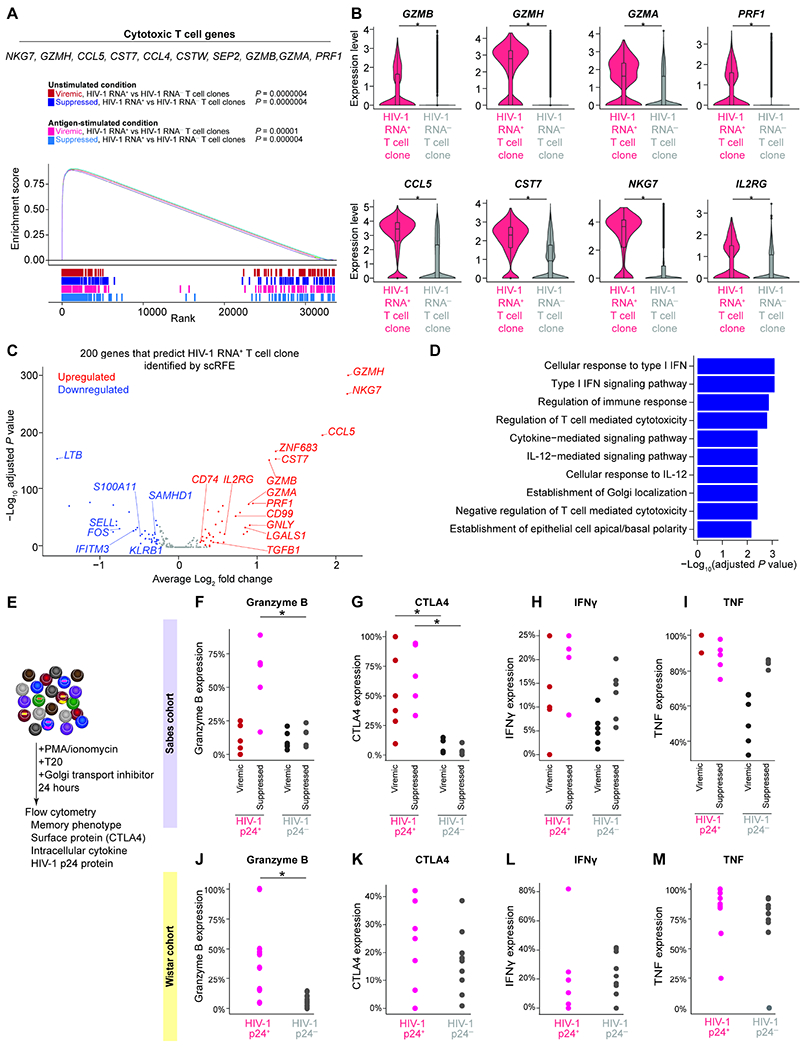
Understanding the drivers and markers of clonally expanding HIV-1-infected CD4+ T cells is essential for HIV-1 eradication. We used single-cell ECCITE-seq, which captures surface protein expression, cellular transcriptome, HIV-1 RNA, and TCR sequences within the same single cell to track clonal expansion dynamics in longitudinally archived samples from six HIV-1-infected individuals (during viremia and after suppressive antiretroviral therapy) and two uninfected individuals, in unstimulated conditions and after CMV and HIV-1 antigen stimulation. Despite antiretroviral therapy, persistent antigen and TNF responses shaped T cell clonal expansion. HIV-1 resided in Th1-polarized, antigen-responding T cells expressing BCL2 and SERPINB9 that may resist cell death. HIV-1 RNA+ T cell clones were larger in clone size, established during viremia, persistent after viral suppression, and enriched in GZMB+ cytotoxic effector memory Th1 cells. Targeting HIV-1-infected cytotoxic CD4+ T cells and drivers of clonal expansion provides another direction for HIV-1 eradication.

Keywords: HIV-1 latent reservoir; HIV-1 persistence; HIV-1-induced immune dysfunction; T cell expansion dynamics; TNF response; antigen stimulation; clonal expansion; cytotoxic CD4(+) T lymphocytes; granzyme B; single-cell RNA-seq.


Conflict of interest statement

Declaration of interests The authors declare no competing interests.

Figures

Figure 1.
Figure 1.. Paired CD4+ T cell profiling during viremia and after viral suppression by single-cell multiomic ECCITE-seq reveals persistent TNF responses despite suppressive ART.
A, Study design. Participants enrolled in the Sabes study were prospectively tested monthly for HIV-1 infection using HIV-1 antibody detection, antigen detection, and viral RNA quantification. We profiled paired CD4+ T cells during acute viremia (<60 days after estimated date of detectable infection) and after one year of suppressive ART (with documented undetectable viral load 6 months prior to the viral suppression time point) from six HIV-1-infected individuals enrolled in Sabes and subsequently followed in the Merlin study. CD4+ T cells from two sex-matched uninfected individuals were used as controls. B, UMAP plot of memory phenotypes of cells (n = 52,473, 36,806, and 33,406 cells in the viremic, virally suppressed, and uninfected conditions, respectively) defined by surface CD45RA and CCR7 expression. C, UMAP of 10 clusters of CD4+ T cells defined by transcriptome. D, Dot plot depicting key cluster marker expression in viremic, suppressed, and uninfected conditions. E, The proportion of proliferating cells expressing TBX21, the key transcription factor for Th1 polarization. P values were determined by Wilcoxon rank-sum test. F and G, Pearson’s correlation coefficient heatmaps of TNF-driven gene expression module of viremia versus uninfected conditions (F) and suppressed versus uninfected conditions (G). H and I, Ingenuity pathway analysis (IPA) heatmaps of enriched immune pathways (H) and predicted upstream regulators (I) of the TNF-driven gene expression module. P values were defined by Fisher’s exact test. J, Module score of TNF-driven gene expression module in viremia, viral suppression, and uninfected conditions in the Th1 polarized GZMK cluster. P values were determined by Wilcoxon rank-sum test comparing HIV-1-infected conditions and uninfected conditions. *, P <0.05; ***, P <0.0001. P values were corrected for multiple comparisons using the Benjamini-Hochberg procedure. See also Figure S1, Figure S2, Figure S3, Table S1, and Table S2.
Figure 2.
Figure 2.. T cell clone size is determined by antigen response, TNF signaling, and Th1 cytotoxic response.
A, T cells sharing the same TCR in the same individual are identified as a T cell clone. T cell clone size is the frequency of T cells sharing the same TCR sequence out of all cells with detected TCR sequences. By calculating the correlation between T cell clone size and gene expression levels in individual cells, we can identify the determinants of T cell clone size. B, UMAP plot indicating the log2 bulk clone size of each cell based on TCRβ nucleotide CDR3 junction sequence per 10,000 CD4+ T cells. C, The level of clonality (as measured by Gini index) in each cluster in viremic, suppressed, and uninfected conditions. P values were determined by Wilcoxon rank-sum test comparing each cluster to naive cells. D–F, To identify pathways correlating with T cell clone size, we first ranked genes based on their correlation with clones size and then used Gene Set Enrichment Analysis (GSEA). We identified pathways including Goldrath antigen response (D), Hallmark TNF signaling via NFκB (E), and Bosco Th1 cytotoxic module (F). Representative leading-edge genes (the top genes enriched in each pathway) were shown in each panel. Thick lines indicate the mean enrichment score for each condition and thin lines indicate the enrichment score for each individual. G–H, Genes that were predictive of T cell clone size across cells in each condition were identified by elastic net regression. These genes were then examined by Ingenuity Pathway Analysis to determine the immune pathways (G) and upstream regulators (H). P values were defined by Fisher’s exact test. P values were corrected for multiple comparisons using the Benjamini-Hochberg procedure. *, P < 0.05. See also Figure S3 and Table S3.
Figure 3.
Figure 3.. TCR repertoire mappings revealed the different transcriptome program of CMV-specific versus HIV-1-specific cells in unstimulated states.
A, CMV-specific and HIV-1-specific CD4+ T cells were identified as cells expressing activation inducible markers (AIM)(CD69 and CD154) after 9 hours of antigen stimulation in the presence of autologous CD8-depleted PBMC. CMV-specific cells, HIV-1-specific cells, and CD45RO+ memory cells were sorted by flow cytometry for single-cell ECCITE-seq. B, UMAP plot of memory phenotypes of cells (n =3 3,805, 44,388, and 14,580 cells in the viremic (from 6 individuals), viral suppression (from 6 individuals), and uninfected conditions (from two individuals), respectively) defined by surface CD45RA and CCR7 expression. These samples came from the same infected study participants and same timepoints as profiled in the unstimulated conditions. CD45RA and CCR7 positivity was determined by barcoded surface protein staining. C, UMAP plot of 15 transcriptionally defined clusters identified in the viremic, virally suppressed, and uninfected conditions. D, UMAP plots of cells split across CMV-specific (n = 6,091), HIV-1-specific (n = 12,183), and sorted memory cell populations (n = 59,919). E, Proportion of each cluster grouped by antigen specificity, with 5 clusters predominantly antigen responsive. F, Dot plot of key effector gene expression across antigen-specific conditions in antigen-specific clusters. G, UMAP plot indicating the T cell clone size of each cell based on TCRβ nucleotide CDR3 junction sequence per 10,000 CD4+ T cells. H, Heatmap indicating the proportion of TCR sequence overlap between unstimulated and stimulated conditions. The majority of unstimulated cells were neither CMV-specific nor HIV-1-specific cells. I, Heatmap indicating the proportion of TCR sequence overlap between unstimulated CD4+ T cells and antigen-specific CD4+ T cells. J–L, Genes ranked by correlation with T cell clone size were analyzed by Gene Set Enrichment Analysis (GSEA) to determine whether the gene expression profile is enriched in specific immune pathways, such as Goldrath antigen response (J), Hallmark TNF signaling via NFκB (K), and Bosco Th1 cytotoxic module (L). Representative leading-edge genes are shown in each panel. Thick lines indicate the mean enrichment score for each condition and think lines indicate the enrichment score for each individual. See also Figure S3, Figure S4.
Figure 4.
Figure 4.. The heterogeneous transcriptional landscape of HIV-1 RNA+ cells demonstrated antigen responses, cytokine responses, and anti-apoptotic programs.
A, Cells expressing HIV-1 RNA were identified by mapping reads to autologous HIV-1 sequences in addition to HXB2 reference sequence in unstimulated conditions and stimulated conditions (including CMV-specific, and HIV-specific, and memory cells). HIV-1 RNA+ cells were defined by having at least 2 HIV-1-related UMI or at least 4 reads of a single UMI to guard against index hopping and sequencing artifacts. B–C, UMAP plots showing HIV-1 RNA+ cells in unstimulated (B), antigen-specific, and memory cells (C). D–H, Pie charts indicating the distribution of antigen specificity (D), memory phenotype in unstimulated (E) and in antigen stimulated conditions (F), transcriptionally defined clusters in unstimulated conditions (G) and in antigen stimulated conditions (H). The inner chart represents HIV-1 RNA+ cells and the outer chart represents HIV-1 RNA cells. I, Volcano plot indicating differentially expressed genes between HIV-1 RNA+ and HIV-1 RNA cells in the unstimulated condition during viremia. J, Gene ontology enrichment of immune pathways from upregulated genes. K–N, GSEA plots indicating the enrichment of gene sets in specific immune pathways, including IFNα response (K), viral response (L), cytokine and cytokine receptor interaction (M–N). Representative leading-edge genes are shown in each panel. O–P, Dot plots showing expression of anti-apoptotic Bcl-2 family genes BCL2 (encoding Bcl-2), BCL2L1 (encoding Bcl-xL), and BCL2A1 in unstimulated (O) and antigen stimulated conditions (P). See also Figure S5, Figure S6, and Table S3.
Figure 5.
Figure 5.. HIV-1 RNA+ T cell clones are enriched in effector memory and GZMB+ Th1 cells.
A, T cell clones were defined by at least two cells sharing the same TCR sequence. HIV-1 RNA+ T cell clones were defined by T cell clones having at least one HIV-1 RNA+ cells. HIV-1 RNA T cell clones were defined by T cell clones not having any HIV-1 RNA+ cells. B–C, UMAP plots indicating HIV-1 RNA+ T cell clone in unstimulated (B) and antigen stimulated conditions (C). D, The largest 100 T cell clones, as measured by bulk TCR sequencing in each participant at each time point. * in D, HIV-1 RNA+ clones. E–I, Pie charts indicating the distribution of antigen specificity (E), memory phenotype in unstimulated (F) and in antigen stimulated conditions (G) transcriptionally defined clusters in unstimulated conditions (H) and in antigen stimulated conditions (I). * in E–I, P < 0.05, Fisher’s exact test. See also Table S4, Figure S5 and Figure S6.
Figure 6.
Figure 6.. HIV-1 RNA+ T cell clones are large and persistent in GZMB and GZMB/H Th1 cells.
A–D, T cell clone size, as measured by the frequency of T cells sharing the same TCR sequence, in unstimulated (A) and antigen stimulated conditions in CMV-specific (B), HIV-1-specific (C), and memory cells (D). P values were determined by the Wilcoxon rank-sum test. E, T cell clonal expansion dynamics, as measured by the fold change of T cell clone size from viremia to viral suppression. F, T cell clonal persistence, as measured by the proportion of T cell clones that can be captured both during viremia and after viral suppression versus those that can be captured at one time point. G and I, UMAP plots showing T cell clones that persisted both during viremia and after viral suppression in unstimulated (G) and antigen-stimulated conditions (L). H and J, the proportion of transcriptionally defined T cell clusters in T cell clones that persisted both during viremia and after viral suppression in unstimulated (H) and antigen-stimulated (J) conditions. In F, H, and J, P values were determined by Fisher’s exact test. ***, P <0.001. See also Figure S6.
Figure 7.
Figure 7.. HIV-1 RNA+ T cell clones are enriched in effector memory CD4+ T cells and express cytotoxic T cell genes.
A, GSEA plot and example leading-edge genes (the top genes enriched in this pathway) showing enrichment of gene expression in T cell activation genes (GSE45739 unstimulated versus anti-CD3/CD28 stimulated CD4 T cell upregulated) in HIV-1 RNA+ T cell clones. B, Expression level of cytotoxic T cell response genes. P values were derived from Wilcoxon rank-sum test. C, The 200 genes necessary and sufficient to differentiate HIV-1 RNA+ T cell clone from HIV-1 RNAT cell clone were identified using single-cell identity definition using random forests and recursive feature elimination (scRFE). The volcano plot showed differential expression of the 200 scRFE defined genes. P values were derived from Wilcoxon rank-sum test. D, Enriched immune pathways of upregulated genes among the 200 genes necessary and sufficient to differentiate HIV-1 RNA+ T cell clone from HIV-1 RNAT cell clones. P values were calculated by Fisher’s exact test. E, To validate whether the enrichment of HIV-1 RNA+ cells in GZMB+, CTLA4+, and effector memory populations at the protein level, we stimulated CD4+ T cells with PMA and ionomycin in the presence of ART (T20) and Golgi transport inhibitors for 24 hours. We then measured HIV-1 p24 protein expression, memory markers, granzyme B, CTLA4, IFNγ, and TNF protein expression in the Sabes cohort (F–I) and the Wistar cohort (J–M). Study participants in these two cohorts were significantly different in the duration of viral suppression, age, ethnicity, and geographic locations. P values were derived from Wilcoxon rank-sum test. *, P <0.05; ***, P <0.001. See also Figure S7 and Table S4.

Similar articles

Cited by

References

    1. Appay V, Zaunders JJ, Papagno L, Sutton J, Jaramillo A, Waters A, Easterbrook P, Grey P, Smith D, McMichael AJ, et al. (2002). Characterization of CD4(+) CTLs ex vivo. J Immunol 168, 5954–5958. - PubMed
    1. Bailey JR, Sedaghat AR, Kieffer T, Brennan T, Lee PK, Wind-Rotolo M, Haggerty CM, Kamireddi AR, Liu Y, Lee J, et al. (2006). Residual human immunodeficiency virus type 1 viremia in some patients on Antiretroviral therapy is dominated by a small number of invariant clones rarely found in circulating CD4(+) T cells. Journal of Virology 80, 6441–6457. - PMC - PubMed
    1. Barreiro LB, and Quintana-Murci L (2010). From evolutionary genetics to human immunology: how selection shapes host defence genes. Nat Rev Genet 11, 17–30. - PubMed
    1. Becht E, McInnes L, Healy J, Dutertre C-A, Kwok IWH, Ng LG, Ginhoux F, and Newell EW (2018). Dimensionality reduction for visualizing single-cell data using UMAP. Nature Biotechnology 37, 38. - PubMed
    1. Bengsch B, Ohtani T, Khan O, Setty M, Manne S, O’Brien S, Gherardini PF, Herati RS, Huang AC, Chang K-M, et al. (2018). Epigenomic-Guided Mass Cytometry Profiling Reveals Disease-Specific Features of Exhausted CD8 T Cells. Immunity 48, 1029–1045.e1025. - PMC - PubMed

Publication types