. 2022 Mar 22;38(12):110531.
doi: 10.1016/j.celrep.2022.110531.

Mobile origin-licensing factors confer resistance to conflicts with RNA polymerase

Affiliations

Mobile origin-licensing factors confer resistance to conflicts with RNA polymerase

Matthias J Scherr et al. Cell Rep. .

Abstract

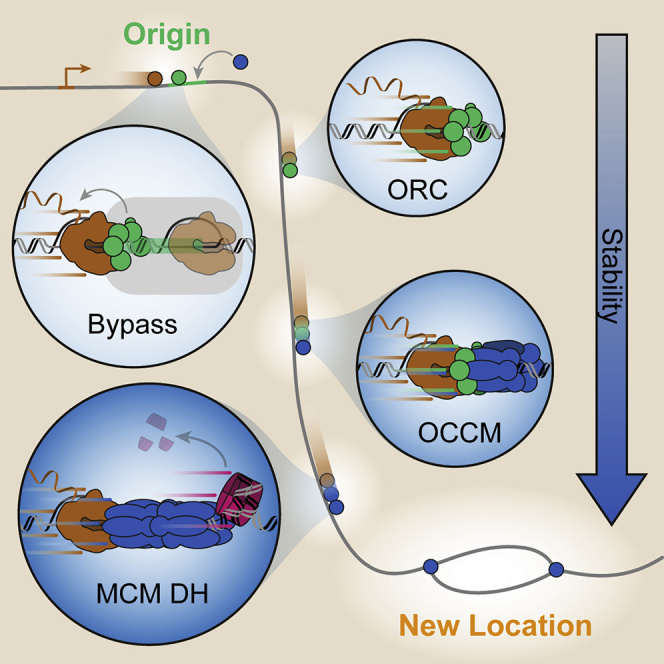
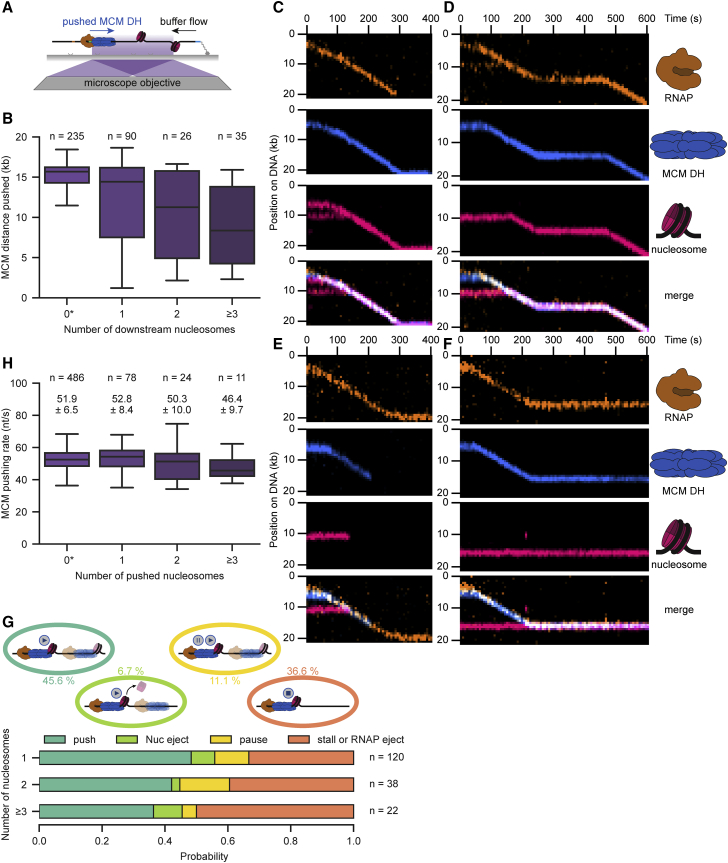
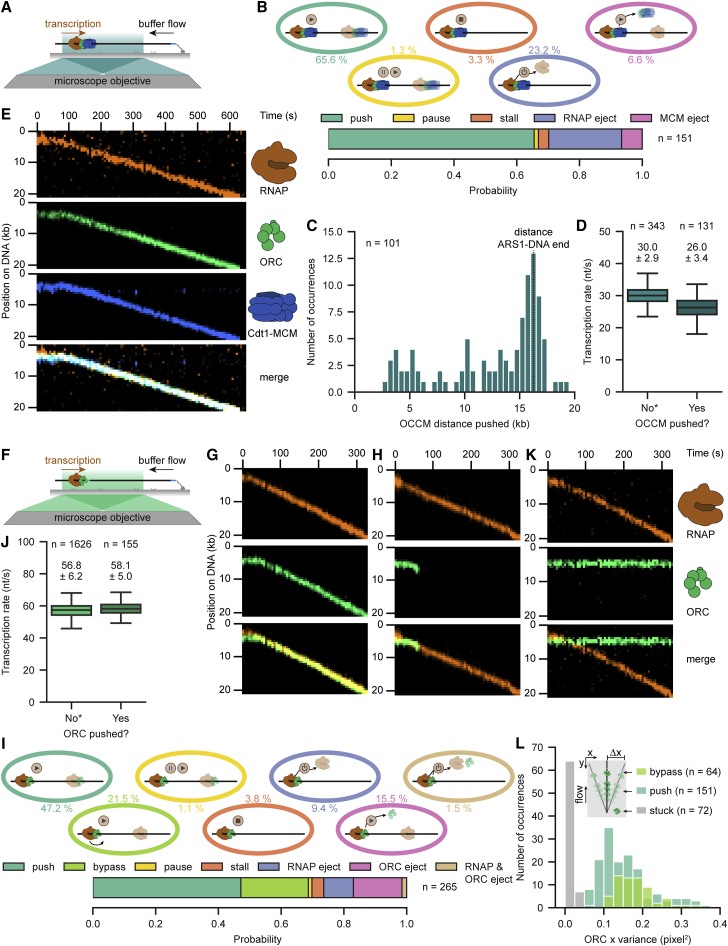
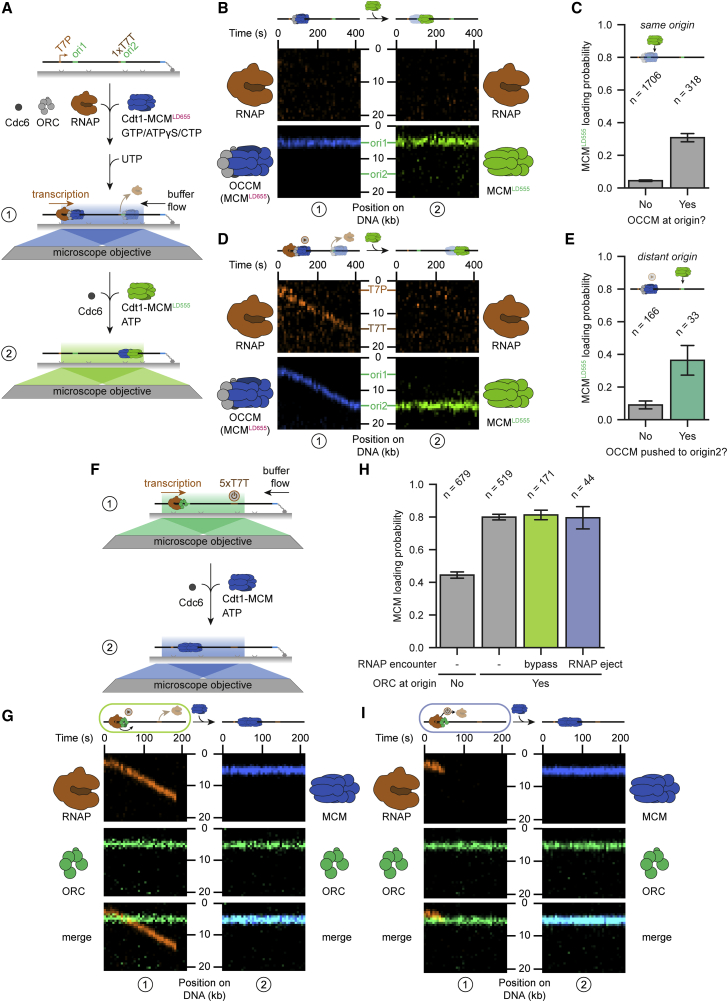
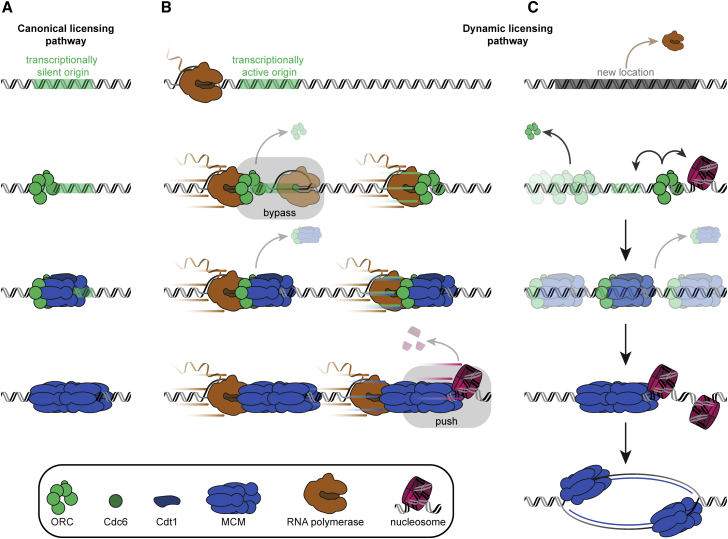
Fundamental to our understanding of chromosome duplication is the idea that replication origins function both as sites where MCM helicases are loaded during the G1 phase and where synthesis begins in S phase. However, the temporal delay between phases exposes the replisome assembly pathway to potential disruption prior to replication. Using multicolor, single-molecule imaging, we systematically study the consequences of encounters between actively transcribing RNA polymerases (RNAPs) and replication initiation intermediates in the context of chromatin. We demonstrate that RNAP can push multiple licensed MCM helicases over long distances with nucleosomes ejected or displaced. Unexpectedly, we observe that MCM helicase loading intermediates also can be repositioned by RNAP and continue origin licensing after encounters with RNAP, providing a web of alternative origin specification pathways. Taken together, our observations reveal a surprising mobility in origin-licensing factors that confers resistance to the complex challenges posed by diverse obstacles encountered on chromosomes.

Keywords: CP; CP: Molecular biology; DNA replication; MCM2-7; Molecular biology; ORC; RNA polymerase; TIRF; chromatin; origin licensing; single molecule; transcription.


Conflict of interest statement

Declaration of interests The authors declare no competing interests.

Figures

None
Graphical abstract
Figure 1
Figure 1
MCM DHs load at ARS1 and can switch to a diffusive DNA binding mode (A) Schematic of the single-molecule helicase loading assay. ARS1-DNA (21 kb) was incubated with ORC, Cdc6, and Cdt1-MCM, washed, and imaged on flow-stretched DNA. (B) ORC (green) and MCM (blue) binding distribution histogram on ARS1-DNA. Data from all experiments irrespective of ATP or ATPγS are shown. Lines represent the kernel density estimation (KDE). Insets show a close-up of residual binding downstream of ARS1. Results with ORC and MCM labeled are displayed (top). Merged results with labeled MCM and a combination of labeled and unlabeled ORC are displayed (bottom). (C) Number of MCM foci on ARS1-DNA challenged with low or high salt (HS) after helicase loading in the presence of ATP or ATPγS. (D and E) Distribution of MCM (D) and ORC (E) bleaching steps after helicase loading in the presence of ATP or ATPγS. ORC and MCM were both labeled. (F and G) Representative kymographs showing MCM DH dynamics at 0.5 M NaCl. Most MCM DHs remained bound to ARS1 (F), but a subset switched to a diffusive DNA binding mode (G). MCM was labeled and ORC was unlabeled. (H) MCM diffusion coefficients at 0.5 M NaCl. Bar plots in (C), (D), (E), and (H) display the mean and SEM. See also Figure S1.
Figure 2
Figure 2
Time-coordinated single-molecule transcription (A) Schematic of the time-coordinated transcription assay. Stalled T7 RNA polymerase (RNAP) elongation complexes were formed on 21 kb T7 promoter (T7P)-DNA in the presence of GTP, ATP, and CTP. Transcription was started and imaged after addition of UTP. (B) Representative kymographs showing transcribing RNAP upon UTP arrival in the presence of ATP (top) or ATPγS (bottom). (C) RNAP transcription start and stop site distribution histogram on T7P-DNA. Data from all experiments irrespective of ATP or ATPγS are shown. Lines represent the KDE. (D) Transcription rate distribution in the presence of ATP or ATPγS. Values indicate the mean ± SD derived from a Gaussian fit (lines). (E) Mean transcription pause probability on T7P-DNA in the presence of ATP or ATPγS. Error bars display SEM. See also Figure S2.
Figure 3
Figure 3
RNAP can robustly reposition MCM DHs (A) Schematic of the RNAP-MCM DH collision assay. RNAP and MCM DHs were loaded onto 21-kb T7P-ARS1-DNA. Transcription was started and imaged after addition of UTP. (B) Representative kymograph demonstrating that RNAP (amber) could push MCM DH (blue) upon collision. (C) Distribution of MCM DH distance pushed by RNAP. (D) Quantification of the outcomes of RNAP collisions with MCM DHs with (top) or without (bottom) a high-salt (HS) wash prior to transcription start. Displayed percentages represent the combined probability of both conditions. (E) Representative kymographs demonstrating that RNAP (amber) can push multiple MCM DHs (fire LUT) over long distances. (F) Boxplot of transcription rates in the absence (no MCM) or presence of a single MCM and (1 to ≥5) pushed MCM DHs. Values above the boxplots indicate the mean ± SD derived from a Gaussian fit. Data displayed for no pushed MCMs were combined with data shown in Figure 2D. See also Figure S3.
Figure 4
Figure 4
RNAP can reposition MCM DHs together with multiple nucleosomes (A) Schematic of the MCM DH displacement assay in the presence of nucleosomes. Assay was performed as described in Figure 3A but on chromatinized DNA. (B) Boxplot of the global MCM distance pushed in the absence (0) or presence (1 to ≥3) of nucleosomes downstream of ARS1. (C–F) Representative kymographs demonstrating that RNAP (amber) could displace MCM DHs (blue) through one or multiple nucleosomes (pink) by nucleosome pushing (C and D) or ejection (E) besides transcription stalling (F) upon collision. (G) Quantification of the outcomes of pushed MCM DH collisions with a total of 1, 2, or ≥3 nucleosomes. Displayed percentages represent the combined probability irrespective of the number of nucleosomes. (H) Boxplot of MCM pushing rates in the absence (0) or presence of (1 to ≥3) pushed nucleosomes. Values above the boxplots indicate the mean ± SD derived from a Gaussian fit. Data displayed for 0 pushed nucleosomes in (B) and (H) were combined with data shown in Figures 3C and 3F, respectively. See also Figure S4.
Figure 5
Figure 5
OCCM and ORC are repositioned or bypassed by RNAP (A) Schematic of the RNAP-OCCM collision assay. Assay was performed as described in Figure 3A, but ATPγS was used instead of ATP in all steps. (B) Quantification of the outcomes of RNAP collision with OCCM. (C) Distribution histogram of OCCM distance pushed by RNAP. (D) Boxplot of transcription rates in the absence or presence of a pushed OCCM. (E) Representative kymograph demonstrating that OCCM stays intact when being pushed by RNAP (amber), as judged by the presence of ORC (green) and Cdt1-MCM (blue). (F) Schematic of the RNAP-ORC collision assay. Assay was performed as described in Figure 3A, but only RNAP and ORC were loaded on DNA. (G and H) Representative kymographs showing that ORC (green) could also be displaced by RNAP (amber, G) but was ejected more frequently (H). (I) Quantification of the outcomes of RNAP collision with ORC. (J) Boxplot of transcription rates in the absence or presence of a pushed ORC. (K) Representative kymograph demonstrating that RNAP (amber) was able to bypass ORC (green) bound to ARS1. (L) Distribution of x variance perpendicular to buffer flow for pushed, bypassed, and surface-stuck ORC molecules. Values above the boxplots in (D) and (J) indicate the mean ± SD derived from a Gaussian fit. Data displayed for non-pushed OCCM and ORC in (D) and (J) were combined with data shown in Figure 2D-ATPγS and ATP condition, respectively. See also Figure S5.
Figure 6
Figure 6
Origin licensing continues after RNAP encounters (A) Schematic of the two-step assay to address OCCM functionality after encounters with RNAP. LD655-OCCM complexes were formed on 21-kb DNA containing one origin (ori1) near the T7 promoter (T7P) and a second origin (ori2) right downstream of a single T7 terminator (T7T). Encounters with RNAP were visualized in the presence of ATPγS as described in Figure 5A (1). Subsequently, Cdc6 and Cdt1-LD555-MCM were added and incubated in the presence of ATP, and products were visualized (2). (B) Representative kymograph showing continued origin licensing at origins occupied (ori1) by LD655-OCCM (blue) but not at free origins (ori2) as determined by loading of LD555-MCM (green) to the same origin in the absence of encounters with RNAP (amber). (C) Quantification of the LD555-MCM loading probability at free origins compared with origins occupied by LD655-OCCM. (D) Representative kymograph demonstrating continued origin licensing at distant origins (ori2) after LD655-OCCM (blue) was pushed by RNAP (amber) as determined by loading of LD555-MCM (green). (E) Quantification of the LD555-MCM loading probability at distant origins (ori2) without or with LD655-OCCM being dropped off by RNAP pushing. All analyzed DNA molecules contained LD655-OCCM at ori1 but not at ori2 at the start of the experiment. (F) Schematic of the two-step assay to address ORC functionality after encounters with RNAP. ORC was loaded on 5×T7T -DNA, and encounters with RNAP were visualized in the presence of ATP as described in Figure 5F (1). Subsequently, Cdc6 and Cdt1-MCM were added and incubated, and products were visualized (2). (G) Representative kymograph showing continued origin licensing after RNAP (amber) bypassed ORC (green) as determined by loading of MCM (blue). (H) Quantification of the MCM loading probability in the second incubation step (2) after RNAP encounters with ORC. MCM loading is highly enhanced if ORC was present at the start of the experiment. (I) Representative kymograph demonstrating that origin licensing continued after RNAP (amber) was ejected upon encountering ORC (green) as determined by loading of MCM (blue). Bar plots in (C), (E), and (H) display the mean and SEM. See also Figures S6 and S7.
Figure 7
Figure 7
Mobile origin-licensing factors confer resistance to transcription conflicts (A) Canonical origin-licensing pathway at transcriptionally silent origins. The MCM DH is loaded at the origin sequentially via multiple licensing intermediates. (B) Dynamic origin-licensing pathway at transcriptionally active origins. Origin-licensing intermediates are repositioned by RNAP with increasing stability as the pathway progresses. RNAP can bypass ORC at the origin. Nucleosomes are pushed or ejected during repositioning. (C) Origin licensing continues at new locations. Although ORC is unstable after relocation by RNAP, an interaction with an additional factor (e.g., a nucleosome) or sequence element could mediate continuation of helicase loading. OCCM remains competent to continue new rounds of MCM loading after transcription terminates. MCM firing takes place at a new location.

Similar articles

Cited by

References

    1. Abid Ali F., Douglas M.E., Locke J., Pye V.E., Nans A., Diffley J.F.X., Costa A. Cryo-EM structure of a licensed DNA replication origin. Nat. Commun. 2017;8:2241. - PMC - PubMed
    1. Aitken C.E., Marshall R.A., Puglisi J.D. An oxygen scavenging system for improvement of dye stability in single-molecule fluorescence experiments. Biophys. J. 2008;94:1826–1835. - PMC - PubMed
    1. Azmi I.F., Watanabe S., Maloney M.F., Kang S., Belsky J.A., MacAlpine D.M., Peterson C.L., Bell S.P. Nucleosomes influence multiple steps during replication initiation. Elife. 2017;6:e22512. - PMC - PubMed
    1. Bleichert F., Botchan M.R., Berger J.M. Mechanisms for initiating cellular DNA replication. Science. 2017;355:eaah6317. - PubMed
    1. Bramhill D., Kornberg A. Duplex opening by dnaA protein at novel sequences in initiation of replication at the origin of the E. coli chromosome. Cell. 1988;52:743–755. - PubMed

Publication types

MeSH terms