. 2022 Apr 11;57(7):914-929.e7.
doi: 10.1016/j.devcel.2022.02.017. Epub 2022 Mar 22.

Cellular heterogeneity of human fallopian tubes in normal and hydrosalpinx disease states identified using scRNA-seq

Affiliations

Cellular heterogeneity of human fallopian tubes in normal and hydrosalpinx disease states identified using scRNA-seq

Nicole D Ulrich et al. Dev Cell. .

Abstract

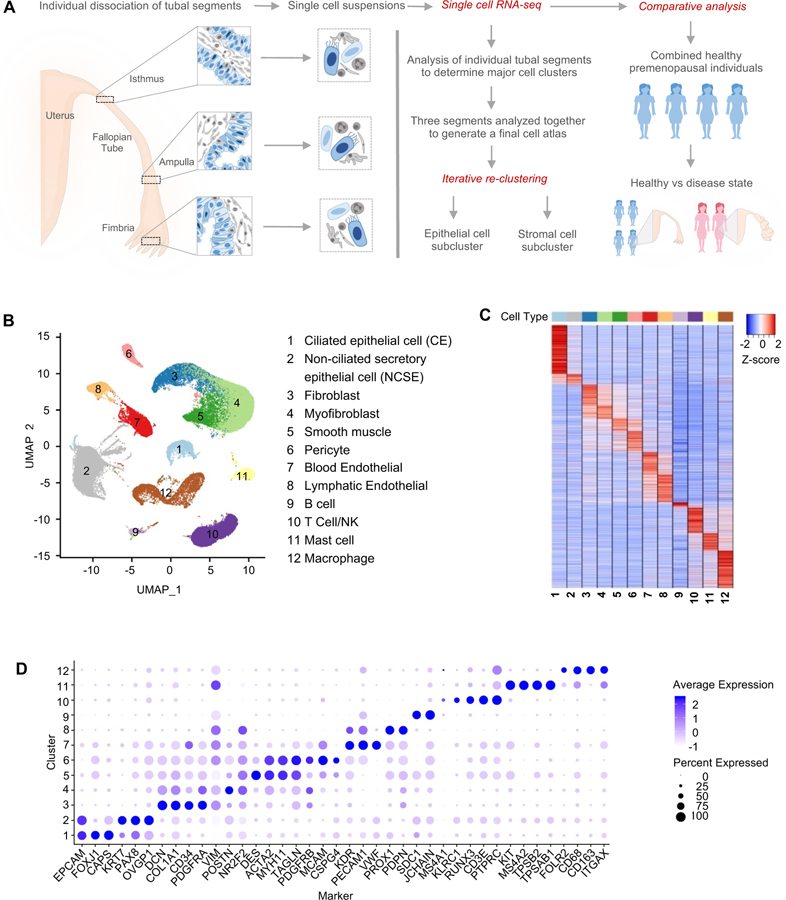
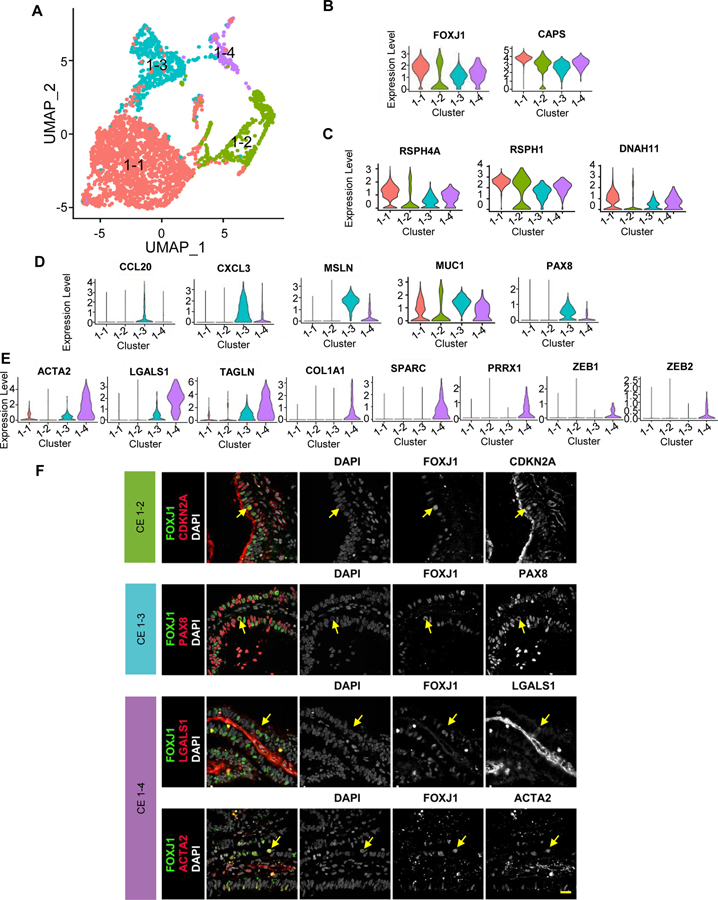
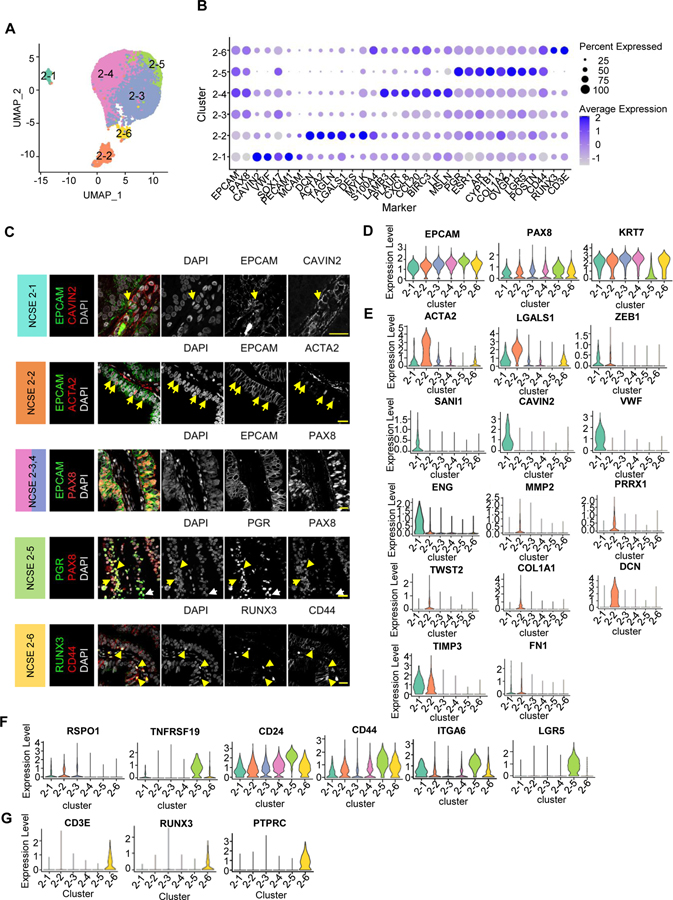
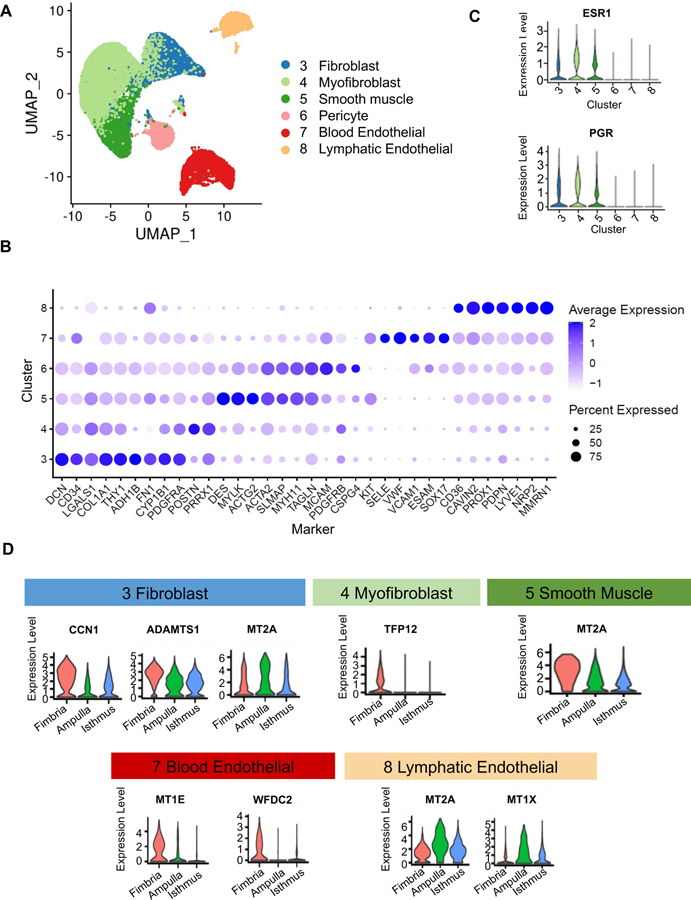
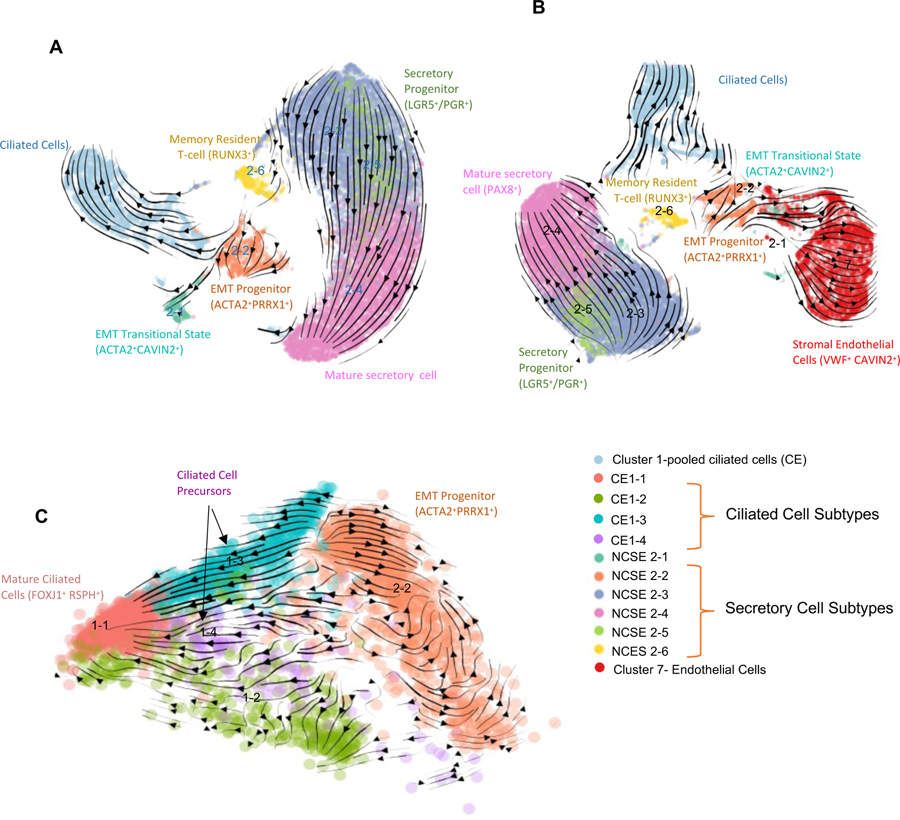
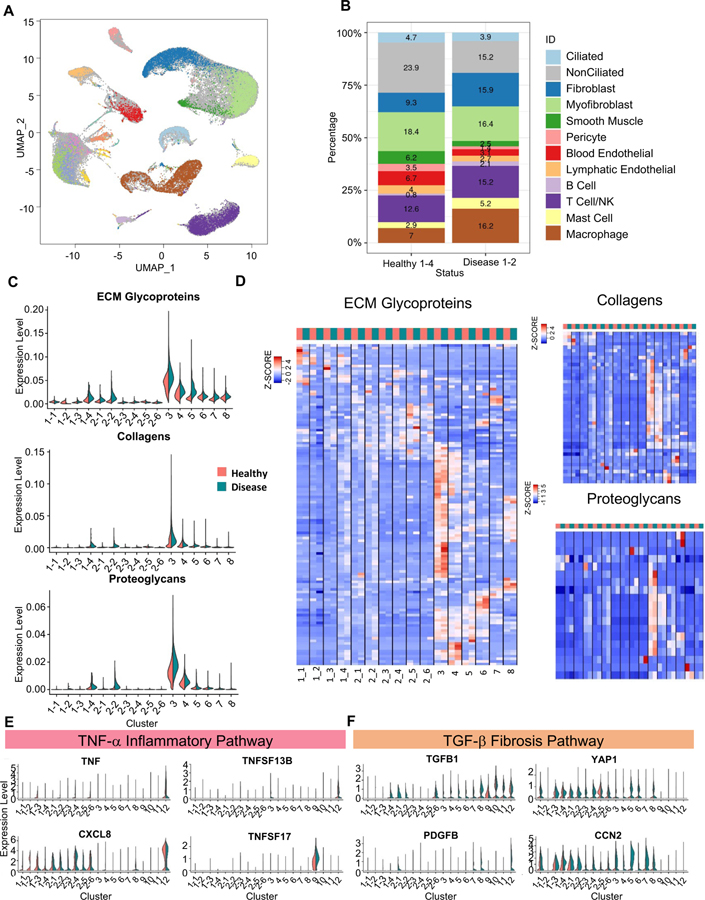
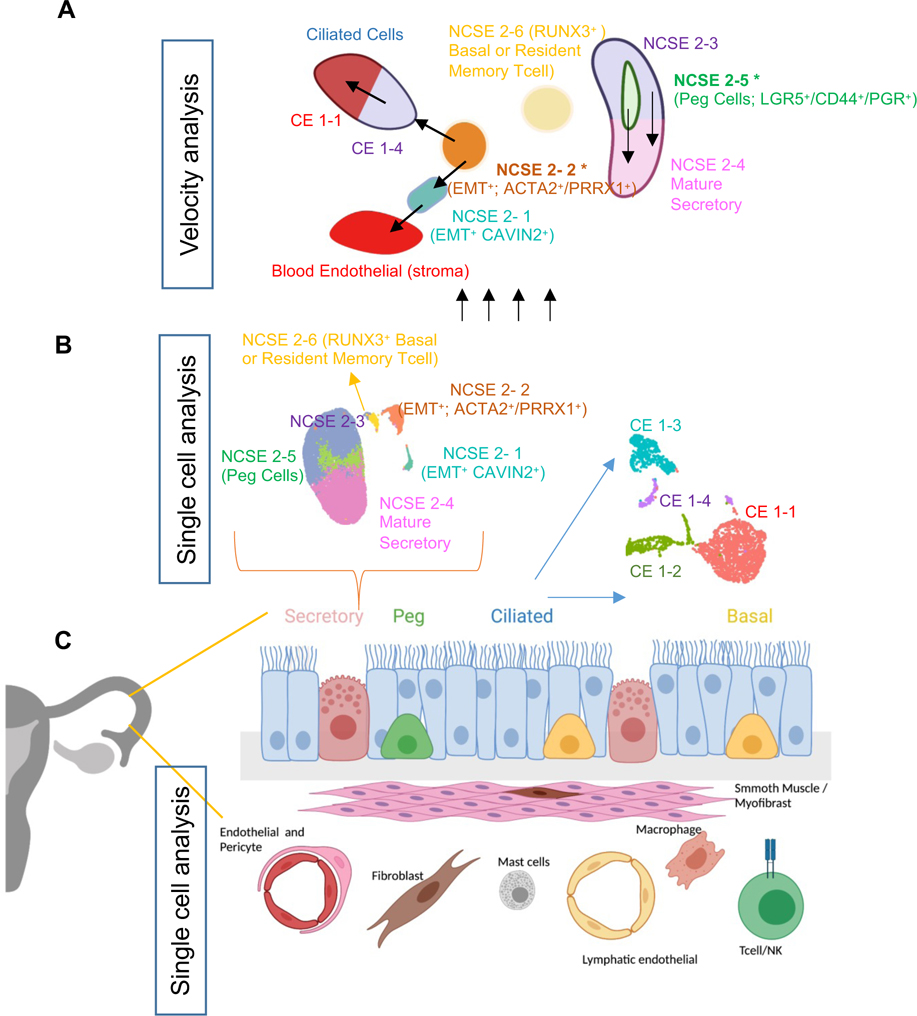
Fallopian tube (FT) homeostasis requires dynamic regulation of heterogeneous cell populations and is disrupted in infertility and ovarian cancer. Here, we applied single-cell RNA-seq to profile 59,738 FT cells from four healthy, pre-menopausal subjects. The resulting cell atlas contains 12 major cell types representing epithelial, stromal, and immune compartments. Re-clustering of epithelial cells identified four ciliated and six non-ciliated secretory epithelial subtypes, two of which represent potential progenitor pools: one leading to mature secretory cells and the other contributing to either ciliated cells or one of the stromal cell types. To understand how FT cell numbers and states change in a disease state, we analyzed 17,798 cells from two hydrosalpinx samples and observed shifts in epithelial and stromal populations and cell-type-specific changes in extracellular matrix and TGF-β signaling; this underscores fibrosis pathophysiology. This resource is expected to facilitate future studies aimed at expanding understanding of fallopian tube homeostasis in normal development and disease.

Keywords: EMT; fallopian tube; female infertility; hydrosalpinx; ovarian cancer; progenitor cells; single-cell RNA-seq; stem cell.


Conflict of interest statement

Declaration of interests The authors declare no competing interests.

Figures

Figure 1.
Figure 1.. Major cell types and markers identified from single-cell RNA-Seq analysis of healthy human fallopian tubes.
A. Overview of the study, including the fallopian tube sections from which the samples were taken, and the data collection and analysis processes. B. Identification of 12 major cell types from global clustering of cells from healthy subjects, visualized in UMAP space. C. Marker gene expression pattern in the 12 major cell types, with values for each gene averaged within each cell type (i.e., the centroid), then standardized over the 12 centroids. D. Average expression level and prevalence of selected markers used to annotate the 12 major fallopian tube cell types. Details are in Table S3. See also Figure S1, Table S2 and Table S3.
Figure 2:
Figure 2:. Subtypes of ciliated cells.
A. Focused re-clustering 2,798 ciliated cells of healthy fallopian tubes identifies 4 subtypes, 1–1 to 1–4, shown in UMAP space. B-E. Expression levels of selected markers used to identify the 4 ciliated cell subtypes, with general markers for ciliated cells shown in B; markers for 1–1 and 1–2 in C; those for 1–3 in D; and those for 1–4 in E. F. Immunofluorescence (IF) staining of the fallopian tube epithelium using antibodies against FOXJ1 and unique markers for ciliated cell subtypes: CDKN2A for 1–2, PAX8 for 1–3, LGALS1 and ACTA2 for 1–4. Arrows indicate double positive cells. See also Figure S2, Figure S4, Table S4 and Table S6.
Figure 3:
Figure 3:. Subtypes of non-ciliated secretory epithelial cells.
A. Focused re-clustering 14,285 non-ciliated secretory epithelial cells of healthy fallopian tubes identifies 6 subclusters, 2–1 to 2–6, shown in UMAP space. B. Average expression levels and prevalence of major markers used to annotate the 6 non-ciliated secretory epithelial cell subtypes. C. IF staining using antibodies against unique markers for non-ciliated secretory epithelial cell subtypes. Arrows indicate double positive cells D. Expression levels of common markers for non-ciliated epithelial cells. E-G. Expression levels of selected markers used to identify the 6 subtypes. E. Markers for NCSE 2–1 and 2–2. F. Makers for NCSE 2–3 and NCSE 2–5. G. Markers for NCSE 2–6. See also Figure S3, Figure S4, Table S5 and Table S6.
Figure 4:
Figure 4:. Stromal cell classification.
A. Visualization of 28,691 stromal cells in a UMAP projection of only the stromal cells, colored by the 6 stromal clusters from global clustering shown in Fig.1B B. Average expression levels and prevalence of major markers used to annotate the stromal cell types. C. Expression levels of genes encoding hormone receptors, ESR1 and PGR, in the 6 stromal cell types. D. Expression levels of select markers differentially expressed across the three fallopian tube segments for different stromal clusters. See also Figure S5 and Table S6.
Figure 5.
Figure 5.. Velocity analysis that uncovers two potential progenitor populations.
A. Velocity plot for CE and 6 subtypes of NCSE in UMAP view. Similar results were found when running Velocity analysis for the 3 FT samples separately while using common UMAP projections (Figure S4C. see Methods). B. Velocity plot for CE, 6 subtypes of NCSE, and Blood endothelial cells (global cluster 7) in UMAP view. C. Velocity plot for 4 subtypes of CE and NCSE 2–2 in PCA view. See also Figure S4.
Figure 6:
Figure 6:. Comparison of epithelial and stromal populations between healthy and disease samples.
A. Visualization of cells from two diseased fallopian tube samples (FT5 and FT6) in a global UMAP projection, colored by supervised assignment of the FT5 and FT6 cells into clusters found for the healthy samples. Cells from healthy samples are colored as grey background. B. Composition of the 12 cell types, compared between the 4 healthy samples and the 2 disease samples. C. Expression level distribution of three ECM-related gene sets, for the 4 CE subtypes. 6 NCSE subtypes, and 6 stromal cell types, compared between healthy (red) and disease (blue) samples. D. Heatmaps of expression levels of three sets of genes, for ECM glycoproteins, collagens, and proteoglycans, respectively, compared across cell types and between healthy (red) and disease (blue) samples. Average expression of each gene is calculated for each cell type (i.e., the centroid), then standardized over the centroids shown. E, F. Expression levels of genes in TNFα pathway (E) and TGFβ pathway (F), compared across cell types and between healthy (red) and disease (blue) samples. See also Figure S6, Table S2, Table S7, Table S8 and Table S9.
Figure 7:
Figure 7:. Model for epithelial differentiation trajectory
A. Illustration of the differentiation trajectories of NCSE cells originated from two secretory cell progenitors (NCSE2-2 (ACTA2/PRRX1) and NCSE2-5 (LGR5/PGR)) revealed by velocity analysis. B. scRNA-seq of thousands of fallopian tube cells expands cellular taxonomy of the epithelial cell subtypes from four to ten. C. Schematic of 12 major cell types for healthy human fallopian tubes established by scRNA-seq analysis. See also Figure S7.

References

    1. Ajonuma LC, Ng EHY, Chan LN, Chow PH, Kung LS, Cheung ANY, Ho LS, Briton-Jones C, Lok IH, Haines CJ, Chan HC, 2005. Ultrastructural characterization of whole hydrosalpinx from infertile Chinese women. Cell Biol. Int. 8. - PubMed
    1. Ardighieri L, Lonardi S, Moratto D, Facchetti F, Shih I-M, Vermi W, Kurman RJ, 2015. Characterization of the Immune Cell Repertoire in the Normal Fallopian Tube 21. - PMC - PubMed
    1. Barton BE, Herrera GG, Anamthathmakula P, Rock JK, Willie AM, Harris EA, Takemaru K-I, Winuthayanon W, 2021. Roles of steroid hormones in oviductal function 25. - PMC - PubMed
    1. Bergen V, Lange M, Peidli S, Wolf FA, Theis FJ, 2020. Generalizing RNA velocity to transient cell states through dynamical modeling. Nat. Biotechnol. 38, 1408–1414. 10.1038/s41587-020-0591-3 - DOI - PubMed
    1. Biernacka A, Dobaczewski M, Frangogiannis NG, 2011. TGF-β signaling in fibrosis. Growth Factors Chur Switz. 29, 196–202. 10.3109/08977194.2011.595714 - DOI - PMC - PubMed

Publication types