. 2022 Mar 14:2022:3873420.
doi: 10.1155/2022/3873420. eCollection 2022.

Ferroptosis as a Novel Determinant of β-Cell Death in Diabetic Conditions

Affiliations

Ferroptosis as a Novel Determinant of β-Cell Death in Diabetic Conditions

Ana Stancic et al. Oxid Med Cell Longev. .

Abstract

The main pathological hallmark of diabetes is the loss of functional β-cells. Among several types of β-cell death in diabetes, the involvement of ferroptosis remains elusive. Therefore, we investigated the potential of diabetes-mimicking factors: high glucose (HG), proinflammatory cytokines, hydrogen peroxide (H2O2), or diabetogenic agent streptozotocin (STZ) to induce ferroptosis of β-cells in vitro. Furthermore, we tested the contribution of ferroptosis to injury of pancreatic islets in an STZ-induced in vivo diabetic model. All in vitro treatments increased loss of Rin-5F cells along with the accumulation of reactive oxygen species, lipid peroxides and iron, inactivation of NF-E2-related factor 2 (Nrf2), and decrease in glutathione peroxidase 4 expression and mitochondrial membrane potential (MMP). Ferrostatin 1 (Fer-1), ferroptosis inhibitor, diminished the above-stated effects and rescued cells from death in case of HG, STZ, and H2O2 treatments, while failed to increase MMP and to attenuate cell death after the cytokines' treatment. Moreover, Fer-1 protected pancreatic islets from STZ-induced injury in diabetic in vivo model, since it decreased infiltration of macrophages and accumulation of lipid peroxides and increased the population of insulin-positive cells. Such results revealed differences between diabetogenic stimuli in determining the destiny of β-cells, emerging HG, H2O2, and STZ, but not cytokines, as contributing factors to ferroptosis and shed new light on an antidiabetic strategy based on Nrf2 activation. Thus, targeting ferroptosis in diabetes might be a promising new approach for preservation of the β-cell population. Our results obtained from in vivo study strongly justify this approach.


Conflict of interest statement

The authors declare that the research was conducted in the absence of any commercial or financial relationships that could be construed as a potential conflict of interest.

Figures
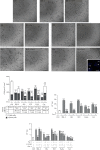
Figure 1
Figure 1
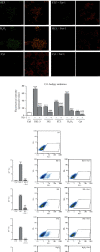
Viability and cell death assessments in Rin-5F cells after 12-hour treatments with RSL-3 (3 μM), high glucose (HG, 25 mM), streptozotocin (STZ, 10 mM), hydrogen peroxide (H2O2, 75 μM), and proinflammatory cytokines (Cyt, 20 ng/mL) alone or with the addition of ferrostatin-1 (Fer-1, 1.5 μM). (a) Phase contrast microscopy. Insert: DAPI-stained nuclei of Cyt + Fer-1-treated cells with numerous mitotic figures (arrowheads). Orig. magnification: 63x, scale bar (a): 100 μm, insert: 50 μm. (b) Total cell number per 0.1 mm2, including the fractions of cells with normal morphology (viable cells) as well cells with altered morphology (rounded, detached, and/or damaged cells). Table: the ratio of altered per total cells' number. (c) Cell death assay: the ratio of propidium iodide (PI+) stained cells. (d) Comparison of cell death ratio (PI-stained cells) in the presence of inhibitors of ferroptosis (Fer-1), apoptosis (Z-VAD), and of necrosis (Nec-1). All graph and table values are presented as means ± SEM. Statistical significance: in comparison to control: p < 0.05, ∗∗p < 0.01, ∗∗∗p < 0.001; #in comparison to the same treatment without adequate cell death inhibitor (Fer-1/Z-VAD/Nec-1): #p < 0.05, ##p < 0.01, ###p < 0.001. Significance values above bars: for a total number of cells; significance values on bars: for a number of altered cells. All experiments have been performed in triplicate, and the representative graphs are shown.
Figure 2
Figure 2
The levels of lipid peroxidation products in Rin-5F cells after 12-hour of RSL-3 (3 μM), high glucose (HG, 25 mM), streptozotocin (STZ, 10 mM), hydrogen peroxide (H2O2, 75 μM), and proinflammatory cytokines (Cyt, 20 ng/mL) treatments alone or with the addition of ferrostatin-1 (Fer-1, 1.5 μM). (a) Representative images of C11-BODIPY staining obtained by confocal microscopy. Green signal (left image of every pair) represents an oxidized form of C11-BODIPY; superimposed signals of both oxidized (green) and nonoxidated form (red) of the dye are shown as right images of every pair. Orig. magnification: 63x, scale bar: 25 μm. (b) Quantification of emission signal intensity of oxidized C11-BODIPY in Rin-5F cells at confocal microscopy level. (c) Flow cytometric analysis of C11-BODIPY oxidation presented as dot plots and as graphs. All experiments have been performed in triplicate and the representative graphs are shown. All graphs' values are presented as means ± SEM. Statistical significance: in comparison to control: p < 0.05, ∗∗p < 0.01, ∗∗∗p < 0.001; #in comparison to the same treatment without Fer-1: #p < 0.05, ##p < 0.01, ###p < 0.001.
Figure 3
Figure 3
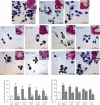
Accumulation of lipofuscin, iron, and ROS in β-cells under prodiabetic conditions in vitro (Rin-5F cells after 12 hours of RSL-3 (3 μM), high glucose (HG, 25 mM), streptozotocin (STZ, 10 mM), hydrogen peroxide (H2O2, 75 μM), and proinflammatory cytokines (Cyt, 20 ng/mL) treatments alone or with the addition of ferrostatin-1 (Fer-1, 1.5 μM)). (a) Sudan III staining of neutral lipids and lipofuscin (arrowheads). Inserts: Prussian blue demonstration of ferrous ions accumulation in treated cells (arrows). Scale bars: 20 μm. (b) Quantification of iron-positive cells from Prussian blue-stained samples (inserts in (a)). (c) ROS formation, measured by dihydrorhodamine 123 (DHR) staining. DHR staining has been performed in triplicate, and the representative graph is shown. All graphs' values are presented as means ± SEM. Statistical significance: in comparison to control: p < 0.05, ∗∗p < 0.01, ∗∗∗p < 0.001; #in comparison to the same treatment without Fer-1: #p < 0.05, ##p < 0.01, ###p < 0.001.
Figure 4
Figure 4
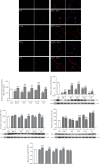
Changes in ferroptosis-related parameters in Rin-5F cells after 12 hours of RSL-3 (3 μM), high glucose (HG, 25 mM), streptozotocin (STZ, 10 mM), hydrogen peroxide (H2O2, 75 μM), and proinflammatory cytokines (Cyt, 20 ng/mL) treatments alone or with the addition of ferrostatin-1 (Fer-1, 1.5 μM). (a) Microscopic detection of pNrf2 immunopositivity in nuclei. Red signal (left image of every pair) represents pNrf2; superimposed signals of both pNrf2 (red) and DAPI-stained nuclei (blue) are presented at right images of every pair. Orig. magnification: 63x, scale bar: 25 μm. (b) Quantification of pNrf2 nuclear immunopositivity. Changes in protein abundance of (c) GPX4, (d) SOD1, and (e) xCT analyzed by Western blot analysis. β-Actin served as a protein-loading control; blots are representatives of three independent experiments. (f) Mitochondrial membrane potential has been detected by MitoTracker Red FM staining. MitoTracker Red FM staining has been performed in triplicate, and representative mean fluorescence intensity (MFI) of MMP is shown. All graph values are presented as means ± SEM. Statistical significance: in comparison to control: p < 0.05, ∗∗p < 0.01, ∗∗∗p < 0.001; #in comparison to the same treatment without Fer-1: #p < 0.05, ##p < 0.01, ###p < 0.001.
Figure 5
Figure 5
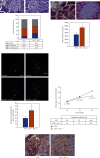
The effects of Fer-1 in vivo. (a) Representative HE micrographs of islets and the proportion of pancreatic islets without immune cell infiltrates (inf), with infiltrates surrounding the islets (peri-insulitis) and with infiltrates within the islet (insulitis) in mice treated with STZ and STZ + Fer-1 for 21 days. (b) Representative trichrome-stained micrographs of islets (Is) and average islet surface area in mice treated with STZ and STZ + Fer-1 for 21 days. (c) Insulin immunopositivity of β-cells from mice treated with STZ and STZ + Fer-1 for 21 days—representative images of pancreatic islets, stained for insulin visualization (green) and with Hoechst 33342 (nuclei—blue) and insulin immunofluorescence intensity. (d) Serum glucose levels and diabetes incidence in STZ and STZ + Fer-1-treated mice monitored at different time points (10, 14, and 22 days from initial STZ and SZT + Fer-1 dose). (e) Immunohistochemical staining of 4-HNE in the pancreas of mice treated with STZ and STZ + Fer-1 for 21 days. Graphs' values are presented as means ± SEM; statistical significance—comparison of STZ + Fer-1-treated animals with STZ control: p < 0.05. Orig. magnification and scale bars: (b) and (d) 40x, 50 μm; (c) and (e) 63x; 20 μm.
Figure 6
Figure 6
Graphically summarized finding of the current manuscript.

References

    1. Fujimoto K., Polonsky K. S. Pdx1 and other factors that regulate pancreatic beta-cell survival. Diabetes, Obesity & Metabolism . 2009;11(Suppl 4):30–37. doi: 10.1111/j.1463-1326.2009.01121.x. - DOI - PMC - PubMed
    1. Ardestani A., Paroni F., Azizi Z., et al. MST1 is a key regulator of beta cell apoptosis and dysfunction in diabetes. Nature Medicine . 2014;20(4):385–397. doi: 10.1038/nm.3482. - DOI - PMC - PubMed
    1. Kanasaki M., Srivastava S. P., Yang F., et al. Deficiency in catechol-o-methyltransferase is linked to a disruption of glucose homeostasis in mice. Scientific Reports . 2017;7(1):p. 7927. doi: 10.1038/s41598-017-08513-w. - DOI - PMC - PubMed
    1. Srivastava S. P., Goodwin J. E. Cancer biology and prevention in diabetes. Cell . 2020;9(6):p. 1380. doi: 10.3390/cells9061380. - DOI - PMC - PubMed
    1. Newsholme P., Rebelato E., Abdulkader F., Krause M., Carpinelli A., Curi R. Reactive oxygen and nitrogen species generation, antioxidant defenses, and β-cell function: a critical role for amino acids. The Journal of Endocrinology . 2012;214(1):11–20. doi: 10.1530/JOE-12-0072. - DOI - PubMed

Substances