

Analysis of Gene Expression Profiles in the Liver of Rats With Intrauterine Growth Retardation
- PMID: 35321016
- PMCID: PMC8934861
- DOI: 10.3389/fped.2022.801544
Analysis of Gene Expression Profiles in the Liver of Rats With Intrauterine Growth Retardation
Abstract
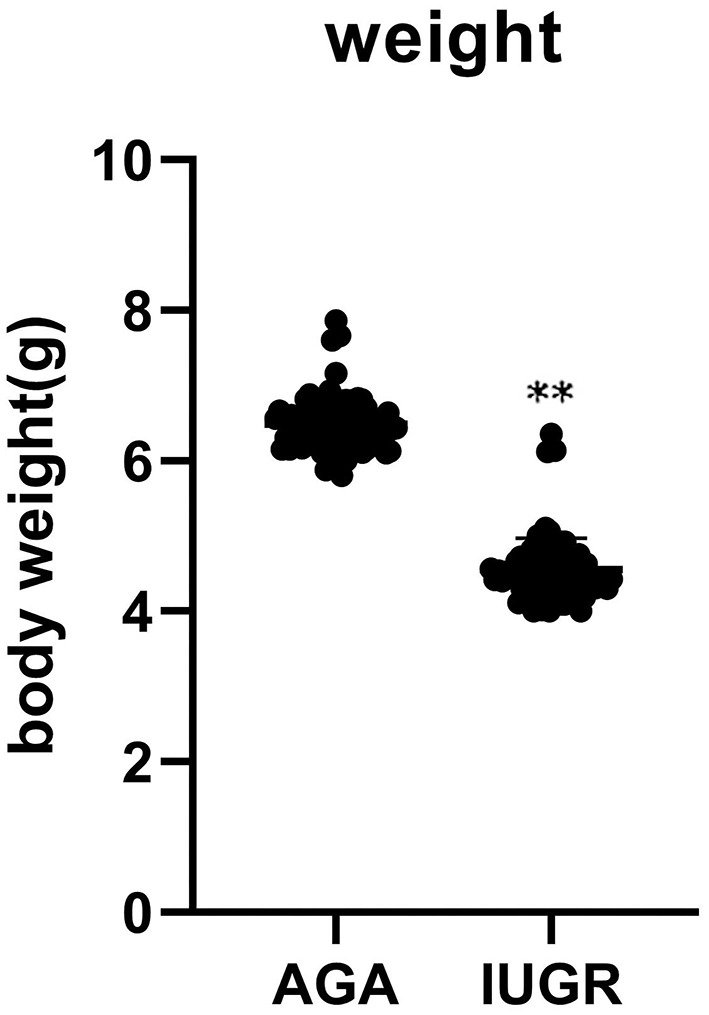
Background: Intrauterine growth restriction (IUGR) is highly associated with fetal as well as neonatal morbidity, mortality, and an increased risk metabolic disease development later in life. The mechanism involved in the increased risk has not been established. We compared differentially expressed genes between the liver of appropriate for gestational age (AGA) and IUGR rat models and identified their effects on molecular pathways involved in the metabolic syndrome.
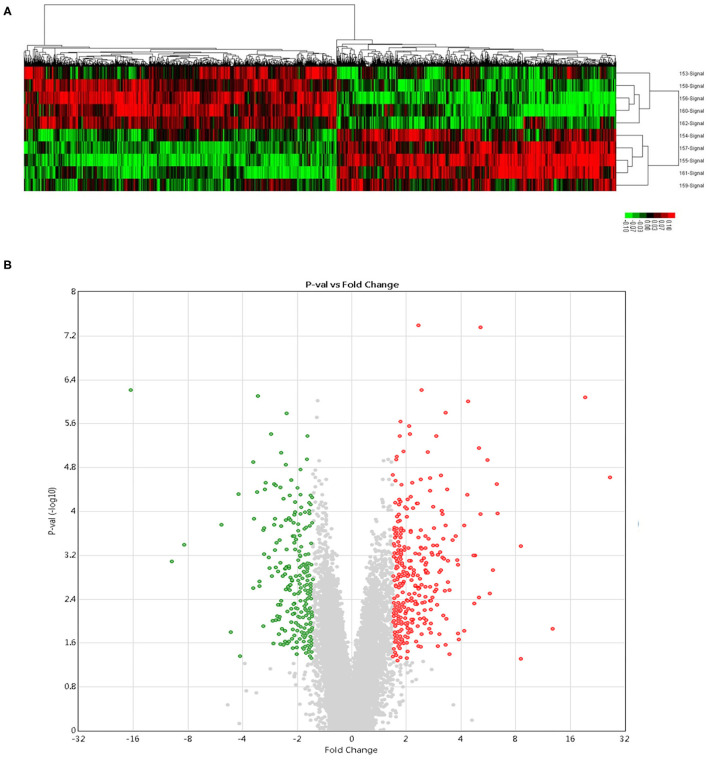
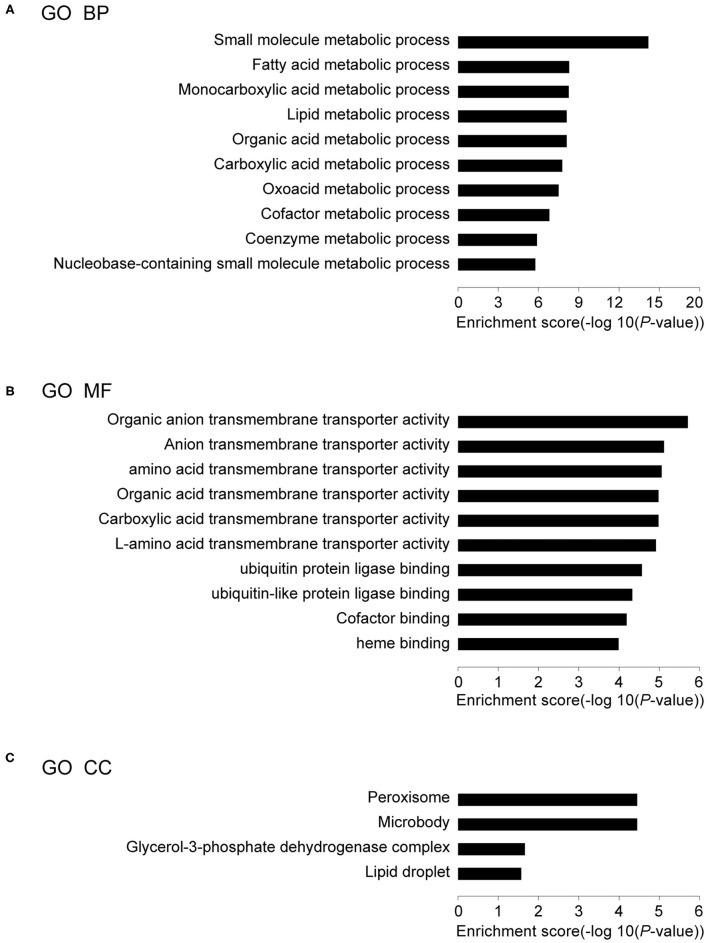
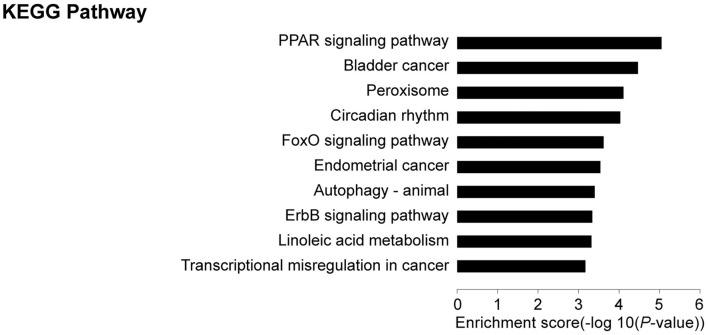
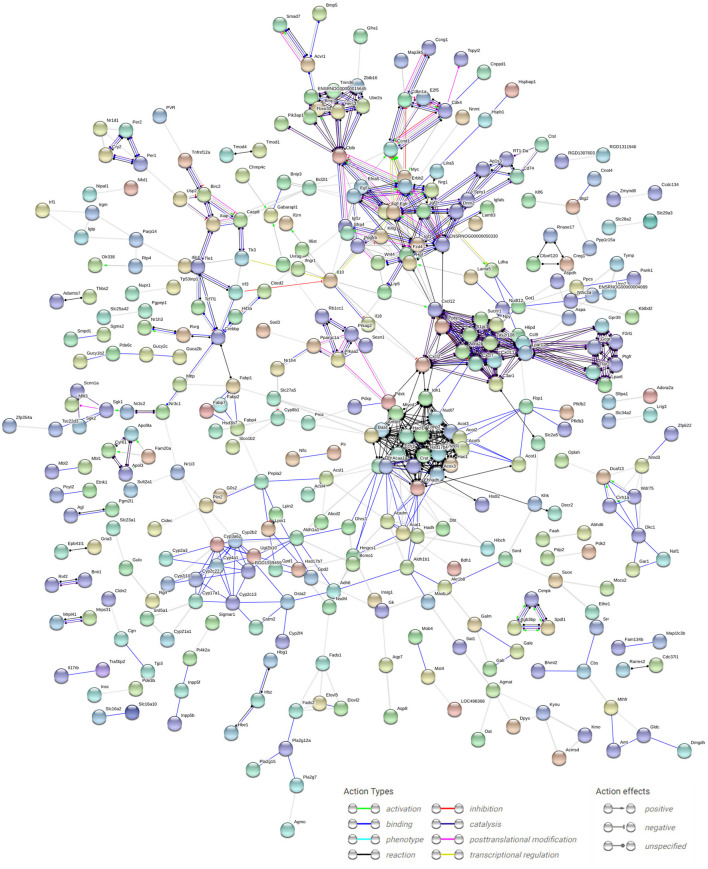
Methods: We extracted RNA from the liver of IUGR and AGA rats and profiled gene expression by microarray analysis. GO function and KEGG pathway enrichment analyses were conducted using the Search Tool for the Retrieval of Interacting Genes database. Then, the Cytoscape software was used to visualize regulatory interaction networks of IUGR-related genes. The results were further verified via quantitative reverse transcriptase PCR analysis.
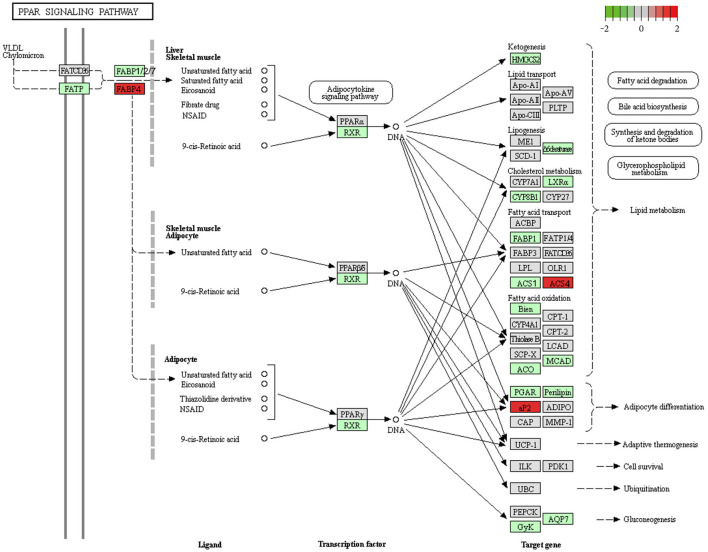
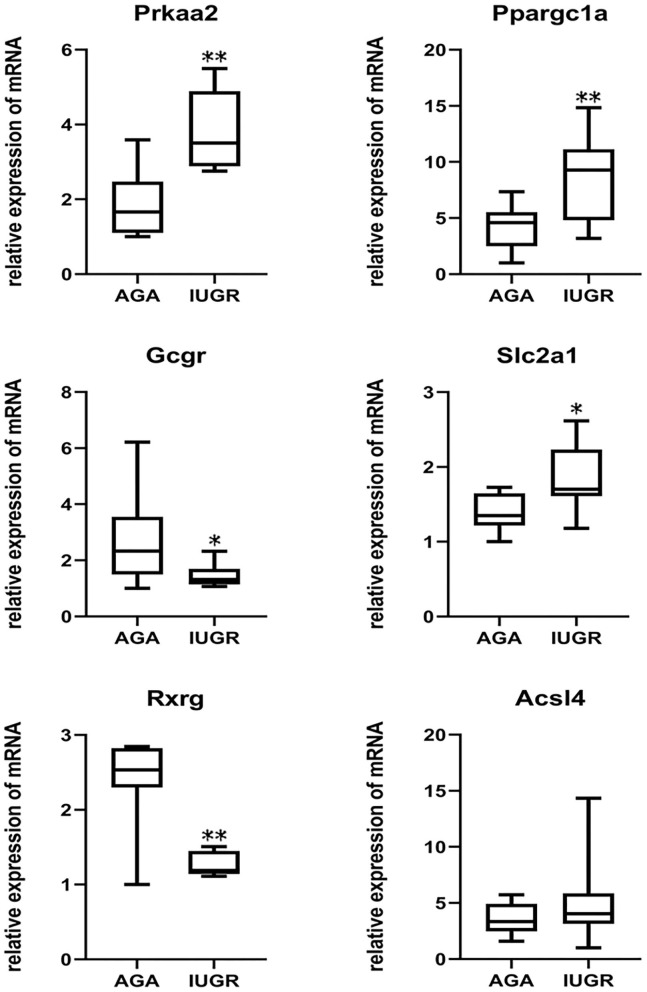
Results: In this study, 815 genes were found to be markedly differentially expressed (fold-change >1.5, p < 0.05) between IUGR and AGA, with 347 genes elevated and 468 suppressed in IUGR, relative to AGA. Enrichment and protein-protein interaction network analyses of target genes revealed that core genes including Ppargc1a, Prkaa2, Slc2a1, Rxrg, and Gcgr, and pathways, including the PPAR signaling pathway and FoxO signaling pathway, had a potential association with metabolic syndrome development in IUGR. We also confirmed that at the mRNA level, five genes involved in glycometabolism were differentially expressed between IUGR and AGA.
Conclusion: Our findings elucidate on differential gene expression profiles in IUGR and AGA. Moreover, they elucidate on the pathogenesis of IUGR-associated metabolic syndromes. The suggested candidates are potential biomarkers and eventually intended to treat them appropriately.
Keywords: IUGR; differentially expressed genes; liver; metabolic syndrome; microarray analysis.
Copyright © 2022 Shen, Zhu and Du.
Conflict of interest statement
The authors declare that the research was conducted in the absence of any commercial or financial relationships that could be construed as a potential conflict of interest.
Figures
Similar articles
-
Integrated analysis of genome-wide DNA methylation and gene expression data provide a regulatory network in intrauterine growth restriction.Life Sci. 2017 Jun 15;179:60-65. doi: 10.1016/j.lfs.2017.04.020. Epub 2017 Apr 29. Life Sci. 2017. PMID: 28465243
-
Identification of differentially methylated candidate genes and their biological significance in IUGR neonates by methylation EPIC array.J Matern Fetal Neonatal Med. 2022 Feb;35(3):525-533. doi: 10.1080/14767058.2020.1727881. Epub 2020 Feb 24. J Matern Fetal Neonatal Med. 2022. PMID: 32091279
-
DNA hypermethylation of CD3(+) T cells from cord blood of infants exposed to intrauterine growth restriction.Diabetologia. 2016 Aug;59(8):1714-23. doi: 10.1007/s00125-016-3983-7. Epub 2016 May 17. Diabetologia. 2016. PMID: 27185256
-
Association of Intrauterine Growth Restriction and Small for Gestational Age Status With Childhood Cognitive Outcomes: A Systematic Review and Meta-analysis.JAMA Pediatr. 2020 Aug 1;174(8):772-781. doi: 10.1001/jamapediatrics.2020.1097. JAMA Pediatr. 2020. PMID: 32453414 Free PMC article.
-
Fetal nutrition and timing of puberty.Endocr Dev. 2005;8:15-33. doi: 10.1159/000084084. Endocr Dev. 2005. PMID: 15722615 Review.
Cited by
-
Placental Remote Control of Fetal Metabolism: Trophoblast mTOR Signaling Regulates Liver IGFBP-1 Phosphorylation and IGF-1 Bioavailability.Int J Mol Sci. 2023 Apr 14;24(8):7273. doi: 10.3390/ijms24087273. Int J Mol Sci. 2023. PMID: 37108437 Free PMC article.
-
Intrauterine growth restriction in piglets modulates postnatal immune function and hepatic transcriptional responses independently of energy intake.Front Physiol. 2023 Oct 16;14:1254958. doi: 10.3389/fphys.2023.1254958. eCollection 2023. Front Physiol. 2023. PMID: 37916220 Free PMC article.
References
-
- Barker DJ. The fetal origins of hypertension. J of Hypertens Suppl. (1996) 14:S117–20. - PubMed
LinkOut - more resources
Full Text Sources
Miscellaneous