. 2022 Mar 24;13(3):262.
doi: 10.1038/s41419-022-04693-0.

Deficiency of N-glycanase 1 perturbs neurogenesis and cerebral development modeled by human organoids

Affiliations

Deficiency of N-glycanase 1 perturbs neurogenesis and cerebral development modeled by human organoids

Victor J T Lin et al. Cell Death Dis. .

Abstract

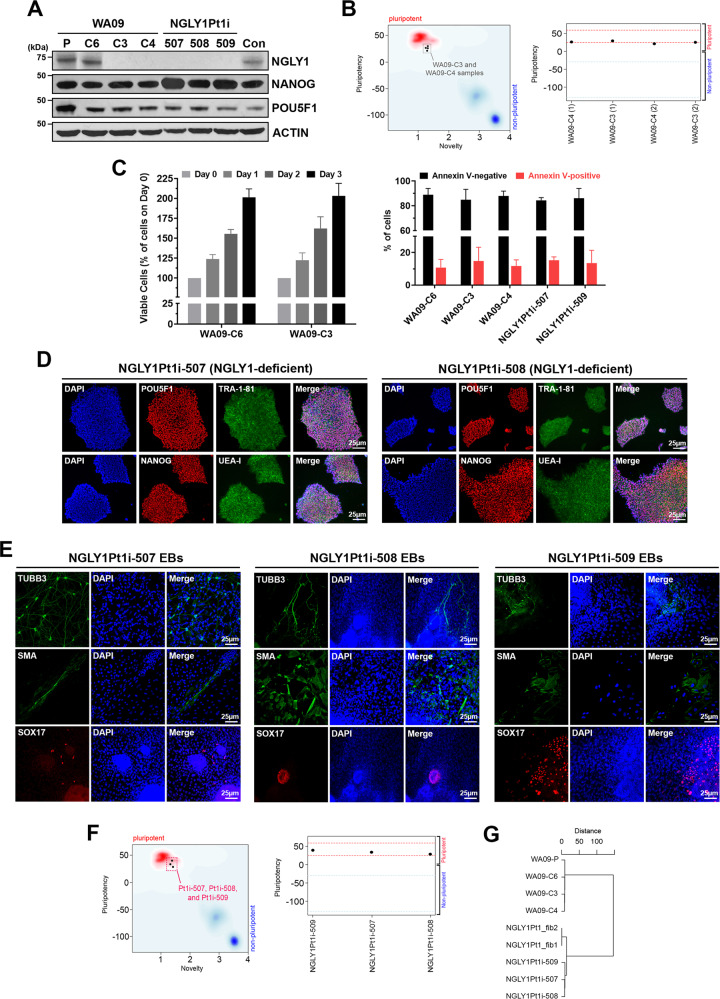
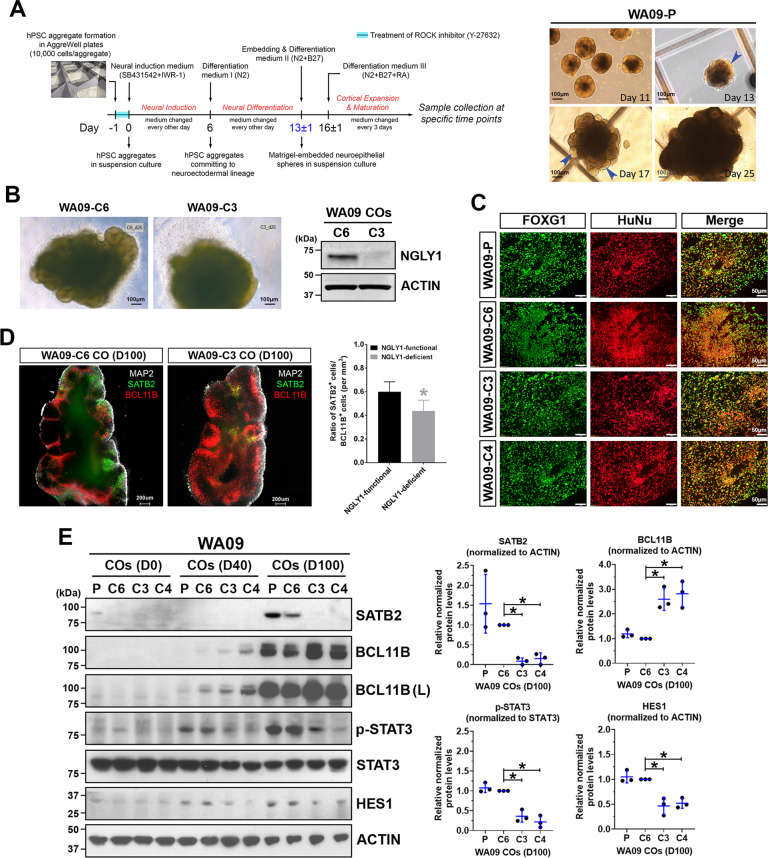
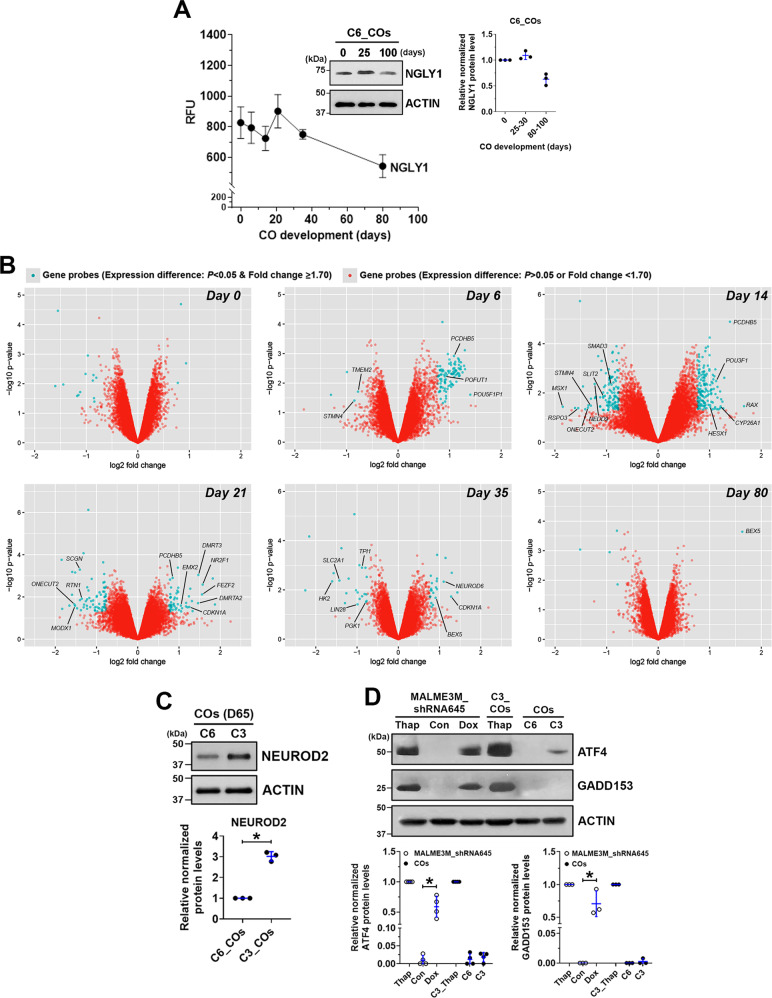
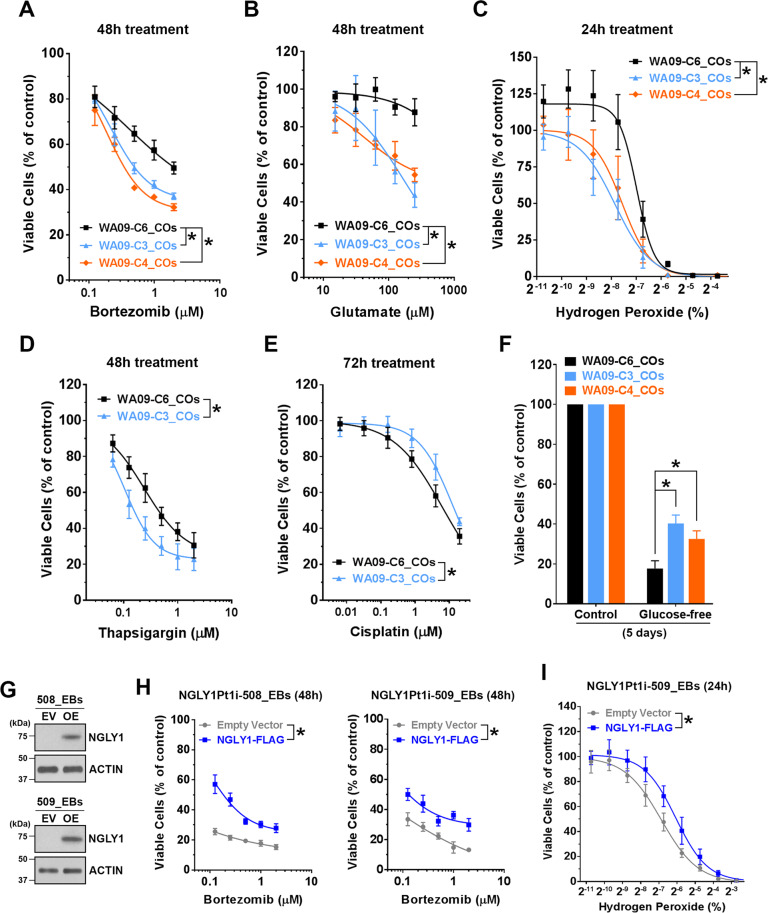
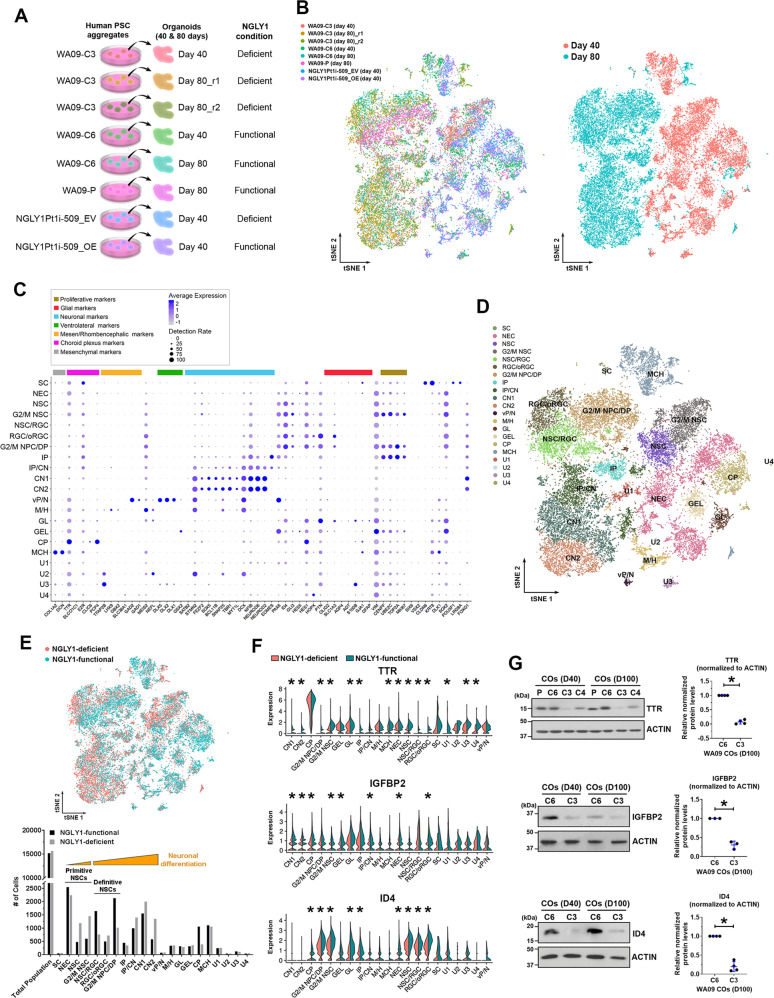
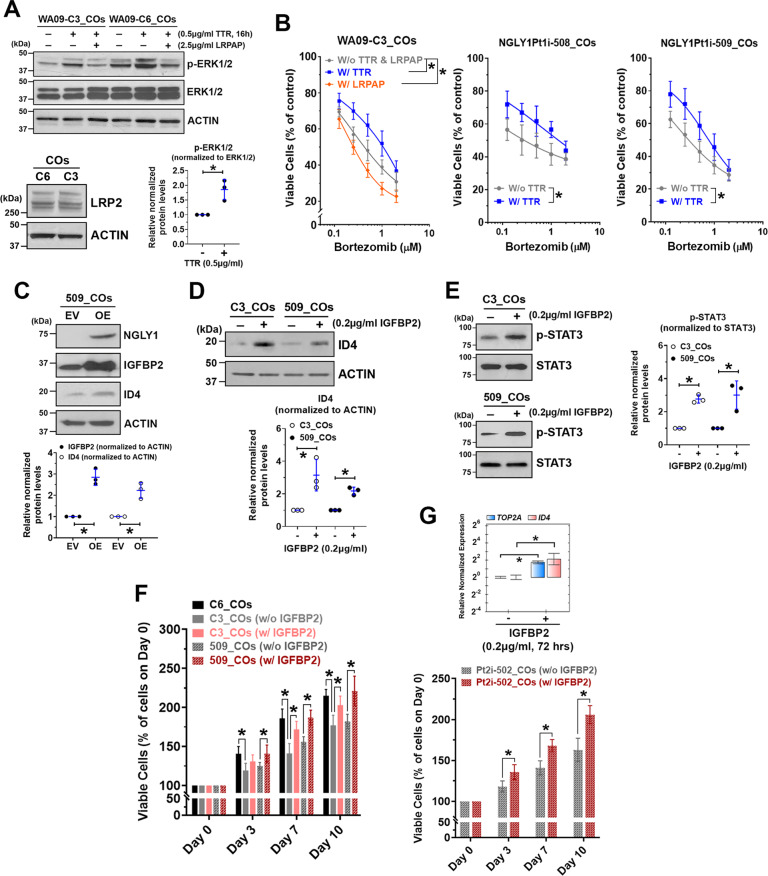
Mutations in N-glycanase 1 (NGLY1), which deglycosylates misfolded glycoproteins for degradation, can cause NGLY1 deficiency in patients and their abnormal fetal development in multiple organs, including microcephaly and other neurological disorders. Using cerebral organoids (COs) developed from human embryonic stem cells (hESCs) and induced pluripotent stem cells (hiPSCs), we investigate how NGLY1 dysfunction disturbs early brain development. While NGLY1 loss had limited impact on the undifferentiated cells, COs developed from NGLY1-deficient hESCs showed defective formation of SATB2-positive upper-layer neurons, and attenuation of STAT3 and HES1 signaling critical for sustaining radial glia. Bulk and single-cell transcriptomic analysis revealed premature neuronal differentiation accompanied by downregulation of secreted and transcription factors, including TTR, IGFBP2, and ID4 in NGLY1-deficient COs. NGLY1 malfunction also dysregulated ID4 and enhanced neuronal differentiation in CO transplants developed in vivo. NGLY1-deficient CO cells were more vulnerable to multiple stressors; treating the deficient cells with recombinant TTR reduced their susceptibility to stress from proteasome inactivation, likely through LRP2-mediated activation of MAPK signaling. Expressing NGLY1 led to IGFBP2 and ID4 upregulation in CO cells developed from NGLY1-deficiency patient's hiPSCs. In addition, treatment with recombinant IGFBP2 enhanced ID4 expression, STAT3 signaling, and proliferation of NGLY1-deficient CO cells. Overall, our discoveries suggest that dysregulation of stress responses and neural precursor differentiation underlies the brain abnormalities observed in NGLY1-deficient individuals.


Conflict of interest statement

The authors declare no competing interests.

Figures

Fig. 1
Fig. 1. WA09 hESCs with CRISPR-Cas9-introduced NGLY1 mutations and hiPSCs reprogrammed from NGLY1-deficiency patient’s fibroblasts are viable and pluripotent.
A NGLY1, NANOG, and POU5F1 protein expression detected by western blotting in hESCs and hiPSCs. WA09-P: parental WA09 hESCs. WA09-C6: a WA09 hESC clone that went through the gene-editing process but acquired no mutation in the NGLY1 gene. WA09-C3 and WA09-C4: NGLY1-deficient WA09 hESC clones derived from gene editing. NGLY1Pt1i: patient-derived hiPSCs. Con: normal individual−derived control hiPSCs. B WA09-C3 and -C4 hESCs were tested pluripotent in the Pluritest. C Cell proliferation and apoptosis in undifferentiated samples of the indicated hPSCs determined by MTT (left panel) and annexin V staining−mediated flow cytometry (right panel) analysis. All data were presented as mean ± standard deviation (n = 4). D The staining of pluripotency markers, including TRA-1-81, UEA-I, POU5F1, and NANOG, in NGLY1Pt1i-507 and NGLY1Pt1i-508 hiPSCs. E EBs containing cells relevant to three germ-layer lineages were developed from the patient-derived hiPSCs. TUBB3: an ectoderm marker. SMA: a mesoderm marker. SOX17: an endoderm marker. F The patient-derived hiPSCs were tested pluripotent in the Pluritest. G The clustering result among the indicated samples was based on their SNPs detected by WES. NGLY1Pt1_fib1 and NGLY1Pt1_fib2: NGLY1-deficiency patient’s skin fibroblast samples.
Fig. 2
Fig. 2. NGLY1-deficient COs differ from NGLY1-functional COs in their capacity to form upper-layer neurons and show alterations in critical signaling needed for radial glia.
A The schematic illustration of the protocol for CO development (left panel) used in our studies and the morphological representations of WA09-P COs at the indicated time points along development (right panel). Blue arrowheads: neuroepithelial buds, WA09-P: parental WA09 hESCs. B The representative morphology of NGLY1-functional and -deficient WA09 hESCs COs with 25 days of development. The expression of NGLY1 in the WA09-C6 (NGLY1-functional) and WA09-C3 (NGLY1-deficient) COs was confirmed by western blotting. C Both NGLY1-functional and -deficient COs positively stained for forebrain marker FOXG1 and human nuclear antigen. WA09-P and WA09-C6: NGLY1-functional. WA09-C3 and WA09-C4: NGLY1-deficient. D The representative images of optical sections taken for CO samples with SATB2, BCL11B and MAP2 staining; upper-layer (SATB2+) neurons and deeper-layer (BCL11B+) neurons (left panel). The ratios of SATB2+ and BCL11B+ cell counts in COs (n = 4 for each NGLY1 condition, *p < 0.05, t-test) for each NGLY1 condition (right panel). WA09-C6 CO: NGLY1-functional CO. WA09-C3 CO: NGLY1-deficient CO. D100: 100 days of CO development. E The expression of SATB2, BCL11B, phosphorylated STAT3, and HES1 detected by western blotting with densitometry analysis in NGLY1 functional and -deficient COs with 0, 40, and 100 days (D0, D40, and D100) of development. P and C6: NGLY1-functional COs. C3 and C4: NGLY1-deficient COs. (L): long exposure. *p < 0.05, t-test.
Fig. 3
Fig. 3. Microarray-based gene expression profiling reveals the propensity for premature differentiation in NGLY1-deficient COs compared with NGLY1-functional COs.
A The expression pattern of the NGLY1 gene transcripts in WA09-P and WA09-C6 COs (n = 4) at six time points during 80-day development. Inset: The relative expression of NGLY1 protein detected by western blotting with densitometry analysis in WA09-C6 COs at the indicated time points. B Genes that were differentially expressed (p < 0.05, fold change ≥1.7) in NGLY1-functional and -deficient COs at the indicated time points for sample collection were highlighted in blue in the volcano plots of fold change vs. statistical significance. C The differential expression of NEUROD2 detected by western blotting with densitometry analysis in NGLY1-functional and -deficient COs with 65 days (D65) of development. *p < 0.05, t-test. D The relative expression of ATF4 and GADD153 detected by western blotting with densitometry analysis in NGLY1-functional and -deficient COs and MALME3M_shRNA645 melanoma cells with doxycycline-induced knockdown of NGLY1. C6: NGLY1-functional COs. C3: NGLY1-deficient COs. Thap: 24-h treatment of 0.5 µM thapsigargin. *p < 0.05, t-test.
Fig. 4
Fig. 4. NGLY1 expression alteration within CO and EB cells affects their tolerability to different cell stressors.
COs collected at day 60 of development were dissociated to obtain CO cells. Cell viability was determined by MTT assays. A The viability of CO cells in response to bortezomib treatment. All data were presented as mean ± standard deviation (n = 3, *p < 0.05, logistic regression). WA09-P and WA09-C6: NGLY1-functional COs. WA09-C3 and WA09-C4: NGLY1-deficient COs. B The viability of CO cells in response to glutamate treatment. All data were presented as mean ± standard deviation (n = 3, *p < 0.05, logistic regression). C The viability of CO cells in response to hydrogen peroxide treatment. All data were presented as mean ± standard deviation (n = 3, *p < 0.05, logistic regression). D The viability of CO cells in response to thapsigargin treatment. All data were presented as mean ± standard deviation (n = 3, *p < 0.05, logistic regression). E The viability of CO cells in response to cisplatin treatment. All data were presented as mean ± standard deviation (n = 3, *p < 0.05, logistic regression). F The viability of CO cells in response to glucose deprivation. All data were presented as mean ± standard deviation (n = 3, *p < 0.05, t-test). EBs cultured for 14 days were dissociated to obtain EB cells for the transduction of the indicated expression vectors. G The expression of exogenous NGLY1 in the EB cells developed from NGLY1-deficiency patient−derived (NGLY1Pt1i-508 and NGLY1Pt1i-509) hiPSCs was detected by western blotting. EV: Empty/control vector. OE: NGLY1-overexpression vector. H The reduced susceptibility to the 48-h treatment of bortezomib in NGLY1Pt1i-508 and NGLY1Pt1i-509 EB cells with ectopic NGLY1 expression. All data were presented as mean ± standard deviation (n = 3, *p < 0.05, logistic regression). I The reduced susceptibility to the 24-h treatment of hydrogen peroxide in NGLY1Pt1i-508 and NGLY1Pt1i-509 EB cells with ectopic NGLY1 expression. All data were presented as mean ± standard deviation (n = 3, *p < 0.05, logistic regression).
Fig. 5
Fig. 5. Single-cell RNA sequencing (scRNA-seq) analysis molecularly phenotypes cell populations, reveals composition changes, and identifies differentially expressed genes in NGLY1-functional and -deficient COs.
A The schematic summary of different CO samples subjected to scRNA-seq analysis. B The tSNE plots of cells that were isolated from the indicated CO samples and subjected to scRNA-seq. Left panel: The tSNE plot of cells from each CO sample highlighted in a distinct color. Right panel: The tSNE plot of cells from day-40 and day-80 CO samples highlighted in distinctive colors. C Fourteen types of neural cells in the CO samples, together with choroid plexus and mesenchymal cells, were identified according to the expression profiles of 60 selected marker genes that are differentially expressed by various cell types associated with the developing brain. SC pluripotent stem cells, NEC neuroepithelial cells, NSC neural stem cells, G2/M NSC neural stem cells in G2/M phases, RGC radial glia, oRGC outer radial glia, G2/M NPC/DP: neuroprogenitors/dorsal progenitors in G2/M phases, IP: intermediate progenitors, CN1 and CN2: cortical neurons, vP/N ventral progenitors/neurons, M/H neuronal cells relevant to the midbrain/hindbrain, GL glial cells, GEL cells relevant to ganglionic eminence lateral, CP cells relevant to choroid plexus, MCH mesenchymal cells, U1–U4 unmapped cell types 1–4. D The tSNE plot of distinct cell types mapped using the expression profiles of the 60 selected marker genes. E Top panel: The tSNE plot of cells from the NGLY1-functional and -deficient CO samples highlighted in distinctive colors. Bottom panel: The number of distinct cell type identified in the NGLY1-functional and -deficient CO samples. F The violin plots of TTR, IGFBP2, and ID4 expression across the identified cell types in NGLY1-functional and -deficient CO samples. *p < 0.05, MAST test. G The relative expression of TTR, IGFBP2, and ID4 detected by western blotting with densitometry analysis in NGLY1-functional and -deficient COs with 40 and 100 days of development. P and C6: COs developed from WA09-P and WA09-C6 (NGLY1-functional) hESCs. C3 and C4: COs developed from WA09-C3 and WA09-C4 (NGLY1-deficient) hESCs. *p < 0.05, t-test.
Fig. 6
Fig. 6. Supplementing recombinant TTR and IGFBP2 to NGLY1-deficient CO cells enhances their proteasome inhibitor tolerability, NSC-relevant signaling, and proliferation.
COs collected at day 60 of development were dissociated to obtain CO cells. A Top panel: The expression and phosphorylation of ERK1/2 detected by western blotting in NGLY1-functional (WA09-C6) and -deficient (WA09-C3) CO cells with the indicated treatment of TTR and LDL receptor-related protein-associated protein 1 (LRPAP). The co-treatment of LRPAP, an LRP2 inhibitor, attenuated TTR-induced activation of MAPK signaling in the CO cells. Bottom left panel: The expression of LRP2 detected by western blotting in CO cells. Bottom right panel: The enhanced phosphorylation of ERK1/2 detected by western blotting with densitometry analysis in WA09-C3 CO cells that had TTR treatment for 16 h. *p < 0.05, t-test. B The viability of WA09-C3 CO cells in response to the indicated treatment of TTR, LRPAP, and bortezomib treatment was determined using MTT assays (left panel). W/o TTR & LRPAP: cells receiving bortezomib treatment without either TTR or LRPAP. W/TTR: cells receiving bortezomib treatment with the 4-hour pretreatment followed by 48-hour cotreatment of 0.5 µg/ml TTR. W/LRPAP: cells receiving bortezomib treatment with the concomitant treatment of 2.5 µg/ml LRPAP for 48 h. The viability of NGLY1Pt1i-508 and NGLY1Pt1i-509 CO cells in response to the indicated treatment of TTR and bortezomib was determined also using MTT assays (middle and right panels). W/o TTR: cells receiving bortezomib treatment without any TTR treatment. W/TTR: cells receiving bortezomib treatment with the 4-h pretreatment followed by 48-hour cotreatment of 0.5 µg/ml TTR. All data were presented as mean ± standard deviation (n = 3, *p < 0.05, logistic regression). C IGFBP2 and ID4 upregulation in response to the expression of exogenous NGLY1 detected by western blotting with densitometry in NGLY1Pt1i-509 CO cells. EV: Empty/control vector. OE: NGLY1 overexpression vector. *p < 0.05, t-test. D ID4 upregulation detected by western blotting with densitometry in WA09-C3 and NGLY1Pt1i-509 CO cells with IGFBP2 treatment. *p < 0.05, t-test. E The enhanced phosphorylation of STAT3 detected by western blotting with densitometry in WA09-C3 and NGLY1Pt1i-509 CO cells with IGFBP2 treatment. *p < 0.05, t-test. F The proliferation of the indicated CO cells with and without the treatment of 0.2 µg/ml IGFBP2 for the indicated periods was determined using MTT assays. All data were presented as mean ± standard deviation (n = 3, *p < 0.05, t-test). G The TOP2A and ID4 expression (top panel) and proliferation (bottom panel) of NGLY1Pt2i-502 CO cells with and without the treatment of 0.2 µg/ml IGFBP2 for the indicated periods were determined using qRT-PCR and MTT assays. All data were presented as mean ± standard deviation (n = 3, *p < 0.05, t-test).

References

    1. Huang C, Harada Y, Hosomi A, Masahara-Negishi Y, Seino J, Fujihira H, et al. Endo-beta-N-acetylglucosaminidase forms N-GlcNAc protein aggregates during ER-associated degradation in Ngly1-defective cells. Proc Natl Acad Sci USA. 2015;112:1398–403. - PMC - PubMed
    1. Caglayan AO, Comu S, Baranoski JF, Parman Y, Kaymakcalan H, Akgumus GT, et al. NGLY1 mutation causes neuromotor impairment, intellectual disability, and neuropathy. Eur J Med Genet. 2015;58:39–43. - PMC - PubMed
    1. Need AC, Shashi V, Hitomi Y, Schoch K, Shianna KV, McDonald MT, et al. Clinical application of exome sequencing in undiagnosed genetic conditions. J Med Genet. 2012;49:353–61. - PMC - PubMed
    1. Suzuki T. The cytoplasmic peptide:N-glycanase (Ngly1)-basic science encounters a human genetic disorder. J Biochem. 2015;157:23–34. - PubMed
    1. Enns GM, Shashi V, Bainbridge M, Gambello MJ, Zahir FR, Bast T, et al. Mutations in NGLY1 cause an inherited disorder of the endoplasmic reticulum-associated degradation pathway. Genet Med. 2014;16:751–8. - PMC - PubMed

Publication types

MeSH terms

Substances