. 2022 Mar 23;13(1):1571.
doi: 10.1038/s41467-022-28986-2.

Lower novelty-related locus coeruleus function is associated with Aβ-related cognitive decline in clinically healthy individuals

Affiliations

Lower novelty-related locus coeruleus function is associated with Aβ-related cognitive decline in clinically healthy individuals

Prokopis C Prokopiou et al. Nat Commun. .

Abstract

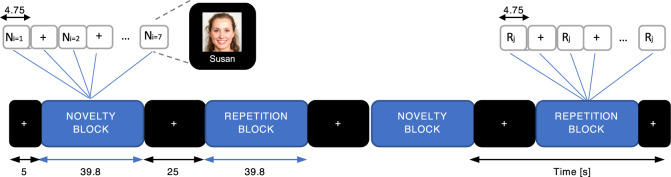
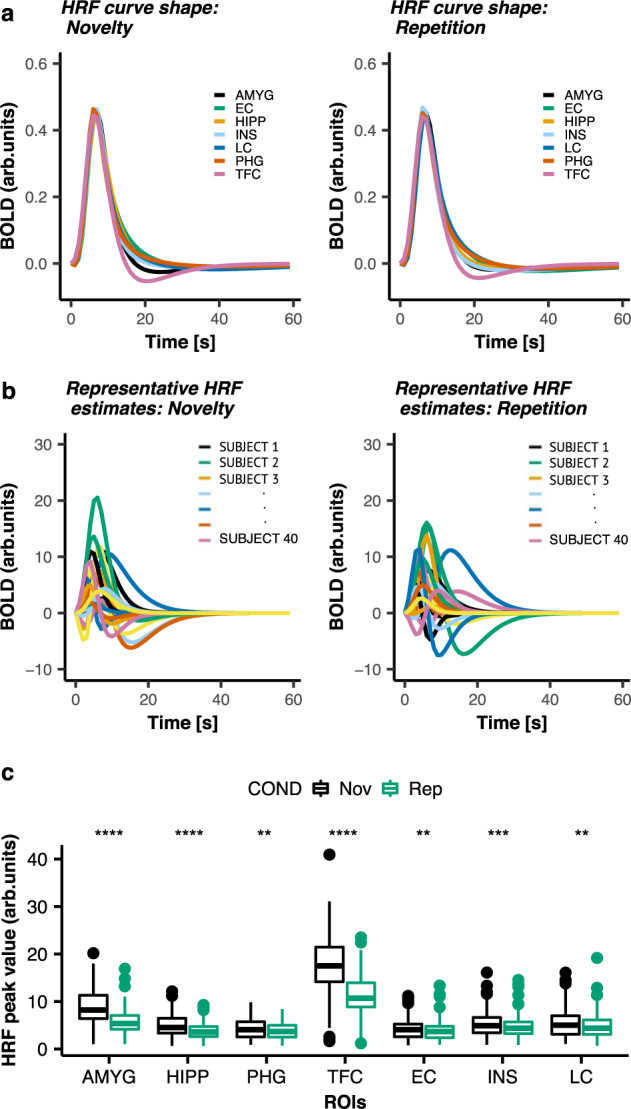
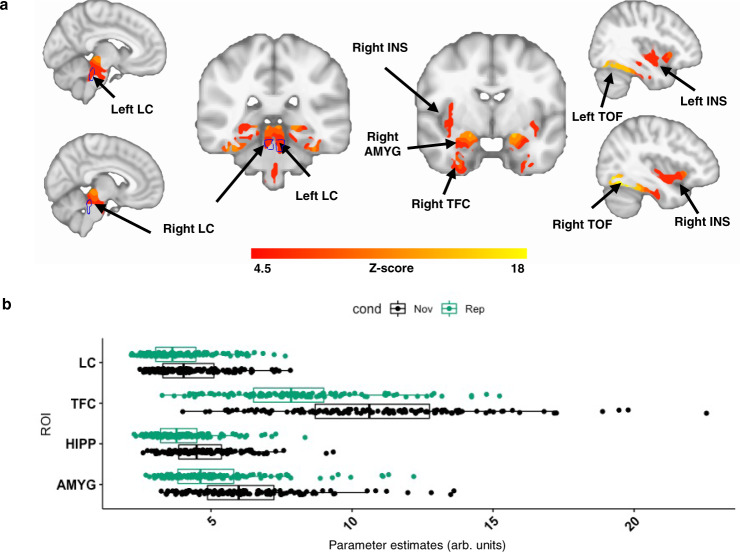
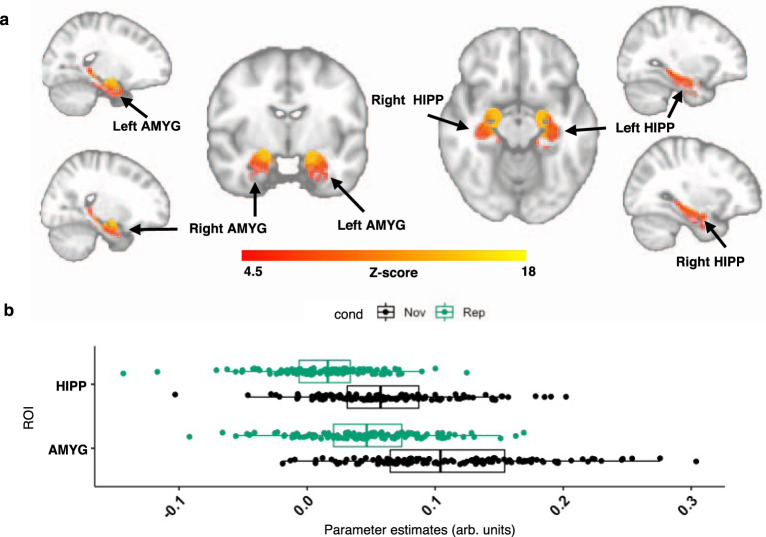
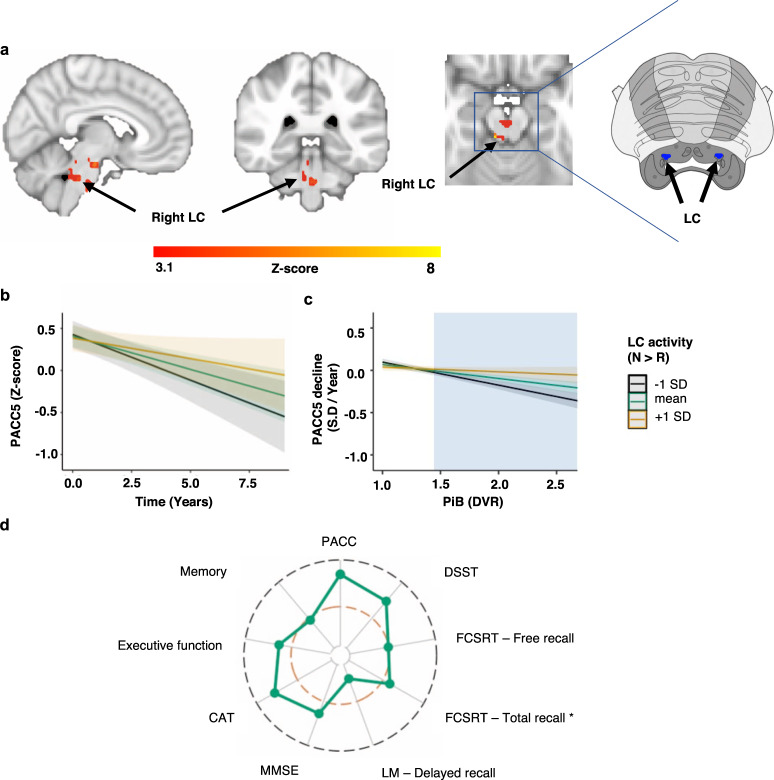
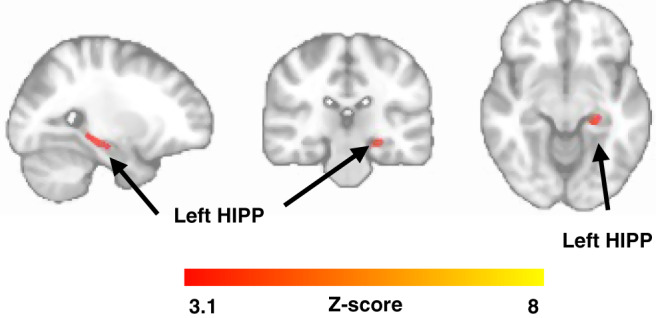
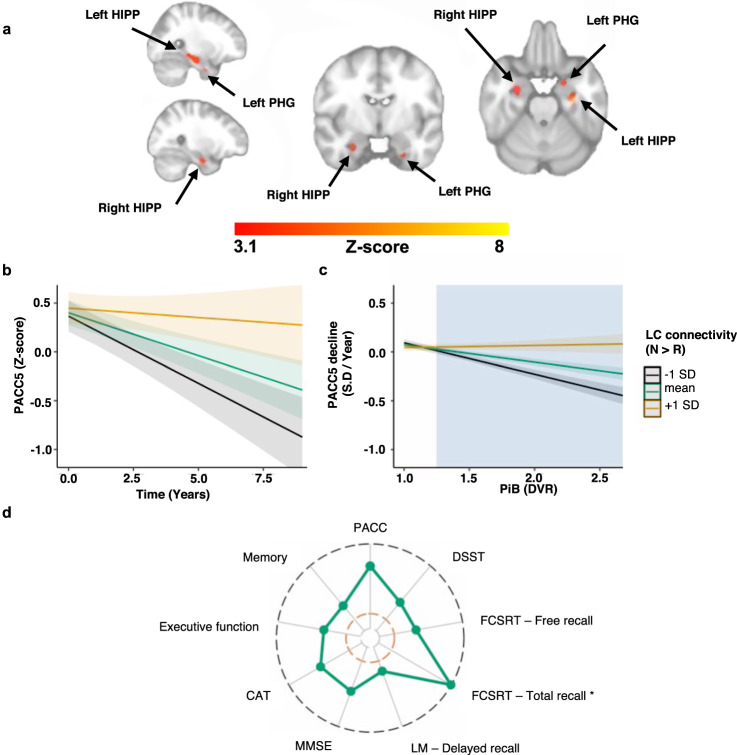
Animal and human imaging research reported that the presence of cortical Alzheimer's Disease's (AD) neuropathology, beta-amyloid and neurofibrillary tau, is associated with altered neuronal activity and circuitry failure, together facilitating clinical progression. The locus coeruleus (LC), one of the initial subcortical regions harboring pretangle hyperphosphorylated tau, has widespread connections to the cortex modulating cognition. Here we investigate whether LC's in-vivo neuronal activity and functional connectivity (FC) are associated with cognitive decline in conjunction with beta-amyloid. We combined functional MRI of a novel versus repeated face-name paradigm, beta-amyloid-PET and longitudinal cognitive data of 128 cognitively unimpaired older individuals. We show that LC activity and LC-FC with amygdala and hippocampus was higher during novelty. We also demonstrated that lower novelty-related LC activity and LC-FC with hippocampus and parahippocampus were associated with steeper beta-amyloid-related cognitive decline. Our results demonstrate the potential of LC's functional properties as a gauge to identify individuals at-risk for AD-related cognitive decline.


Conflict of interest statement

K.V.P. is funded by NIA grant K23 AG053422-01 and the Alzheimer’s Association and has served as a paid consultant for Biogen. A.P.S. has been a paid consultant for Janssen, Biogen, Qynapse, and NervGen. D.M.R. has done consulting for Biogen, Idec and Digital Cognition Technologies and served on the Scientific Advisory Board for Neurotrack. R.F.B is funded by grants from the NIH K99/R00 (R00AG061238) and the Alzheimer’s Association. Y.T.Q is funded by grants from the NIH NIA (R01 AG054671, R01AG066823), the Alzheimer’s Association, and Massachusetts General Hospital ECOR, and has served as a paid consultant for Biogen. K.A.J. has served as paid consultant for Janssen, Genzyme, Novartis, Biogen, Roche, and AC Immune. He is a site co-investigator for Lilly/Avid and Janssen, and receives research support for clinical trials from Eisai, Lilly and Cerveau. K.A.J. received funding from NIH grants R01 EB014894, R21 AG038994, R01 AG026484, R01 AG034556, P50 AG00513421, U19 AG10483, P01 AG036694, R13 AG042201174210, R01 AG027435, and R01 AG037497 and the Alzheimer’s Association grant ZEN-10-174210. RAS has served as a paid consultant for AC Immune, Acumen, Alnylam, Biogen, Cytox, Genentech, Ionis, Janssen, JOMDD, Neuraly, Neurocentria, Oligomerix, Prothena, Renew, Roche, Shionogi and receives research support for clinical trials from Alzheimer’s Association, Eisai, Eli Lilly and Co. and NIA. She also receives research support from the following grant: P01 AG036694, U01 AG032438, U01 AG024904, R01 AG037497, R01 AG034556, K24 AG0350007, P50 AG005134, U19 AG010483, R01 AG027435, Fidelity Biosciences, Harvard NeuroDiscovery Center and the Alzheimer’s Association. These relationships are not related to the content in the manuscript. All other authors report no relevant conflicts.

Figures

Fig. 1
Fig. 1. Design of fMRI-paradigm.
Diagram of the face-name associative paradigm. The task comprised events of unfamiliar and familiar face-name pairs organized within blocks of novelty and repetition, respectively. The novelty blocks consisted of 7 face-name pairs (Ni, i = 1,..7). The repetition blocks consisted of 7 trials during which two face-name pairs were alternated, one male and one female. (Rj, j = 1,2). The novelty, repetition and visual fixation (+) blocks, as well as the events within the blocks (Ni, i = 1,…7; Rj, j = 1,2; +) are depicted along with their corresponding duration. Each block was shown twice and alternated with visual fixation blocks. One functional run lasted for 4 min and 5 s, and a total of 6 functional runs were presented to each participant. The face shown in the diagram is fake, non-identifiable and was generated using artificial intelligence, for illustration purposes of the fMRI-task only.
Fig. 2
Fig. 2. Regional variability of the hemodynamic response function.
a Group HRF curve shapes obtained within ROIs during Novelty (left panel) or Repetition (right panel). b Representative subject-specific HRF estimates obtained for the LC during Novelty (left panel) and Repetition (right panel) for 40 representative participants (each color represents a different, randomly chosen participant). The x-axis is the time [seconds]. The y-axis is the BOLD signal intensity [arb. units]. c Statistical comparisons of the averaged HRF amplitude (HRF peak values) across runs obtained within ROIs during NvR (number of participants n = 128). On a group level the HRF curve shapes exhibited similar dynamics (peak latency and width (FWHM of the peak)) between the two experimental conditions. However, the HRF amplitude was significantly larger during Novelty compared to Repetition. ** p < 0.01; *** p < 0.001; **** p < 0.0001 (uncorrected); two-tailed paired t-test. Horizontal lines within boxes indicate the median. The bottom and top part of the boxes indicate the 25th and 75th percentile of the underlying HRF amplitude distribution, respectively. Dots represent outliers. Detailed statistics are provided in Supplementary Table 3 in the Supplementary material. Abbreviations: AMYG amygdala, COND condition, EC entorhinal cortex, HiPP hippocampus, INS insula, LC locus coeruleus, Nov novelty, PHG parahippocampal gyrus, Rep repetition, TFC temporal fusiform cortex.
Fig. 3
Fig. 3. Voxel-wise analysis of brain activity in predefined regions of interest during Novelty versus Repetition.
a Brain activation maps obtained during NvR face-name stimuli: greater activation during NvR of voxels within the bilateral LC (indicated by the blue outline), amygdala, hippocampus, insula, temporal occipital fusiform cortices, entorhinal cortex and parahippocampal gyrus. Inference was performed using mixed-effects models including NvR contrast estimates as outcome variable, age and sex as fixed effects, random intercepts for participants, and slopes for fMRI runs. The brain activation maps were corrected for multiple comparisons using cluster-extent-based thresholding (number of participants n = 128; cluster defining threshold Z > 4.5, two-tailed p < 0.05, FWER-corrected). The outline of the LC ROI shown in blue was defined based on the Keren et al. (2009) LC atlas. b Boxplots of averaged parameter estimate (PE) values across runs obtained for each participant and experimental condition in representative ROIs including the bilateral LC, temporal fusiform cortex, hippocampus and amygdala. Vertical lines within boxes indicate the median. The left and right part of the boxes indicate the 25th and 75th percentile of the underlying PE distribution, respectively. Dots represent averaged PE values across runs (number of participants n = 128). The ROIs were defined as the overlap between the regions exhibiting significant activation in (a) and anatomically defined regions derived from FreeSurfer (FS). The coordinates of the peak voxels of the detected clusters are provided in Supplementary Table 8. Abbreviations: AMYG amygdala, cond condition, HIPP hippocampus, INS insula, LC locus coeruleus, Nov novelty, Rep repetition, TFC temporal fusiform cortex, TOF temporal occipital fusiform cortex.
Fig. 4
Fig. 4. Voxel-wise analysis of LC functional connectivity in predefined regions of interest during Novelty versus Repetition.
a Functional connectivity maps between the LC and the predefined ROIs obtained during NvR face-name associations: greater FC between the LC and the amygdala as well as hippocampus during NvR. Inference was performed using mixed-effects models including NvR LC-FC contrast estimates as outcome variable, age and sex as fixed effects, random intercepts for participants and slopes for fMRI runs. The FC maps were corrected for multiple comparisons using cluster-extent-based thresholding (number of participants n = 128; cluster defining threshold Z > 4.5, two-tailed p < 0.05, FWER-corrected). b Boxplots of averaged gPPI parameter estimates (PE) for each participant and experimental condition in the bilateral hippocampus and amygdala. Vertical lines within boxes indicate the median. The left and right part of the boxes indicate the 25th and 75th percentile of the underlying PE distribution, respectively. Dots represent averaged PE values across runs (number of participants n = 128). The gPPI PE values obtained during Novelty were significantly larger than those during Repetition. The coordinates of the peak voxels of the detected clusters are provided in Supplementary Table 9. Abbreviations: AMYG amygdala, cond condition, HIPP hippocampus, Nov novelty, Rep repetition.
Fig. 5
Fig. 5. Lower novelty-related LC activity is associated with steeper Aβ-related PACC5 decline.
a Voxel-wise analyses relating NvR activity, PiB and longitudinal PACC5 measurements: lower NvR activation in the right LC and right parahippocampal gyrus are associated with greater decline on the PACC5 when PiB is elevated. Inference was performed using mixed-effects models including PACC5 as outcome variable, NvR contrast estimates, time, PiB, their interactions, age, sex and years of education as fixed effects, random intercepts for participants and slopes for time (number of years between baseline and follow-up cognitive assessments). Brain activation maps were corrected for multiple comparisons using cluster-extent-based thresholding (number of participants n = 128 and number of observations is 753; cluster defining threshold Z > 3.1, two-tailed p < 0.05, FWER-corrected). The insert on the right side shows the corresponding slice of the brainstem from the Duvernoy’s atlas (adapted by permission from Springer Nature: Springer Science & Business Media). The LC is indicated with red markers. b, c Associations between PACC5 over time and LC activity during NvR. b Visualization of the two-way interaction between LC activity and time (number of participants n = 128 and number of observations is 753). c Visualization of the interaction between LC NvR activity and PiB on PACC5 slopes (number of participants n = 128). The cyan box illustrates the range of PiB values at which NvR LC activity is associated with PACC5 decline. In all line plots, the estimated marginal mean of the interaction terms is plotted at the mean (green), +1 SD (yellow) and −1 SD (black), but analyses were done continuously. Inference was performed using linear regression including PACC5 decline as outcome variable, and NvR LC activity, PiB, their interaction, age, sex, and years of education as predictor variables. Shaded areas around the fit lines show 95% CI. d Radar chart showing the magnitude of the associations (estimate/standard error) between LC NvR activity and PiB-related cognitive decline on the subtests of the PACC5, as well as the executive function and memory composite scores (number of participants n = 128 and number of observations is 753). The inner orange line indicated t-value = 1.96. The outer black line indicated t-value = 4.00. More detailed results are provided in Supplementary Table 5. * Random effects were modeled using only a random intercept for each subject. Abbreviations: CAT Category Fluency Test, DSST Digit-Symbol Substitution Test, DVR Distribution volume ratio, FCSRT Free and Cued Selective Reminder Test, LC locus coeruleus, LM Logical Memory, MMSE Mini-Mental State Examination, PiB Pittsburgh Compound-B, PACC5 Preclinical Alzheimer Cognitive Composite, SD standard deviation.
Fig. 6
Fig. 6. Lower novelty-related FC between the LC and the left hippocampus is associated with PACC5 decline.
Voxel-wise analysis relating NvR LC-FC and longitudinal PACC5 measurements: lower NvR FC between the LC and the left hippocampus is associated with decline on the PACC5. Inference was performed using mixed-effects models including PACC5 as outcome variable, NvR LC-FC contrast estimates, time, their interactions, age, sex and years of education as fixed effects, random intercepts for participants and slopes for time (number of years between baseline and follow-up cognitive assessments). The FC maps were corrected for multiple comparisons using cluster-extent-based thresholding (number of participants n = 128 and number of observations is 753; cluster defining threshold Z > 3.1, two-tailed p < 0.05, FWER-corrected). Abbreviation: HIPP hippocampus.
Fig. 7
Fig. 7. Lower novelty-related FC between the LC and bilateral hippocampus as well as parahippocampal gyrus are associated with steeper Aβ-related PACC5 decline.
a Voxel-wise analyses relating LC- region of interest FC, PiB, and longitudinal PACC5 measurements: lower NvR functional connectivity between the LC and the bilateral hippocampus and parahippocampal gyrus is associated with greater decline on the PACC5, in particular in individuals with elevated PiB. Inference was performed using mixed-effects models including PACC5 as outcome variable, NvR LC-FC contrast estimates, time, PiB, their interactions, age, sex, and years of education as fixed effects, random intercepts for participants, and slopes for time (number of years between baseline and follow-up cognitive assessments). The maps were corrected for multiple comparisons using cluster-extent-based thresholding (number of participants n = 128 and number of observations is 753; cluster defining threshold Z > 3.1, two-tailed p < 0.05, FWER-corrected). b Visualization of the association between PACC5 performance over time and NvR FC between the LC and the group of voxels within the bilateral hippocampus and parahippocampal gyrus shown in Fig. 7a. c Visualization of the interaction between NvR LC-FC and PiB on PACC5 slopes (number of participants n = 128). The cyan box illustrates the range of PiB values at which lower NvR LC- hippocampus and parahippocampus FC is associated with PACC5 decline. In all line plots, the estimated marginal mean of the interaction terms is plotted at the mean (green), +1 SD (yellow), and −1 SD (black), but analyses were done continuously. Inference was performed using linear regression including PACC5 decline as outcome variable, and NvR LC-FC, PiB, their interaction, age, sex and years of education as predictor variables. Shaded areas around the fit lines show 95% CI. d Radar chart showing the magnitude of the associations (estimate/standard error) between NvR LC- hippocampus and parahippocampus FC and PiB-related cognitive decline on the subtests of the PACC5, as well as the executive function and memory composite scores (number of participants n = 128 and number of observations is 753). The inner orange line indicates t-value = 1.96. The outer black line indicates t-value = 10.00. More detailed results are provided in Supplementary Table 7. * Random effects were modeled using only a random intercept for each subject. Abbreviations: CAT Category Fluency Test, DSST Digit-Symbol Substitution Test, DVR Distribution volume ratio, FCSRT Free and Cued Selective Reminder Test, HIPP hippocampus, LC locus coeruleus, LM Logical Memory, MMSE Mini-Mental State Examination, PHG parahippocampal gyrus, PiB Pittsburgh Compound-B, PACC5 Preclinical Alzheimer Cognitive Composite and SD Standard Deviation.

Comment in

Similar articles

Cited by

References

    1. Lane CA, Hardy J, Schott JM. Alzheimer’s disease. Eur. J. Neurol. 2018;25:59–70. - PubMed
    1. Braak H, Tredici KD. The pathological process underlying Alzheimer’s disease in individuals under thirty. Acta Neuropathol. 2011;121:171–181. - PubMed
    1. Weinshenker D. Long road to ruin: noradrenergic dysfunction in neurodegenerative disease. Trends Neurosci. 2018;41:211–223. - PMC - PubMed
    1. Muresan Z, Muresan V. Neuritic deposits of amyloid-beta peptide in a subpopulation of central nervous system-derived neuronal cells. Mol. Cell Biol. 2006;26:4982–4997. - PMC - PubMed
    1. Muresan Z, Muresan V. Seeding neuritic plaques from the distance: a possible role for brainstem neurons in the development of Alzheimer’s disease pathology. Neurodegener. Dis. 2008;5:250–253. - PMC - PubMed

Publication types

MeSH terms