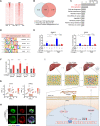
. 2022 Mar 24;13(3):261.
doi: 10.1038/s41419-022-04689-w.

Single cell transcriptional diversity and intercellular crosstalk of human liver cancer

Affiliations

Single cell transcriptional diversity and intercellular crosstalk of human liver cancer

Yan Meng et al. Cell Death Dis. .

Abstract

Liver cancer arises from the evolutionary selection of the dynamic tumor microenvironment (TME), in which the tumor cell generally becomes more heterogeneous; however, the mechanisms of TME-mediated transcriptional diversity of liver cancer remain unclear. Here, we assess transcriptional diversity in 15 liver cancer patients by single-cell transcriptome analysis and observe transcriptional diversity of tumor cells is associated with stemness in liver cancer patients. Tumor-associated fibroblast (TAF), as a potential driving force behind the heterogeneity in tumor cells within and between tumors, was predicted to interact with high heterogeneous tumor cells via COL1A1-ITGA2. Moreover, COL1A1-mediated YAP-signaling activation might be the mechanistic link between TAF and tumor cells with increased transcriptional diversity. Strikingly, the levels of COL1A1, ITGA2, and YAP are associated with morphological heterogeneity and poor overall survival of liver cancer patients. Beyond providing a potential mechanistic link between the TME and heterogeneous tumor cells, this study establishes that collagen-stimulated YAP activation is associates with transcriptional diversity in tumor cells by upregulating stemness, providing a theoretical basis for individualized treatment targets.


Conflict of interest statement

The authors declare no competing interests.

Figures
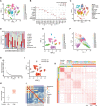
Fig. 1
Fig. 1. Transcriptomic diversity of liver cancer patients.
A t-SNE plot of all single cells from 15 primary liver cancer patients (indicated by colors). B Bubble chart shows the expression of canonical marker genes for annotating the cell types. C t-SNE plot of cell types from tumors (indicated by colors). Cells were annotated as T cells, B cells, TAFs, TAMs, LSECs, and HPC-like based on known lineage-specific marker genes (from B). The malignant cells were identified by infering CNV. D Stacked bar plots showing the cell composition of the 15 samples. E t-SNE plot of tumor cells from 15 tumors (indicated by colors). F Principal-component analysis (PCA) of tumor cells from 15 tumors. G PCA of tumor cells. Eigenvalue corresponding to each PC. H Transcriptomic diversity score of tumor samples according to the median value of diversity. Data are presented as the means ± SEM. I tumor cells t-SNE plot of tumor cells from the diversity-low (gray dots, L1-4) and diversity-high (red dots, H1-6) groups. J, K Pairwise correlation of all tumor cells from 15 liver cancer patients. Each pixel in the heatmap represents a correlation of two cells (the corresponding row and column). At least two independent experiments were performed for all data. For curve Figures and bar Figures, data are presented as means ± SD. Unpaired Student’s t-tests were used for comparing two variables. One-way ANOVA was used for multiple variables comparison.
Fig. 2
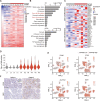
Fig. 2. Tumor cells in diversity-high group possess stemness characteristics.
A Heatmap of upregulated genes of tumor cells in the diversity-high groups compared to diversity-low groups. B Gene Ontology (GO) and Kyoto Encyclopedia of Genes and Genomes (KEGG) analysis of upregulated genes of diversity-high groups in Fig. 2A. C Heatmap of genes in diversity-high and diversity-low groups belong to stem cell differentiation and stem cell maintenance gene sets. D Violin plot of stem cell differentiation scores for the clusters in Fig. 2A. E t-SNE plots showing the expression levels of ICAM1, SOX4, ALDH1A1 and BMI1 from the diversity-high and diversity-low groups of tumor cells. F Staining of SOX4 and BMI1 in tumor tissue from liver cancer patients. Bar, 100μm. At least two independent experiments were performed for all data. For curve Figures and bar Figures, data are presented as means ± SD. Unpaired Student’s t-tests were used for comparing two variables. One-way ANOVA was used for multiple variables comparison.
Fig. 3
Fig. 3. Composition of tumor microenvironment derived from diversity-low and diversity-high groups.
A, B t-SNE plot of nontumor cells from 15 tumors (indicated by colors). C t-SNE plot of TAFs, TAMs and LSECs from the diversity-low (gray dots) and diversity-high (red dots) groups. D t-SNE plot showing clusters identified by integrated analysis of TAMs and TAFs in diversity-low and diversity-high tumors. E Heatmap and KEGG analysis of genes in clusters of TAFs. At least two independent experiments were performed for all data. For curve Figures and bar Figures, data are presented as means ± SD. Unpaired Student’s t-tests were used for comparing two variables. One-way ANOVA was used for multiple variables comparison. See also Fig. S1.
Fig. 4
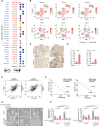
Fig. 4. Crosstalk between TAF and Tumor cells.
A The bubble plot of ligands and receptors involved in significant L-R pairs between TAFs and tumor cells from diversity-high tumors. B t-SNE plots showing the expression profiles of COL1A1, COL4A1, and COL6A2 of TAF in the diversity-high and diversity-low groups. The level of ITGA2, ITGAV, and ITGA1 from the diversity-high and diversity-low groups of tumor cells. C Representative cores of COL1A1 and ITGA2 staining in the tissue microarray. Bar, 100 μm. D Positivity for the expression of COL1A1 and ITGA2 in the tissue microarray. E The correlation between COL1A1/2 and ITGA2 in TCGA patients. F Kaplan-Meier survival analysis of COL1A1 and ITGA2 at high or low levels in tumors from the TCGA database. G, H The capacity of colony formation was detected by sphere formation assays in Huh7 cell lines. Cells with or without co-cultured with CAFs were knocked down ITGA2 or treated with COL1A1 inhibitor for 3 days. Bar, 100 µm. At least two independent experiments were performed for all data. For curve Figures and bar Figures, data are presented as means ± SD. Unpaired Student’s t-tests were used for comparing two variables. One-way ANOVA was used for multiple variables comparison. *P < 0.05; **P < 0.01; ***P < 0.001; n.s, no significance in comparison with control group. See also Fig. S2.
Fig. 5
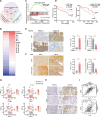
Fig. 5. YAP signaling with the potential to involve in the diversity of liver cancer.
A Integrative analysis of data from the scRNA-seq screen with publicly available databases of liver cancer from the TCGA. B Heatmap of genes with increased expression in tumor cells from diversity-high group. The color of each group represents the average gene abundance. C Gene set enrichment analysis (GSEA) analysis showing significant positive enrichment of YAP signaling with upregulated genes in tumor cells from the diversity-high group. D Kaplan-Meier survival analysis of patients with YAP at high or low protein levels from The Cancer Proteome Atlas (TCPA). E, F Staining of YAP in tumor tissues from liver cancer patients and rats treated with DEN up to 16 weeks. Bars, 100 µm. G t-SNE plots showing the expression levels of YAP, CTGF, CYR61 and MYC in tumor cells of diversity-high and diversity-low groups. H Representative cores of YAP, BMI1, and SOX4 staining in the tissue microarray. Bar, 100 μm. I Pearson correlation analysis of the mRNA levels between BMI1/SOX4 and YAP in liver cancer patients from the TCGA database. At least two independent experiments were performed for all data. Quantified data are presented as the means ± SD. Unpaired Student’s t tests were used for comparing two variables and one-way ANOVA was used for comparing multiple variables. *P < 0.05; **P < 0.01; ***P < 0.001; n.s, no significance in comparison with the control group. See also Fig. S3.
Fig. 6
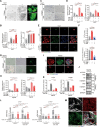
Fig. 6. Collagen-mediated YAP activation is predicted to relate with diversity by enhancing stemness of tumor cells.
A, B The capacity of colony formation was detected by sphere formation assays in Huh7 (liver cancer cell line). Cells with or without YAP overexpression (GFP-labeled) were treated with low (1 µL collagen with 3 µL DMEM) or high (collagen without DMEM) concentrations of collagen for 3 days. Bar, 200 µm. C, D The capacity of colony formation was detected by sphere formation assays in Huh7 cells. Cells with or without YAP knockdown were treated with low (1 µL collagen with 3 µL DMEM) or high (collagen without DMEM) concentrations of collagen for 3 days. Bar, 200 µm. E, F Staining of YAP in Huh7 cells cultivated with low or high concentrations of collagen for 3 days, 200 µm. G, H The capacity of colony formation was detected by sphere formation assays in HepG2 (liver cancer cell lines). Cells with or without ITGA2 knockdown (GFP-labeled) were treated with low (1 µL collagen with 3 µL DMEM) or high (collagen without DMEM) concentrations of collagen for 3 days. Bar, 200 µm. I Staining of YAP and ITGA2 in HepG2 cells (with or without ITGA2 knockdown) for 3 days, 200 µm. J Subcellular localization of YAP in WT and ITGA2-knockdown HepG2 cells. K ChIP experiment of CTGF and CYR61 performed with YAP antibody in HepG2 cells knockdown ITGA2. L mRNA levels of CTGF and CYR61 in WT and ITGA2-knockdown Huh7 cells with or without co-cultured with TAFs. M Staining of COL1A1, ITGA2, and YAP in tumors from liver cancer patients. Bars, 100 µm. Quantified data are presented as the means ± SD. Unpaired Student’s t tests were used for comparing two variables and one-way ANOVA was used for comparing multiple variables. At least two independent experiments were performed for all data. *P < 0.05; **P < 0.01; ***P < 0.001; n.s, no significance in comparison with the control group. See also Fig. S4.
Fig. 7
Fig. 7. Collagen-mediated the target genes of YAP facilitated the stemness of tumor cells.
A YAP and IgG peaks are ranked from the strongest to weakest signal. B Integrative analysis combining the data from ChIP-seq with the 1796 genes screened in Fig. 4A. C KEGG analysis performed with the 164 genes identified in (B). D Motif analysis of YAP ChIP-seq. E ChIP experiment performed with YAP antibody in Huh7 cells treated with different concentrations of collagen for 3 days. F mRNA levels of MYC, SOX9, SMAD2, and OLIG2 in Huh7 cells treated with different concentrations of collagen for 3 days. G t-SNE plots showing the expression levels of SOX9 and SMAD2 in tumor cells. H Nuclear colocalizations of YAP and SOX9 in sphere formation assays of Huh7 cells. Bars, 100 µm. I Schematic outline showing that TAF Involves in Transcriptional Diversity via Activating YAP Signaling in Liver cancer. At least two independent experiments were performed for all data. Quantified data are presented as the means ±SD. Unpaired Student’s t tests were used for comparing two variables and one-way ANOVA was used for comparing multiple variables. At least two independent experiments were performed for all data. *P < 0.05; **P < 0.01; ***P < 0.001; n.s, no significance in comparison with the control group.

Similar articles

Cited by

References

    1. Maley CC, Aktipis A, Graham TA, Sottoriva A, Boddy AM, Janiszewska M, et al. Classifying the evolutionary and ecological features of neoplasms. Nat Rev Cancer. 2017;17:605–19. - PMC - PubMed
    1. McGranahan N, Swanton C. Clonal Heterogeneity and Tumor Evolution: Past, Present, and the Future. Cell. 2017;168:613–28. - PubMed
    1. Medema JP. Cancer stem cells: The challenges ahead. Nat Cell Biol. 2013;15:338–44. - PubMed
    1. Goodell MA, Nguyen H, Shroyer N. Somatic stem cell heterogeneity: diversity in the blood, skin and intestinal stem cell compartments. Nat Rev Mol Cell Bio. 2015;16:299–309. - PMC - PubMed
    1. Jusakul A, Cutcutache I, Yong CH, Lim JQ, Huang MN, Padmanabhan N, et al. Whole-Genome and Epigenomic Landscapes of Etiologically Distinct Subtypes of Cholangiocarcinoma. Cancer Disco. 2017;7:1116–35. - PMC - PubMed

Publication types

MeSH terms