

Treatment patterns and outcomes according to cytogenetic risk stratification in patients with multiple myeloma: a real-world analysis
- PMID: 35322025
- PMCID: PMC8943165
- DOI: 10.1038/s41408-022-00638-0
Treatment patterns and outcomes according to cytogenetic risk stratification in patients with multiple myeloma: a real-world analysis
Abstract
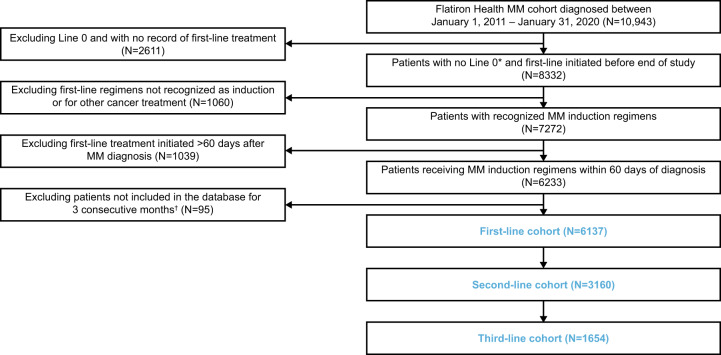
A clearer understanding of the prognostic implications of t(11;14) in multiple myeloma (MM) is needed to inform current and future therapeutic options. We utilized real-world data from a US database to examine treatment patterns and outcomes in patients by t(11;14) status compared with high- and standard-risk subgroups across different lines of therapy (LoT). This retrospective, observational cohort study used de-identified patient-level information from adults with MM and first-line treatment initiation between January 2011 and January 2020, followed until February 2020. The high-risk cohort comprised patients with high-risk genetic abnormalities per mSMART criteria (including those with co-occurring t(11;14)). Among 6138 eligible patients, 6137, 3160, and 1654 received first-, second-, and third-line treatments, respectively. Of 645 patients who had t(11;14), 69.1% had t(11;14) alone, while 30.9% had co-occurring high-risk abnormalities. Altogether, 1624 and 2544 patients were classified as high- and standard-risk, respectively. In the absence of biomarker-driven therapy, treatment patterns remain similar across LoT in high-risk, t(11;14)+, and standard-risk subgroups. Across all LoT, patient outcomes in the high-risk subgroup were less favorable than those in the t(11;14)+ and standard-risk subgroups. Thus, there is an opportunity for novel therapeutics targeted to t(11;14) and other defined subgroups to personalize MM therapy and optimize patient outcomes.
© 2022. The Author(s).
Conflict of interest statement
SA: employment (Levine Cancer Institute, Atrium Health), research funding (Amgen, GSK, Karyopharm), honoraria (Takeda, Amgen, Karyopharm, BMS, Sanofi, Cellectar, Janssen, Celgene), speaker’s bureau (BMS, Janssen Oncology, Sanofi); EMF: employment (Roche Products Limited), equity (F. Hoffmann-La Roche Ltd); TX: employment and equity (F. Hoffmann-La Roche Ltd), previous employment (Roche Diagnostics GmbH); EM: employment and equity (Genentech, Inc.); SK: employment and equity (AbbVie); W-JH: previous employment (Genentech, Inc./F. Hoffmann-La Roche Ltd), equity (F. Hoffmann-La Roche Ltd), new affiliation (Imago BioSciences, Inc.); GJ-L: employment (Genentech, Inc.), equity (BMS, AbbVie), divested equity (Celgene); MN: employment and equity (Genentech, Inc./F. Hoffmann-La Roche Ltd); SA: research funding to the institution (Pharmacyclics, Cellectar, Amgen, Janssen, BMS, Medimmune, Phosplatin), honoraria (Takeda, Celgene).
Figures


References
-
- Cancer Network. Multiple myeloma: statistics. 2021. https://www.cancer.net/cancer-types/multiple-myeloma/statistics.
-
- National Cancer Institute. Cancer stat facts: myeloma. 2021. https://seer.cancer.gov/statfacts/html/mulmy.html.
-
- Dimopoulos MA, Moreau P, Terpos E, Mateos MV, Zweegman S, Cook G, et al. Multiple myeloma: EHA-ESMO clinical practice guidelines for diagnosis, treatment and follow-up. Ann Oncol. 2021;32:309–22. - PubMed
-
- Braunlin M, Belani R, Buchanan J, Wheeling T, Kim C. Trends in the multiple myeloma treatment landscape and survival: a US analysis using 2011–2019 oncology clinic electronic health record data. Leuk Lymphoma. 2021;62:377–86. - PubMed
-
- Drach J, Ackermann J, Fritz E, Krömer E, Schuster R, Gisslinger H, et al. Presence of a p53 gene deletion in patients with multiple myeloma predicts for short survival after conventional-dose chemotherapy. Blood. 1998;92:802–9. - PubMed
Publication types
MeSH terms
Grants and funding
LinkOut - more resources
Full Text Sources
Medical
