. 2022 Mar 23;13(1):1553.
doi: 10.1038/s41467-022-29283-8.

Assessment of global health risk of antibiotic resistance genes

Affiliations

Assessment of global health risk of antibiotic resistance genes

Zhenyan Zhang et al. Nat Commun. .

Abstract

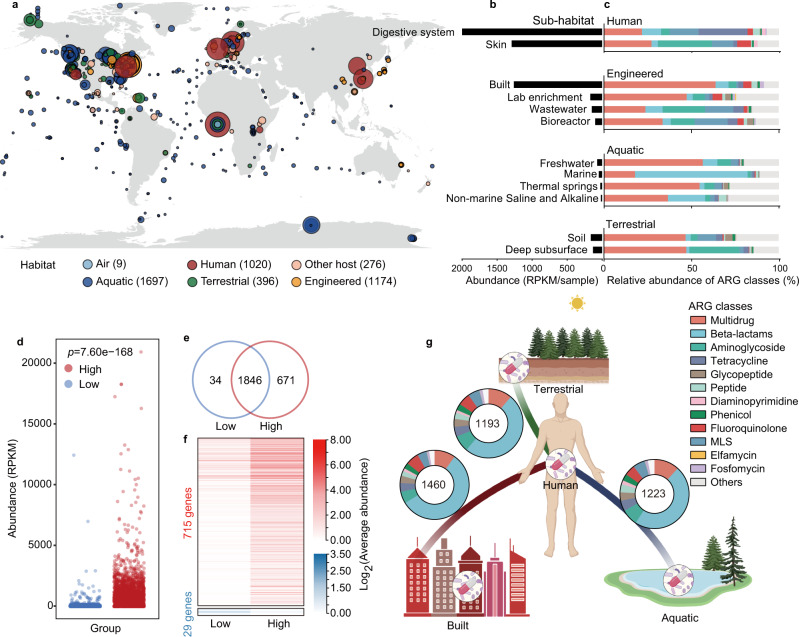
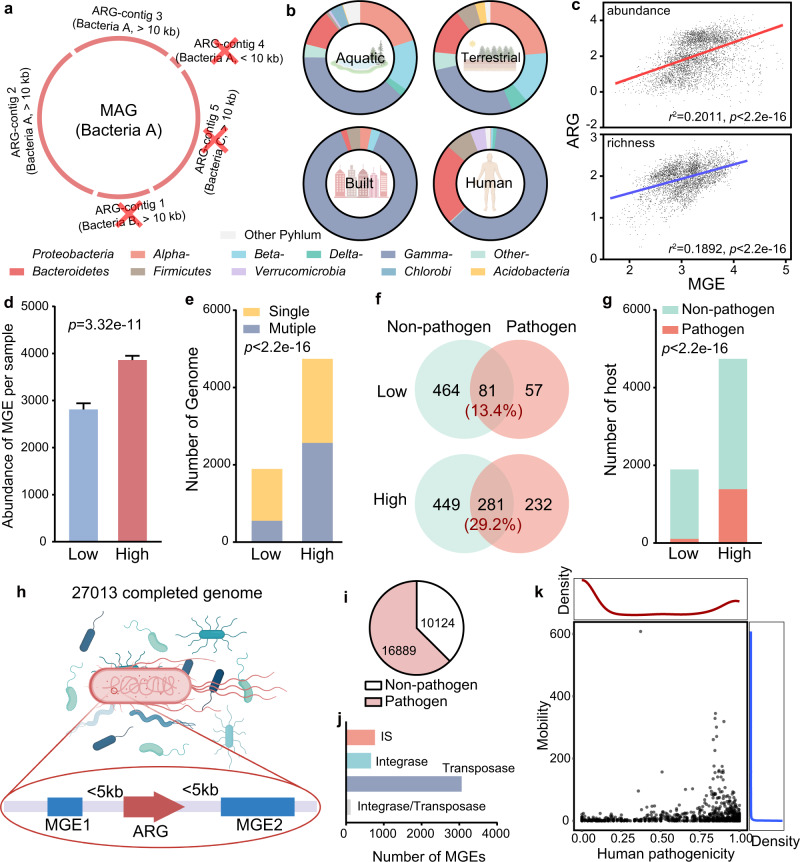
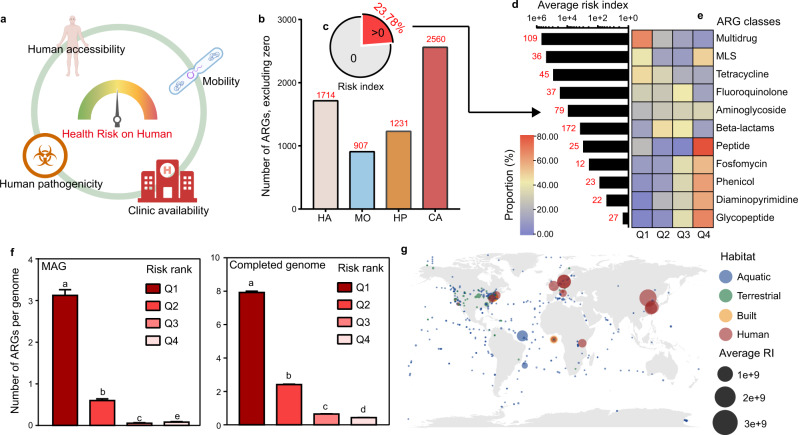
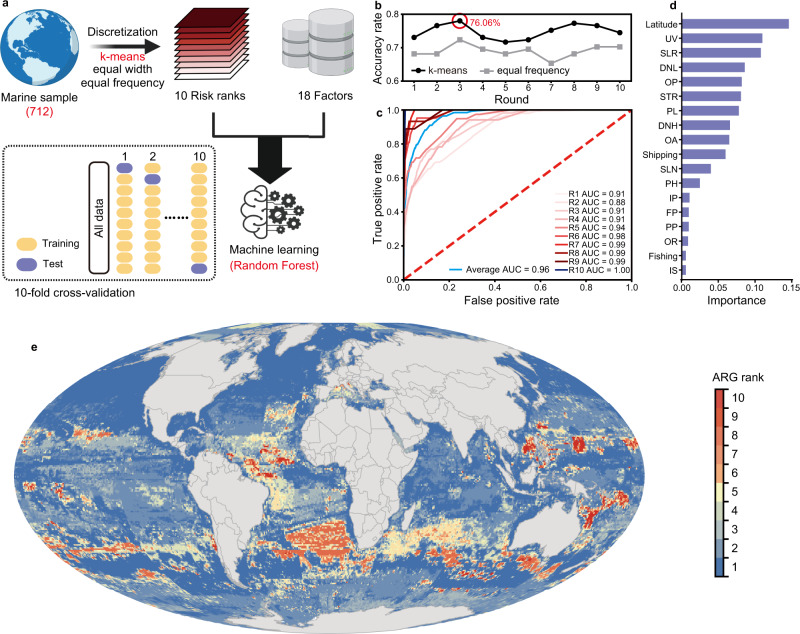
Antibiotic resistance genes (ARGs) have accelerated microbial threats to human health in the last decade. Many genes can confer resistance, but evaluating the relative health risks of ARGs is complex. Factors such as the abundance, propensity for lateral transmission and ability of ARGs to be expressed in pathogens are all important. Here, an analysis at the metagenomic level from various habitats (6 types of habitats, 4572 samples) detects 2561 ARGs that collectively conferred resistance to 24 classes of antibiotics. We quantitatively evaluate the health risk to humans, defined as the risk that ARGs will confound the clinical treatment for pathogens, of these 2561 ARGs by integrating human accessibility, mobility, pathogenicity and clinical availability. Our results demonstrate that 23.78% of the ARGs pose a health risk, especially those which confer multidrug resistance. We also calculate the antibiotic resistance risks of all samples in four main habitats, and with machine learning, successfully map the antibiotic resistance threats in global marine habitats with over 75% accuracy. Our novel method for quantitatively surveilling the health risk of ARGs will help to manage one of the most important threats to human and animal health.


Conflict of interest statement

The authors declare no competing interests.

Figures

Fig. 1
Fig. 1. Distribution patterns of antibiotic resistance genes (ARGs) globally.
a Geographic distribution of samples with ARG abundance in various habitats. Each point indicates one sampling location, rounded to the nearest degree, with point size reflecting the number of samples, and point color indicating the habitat. Samples with the unclassified location was showed as longitude = 0 and latitude = 0. b Abundance of ARGs in each sub-habitat. Digestive system of human, mainly including the fecal samples, had the highest abundances of ARGs. c Composition of antibiotic resistome in each sub-habitat. Only sub-habitats containing at least 20 samples are shown. d High-intensity human activities significantly promoted the abundance of ARGs. Each dot represents one sample (n = 1643 and 2309 samples for Low- and High-group, respectively). The p value represents the statistical significance (two-tailed Welch’s t-test). e Number of ARGs specific or shared in the areas with low- or high-intensity human activities. There were 671 ARGs specifically detected in high-intensity human activities environment. f The abundance of 715 and 29 ARGs significantly increased in high- and low-intensity human activities environment, respectively (adjust p < 0.05, two-tailed Welch’s t-test; Supplementary Data 3). g ARGs shared between the human-associated and three main habitats. Number in the circles represents the number of shared ARGs.
Fig. 2
Fig. 2. Human pathogenicity and mobility of ARGs.
a The host of ARGs were determined by only considering ARGs in contigs longer than 10 kb and making sure that the taxonomic affiliation of those ARG-containing contigs agree with the overall taxonomy of the MAG. b Composition of antibiotic resistance host at the phylum level (and classes in Proteobacteria) showed the different distributions of ARG hosts in four main habitats. c MGEs exhibited a significantly positive correlation with ARGs in abundance and richness. Each point represents one sample (n = 4572 samples). The value of abundance and number of ARGs were showed in log10. Result of linear regression are shown as r2 and p value, evaluated by F-statistic (one-sided). d Abundance of MGEs in high-intensity human activities areas were significantly higher than in low-intensity human activities areas. n = 1643 and 2309 biologically independent samples for Low- and High-group, respectively. Significance between two groups was evaluated by two-tailed Welch’s t-test. Data were showed as mean ± standard error of mean (SEM). e Number of genomes containing multiple ARGs increased in high-intensity human activities areas, compared to the low-intensity human activities areas (Fisher’s exact test, one-sided). f Shared ARGs in pathogens or non-pathogen increased in high-intensity human activities areas, compared to low. The percentage of shared ARGs in the two areas are shown. g Pathogenic hosts of ARGs increased in high-intensity human activities areas, compared to low (Fisher’s exact test, one-sided). h We collected 27,013 completed genome from NCBI RefSeq database for determining the human pathogenicity and mobility of ARGs. Five kb upstream and downstream of the ARGs detected in all completed genome for annotating the MGEs. i Among the 27,013 completed genome, 16,889 were recognized as pathogens’ genome. j We totally identified 4612 MGEs from completed genomes, and most of them were referred to the transposase. k The human pathogenicity of ARGs exhibited a bimodal distribution, while most of ARGs (2266/2561) showed mobility <10.
Fig. 3
Fig. 3. Health risk evaluation of ARGs.
a We evaluated the health risk of human for each ARG with four indicators, including human accessibility (HA), mobility (MO), human pathogenicity (HP), and clinical availability (CA). b Number of ARGs after excluding the zero value in each indicator for risk index calculation. c Only 23.78% of all evaluated ARGs exhibited risk index (RI) > 0. RI of most ARGs was zero because of the strict formula we used. d The number and average RI of ARGs in each class. Only classes that had more than 10 ARGs with RI > 0 were shown. Most of the ARGs with RI > 0 were referred to multidrug resistance with the highest average RI. e Composition of ARGs with RI > 0 in different classes. Most of the ARGs which resisted commonly used antibiotics belonged to Q1, while most of ARGs which resist rarely used antibiotics belonged to Q4. f Number of ARGs per pathogenic genome, which assembled by hospital fecal metagenomes (n = 568 MAGs) or from the completed genome dataset (n = 15,596 MAGs). Pathogens carried much more ARGs belonged to the Q1, compared with other ranks. Different letters represented the significant difference by Kruskal–Wallis H-test with the pairwise comparisons. Data were showed as mean ± standard error of mean (SEM). g Global ARG risk map of four main habitats. Antibiotic resistance risk was detected all around the world, even in the polar region. Human-associated habitats posed the highest risk of antibiotic resistance than other habitats. The average RI of each sampling site was calculated by the combination of abundance and RI of ARGs and showed as the size of points. Habitats were showed as color. Samples with the unclassified location was showed as longitude = 0 and latitude = 0.
Fig. 4
Fig. 4. Global mapping of antibiotic resistance threats in marine habitats.
a Machine learning were trained by 712 samples from marine habitats and used to predict the antibiotic resistance threats in global marine habitats. b Accuracy rate of machine learning with different discretization methods. K-means exhibited higher accuracy rate than equal frequency and the best model (accuracy rate = 76.06%) were chosen for the further prediction. c The ROC plots confirmed the high performance of the best model in classification of risk ranks. d Latitude as well as the climate change stressors exhibited the high importance in predicting the antibiotic resistance risk. The full name of each indicator can be found in Supplementary Data 12. e The map of ARG risk in marine habitats with prediction results by machine learning, which was drawn by ArcGIS in 20′ × 20′ resolution.

References

    1. Allen HK, et al. Call of the wild: antibiotic resistance genes in natural environments. Nat. Rev. Microbiol. 2010;8:251–259. - PubMed
    1. Zhang Q, et al. Cyanobacterial blooms contribute to the diversity of antibiotic-resistance genes in aquatic ecosystems. Commun. Biol. 2020;3:737. - PMC - PubMed
    1. Zhu Y-G, et al. Continental-scale pollution of estuaries with antibiotic resistance genes. Nat. Microbiol. 2017;2:16270. - PubMed
    1. Bahram M, et al. Structure and function of the global topsoil microbiome. Nature. 2018;560:233–237. - PubMed
    1. Hendriksen RS, et al. Global monitoring of antimicrobial resistance based on metagenomics analyses of urban sewage. Nat. Commun. 2019;10:1124. - PMC - PubMed

Publication types

Substances