. 2022 Mar 23;13(1):1557.
doi: 10.1038/s41467-022-29310-8.

Reconstructing antibody dynamics to estimate the risk of influenza virus infection

Affiliations

Reconstructing antibody dynamics to estimate the risk of influenza virus infection

Tim K Tsang et al. Nat Commun. .

Erratum in

Abstract

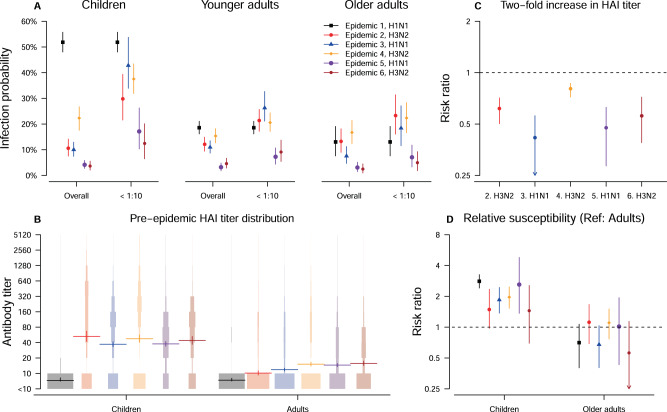
For >70 years, a 4-fold or greater rise in antibody titer has been used to confirm influenza virus infections in paired sera, despite recognition that this heuristic can lack sensitivity. Here we analyze with a novel Bayesian model a large cohort of 2353 individuals followed for up to 5 years in Hong Kong to characterize influenza antibody dynamics and develop an algorithm to improve the identification of influenza virus infections. After infection, we estimate that hemagglutination-inhibiting (HAI) titers were boosted by 16-fold on average and subsequently decrease by 14% per year. In six epidemics, the infection risks for adults were 3%-19% while the infection risks for children were 1.6-4.4 times higher than that of younger adults. Every two-fold increase in pre-epidemic HAI titer was associated with 19%-58% protection against infection. Our inferential framework clarifies the contributions of age and pre-epidemic HAI titers to characterize individual infection risk.


Conflict of interest statement

B.J.C. consults for AstraZeneca, Fosun Pharma, GlaxoSmithKline, Moderna, Pfizer, Roche and Sanofi Pasteur. The authors report no other potential competing interests.

Figures

Fig. 1
Fig. 1. Estimation of individual HAI titer trajectories.
A Timelines of our study, rounds of blood sample collection, and local influenza activity by surveillance data. Influenza activity for a strain is computed by weekly proportion of outpatients with influenza-like illness multiplied by the weekly proportion of laboratory specimens testing positive for that strain. R1 to R10 indicates the timing of round 1–10 of blood collection. B Illustration of HAI titer trajectories, infection status, infection time and pre-epidemic HAI titer if missing in three example individuals. The black dot represents the observed HAI titer, the curve indicates the augmented HAI titer trajectories since the start of an epidemic, red and blue indicate infection and non-infection respectively. Child 1 with 2-fold rise is imputed to be infected in some augmented data to reflect the uncertainty. Adult 1 and 2 with missing pre-epidemic HAI titer, the mid- and post-epidemic HAI titer 3 in log2 scale, are from epidemic 1 and 5, respectively. Adult 1 and 2 is estimated to be infected with probability 0.80 and 0.08, respectively. It is because (1) the pre-epidemic titer distribution suggested that adult 3 has a higher pre-epidemic titer than adult 2 (probability of <10 was 0.98 and 0.59 in epidemic 1 and 5, respectively), (2) the infection probability for adults for epidemic 1 (18%) was higher than epidemic 5 (2%). C Estimated boosting distribution in HAI titer after infection by subtype. Funnel plots are used to show the distribution. Solid horizontal and vertical lines are used to show the mean and corresponding 95% credible intervals of the estimates based on our estimation approach fitted to data with 2353 individuals. D The waning after boosting in HAI titer from infection by subtype. The solid lines are used to show the mean waning of HAI titer trajectories over time and the shadowed areas are used to show the corresponding 95% credible intervals.
Fig. 2
Fig. 2. Infection probability and its determinant among six epidemics.
A Estimates of infection probabilities for children, younger adults and older adults in the six epidemics in our study period. The overall infection probability and infection probability for individuals with pre-epidemic titer of <10 are plotted to show the protective effect of pre-epidemic titers. Points and vertical lines are used to show the mean and corresponding 95% credible intervals of the estimates based on our estimation approach fitted to data with 2353 individuals. B The protection associated with 2-fold increase in HAI titers in epidemic 2–6. Points and vertical lines are used to show the mean and corresponding 95% credible intervals of the estimates based on our estimation approach fitted to data with 2353 individuals. C The pre-epidemic HAI titer distribution for children and adults in the six epidemics. Funnel plots are used to show the distribution. Points and vertical lines are used to show the mean and corresponding 95% credible intervals of the estimates based on our estimation approach fitted to data with 2353 individuals. D Model estimate of the age-relative susceptibility for six epidemics. Points and vertical lines are used to show the mean and corresponding 95% credible intervals of the estimates based on our estimation approach fitted to data with 2353 individuals.
Fig. 3
Fig. 3. The association between infection status in different epidemics.
The association between the infection status in each pair of epidemics in the study period. Upper and lower diagonal shows the odds ratio without adjustment and adjusting pre-epidemic HAI titer respectively. A, B Indicate the association for children and adults respectively.
Fig. 4
Fig. 4. Comparison of using 4-fold criterion and using model estimates to estimate infection probabilities and relative susceptibility among age groups by simulation.
A, B Show the infection probabilities and relative susceptibility among age groups estimated by a 4-fold criterion and by our proposed approach respectively. Points and vertical lines are used to show the mean, 2.5% and 97.5% percentile of the estimates from 50 simulated epidemics based on our data with 2353 individuals. C The proportion of infected individuals in the groups with different infection probability zone (red rectangles) estimated by our inference from simulation study. Points and vertical lines are used to show the mean, 2.5% and 97.5% percentile of the estimates from 50 simulated epidemics based on our data with 2353 individuals.

References

    1. Iuliano AD, et al. Estimates of global seasonal influenza-associated respiratory mortality: a modelling study. Lancet. 2018;391:1285–1300. doi: 10.1016/S0140-6736(17)33293-2. - DOI - PMC - PubMed
    1. Hayward AC, et al. Comparative community burden and severity of seasonal and pandemic influenza: results of the Flu Watch cohort study. The Lancet. Respiratory Med. 2014;2:445–454. - PMC - PubMed
    1. Leung, N. H., Xu, C., Ip, D. K. & Cowling, B. J. The fraction of influenza virus infections that are asymptomatic: a systematic review and meta-analysis. Epidemiology10.1097/EDE.0000000000000340 (2015). - PMC - PubMed
    1. Cohen C, et al. Asymptomatic transmission and high community burden of seasonal influenza in an urban and a rural community in South Africa, 2017-18 (PHIRST): a population cohort study. Lancet Glob. Health. 2021;9:e863–e874. doi: 10.1016/S2214-109X(21)00141-8. - DOI - PMC - PubMed
    1. Monto AS, Kioumehr F. The Tecumseh Study of respiratory illness. IX. Occurence of influenza in the community, 1966–1971. Am. J. Epidemiol. 1975;102:553–563. doi: 10.1093/oxfordjournals.aje.a112193. - DOI - PubMed

Publication types