. 2022 Mar 23;12(1):4935.
doi: 10.1038/s41598-022-08755-3.

Characterizing the performance of human leg external force control

Affiliations

Characterizing the performance of human leg external force control

Pawel Kudzia et al. Sci Rep. .

Abstract

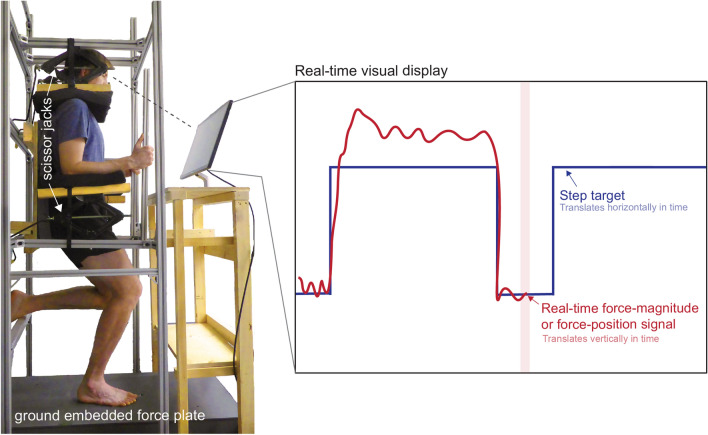
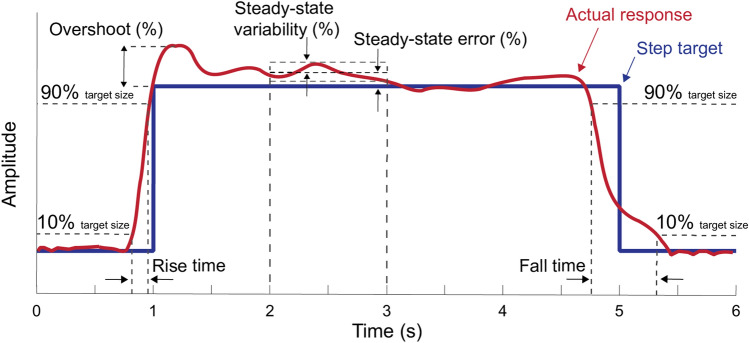
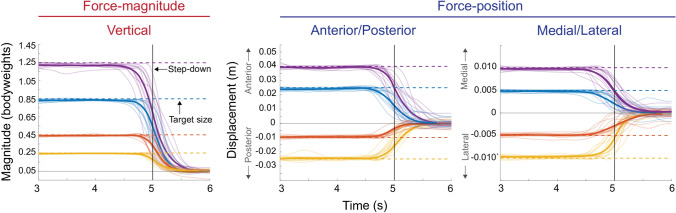
Our legs act as our primary contact with the surrounding environment, generating external forces that enable agile motion. To be agile, the nervous system has to control both the magnitude of the force that the feet apply to the ground and the point of application of this force. The purpose of this study was to characterize the performance of the healthy human neuromechanical system in controlling the force-magnitude and position of an externally applied force. To accomplish this, we built an apparatus that immobilized participants but allowed them to exert variable but controlled external forces with a single leg onto a ground embedded force plate. We provided real-time visual feedback of either the leg force-magnitude or force-position that participants were exerting against the force platform and instructed participants to best match their real-time signal to prescribed target step functions. We tested target step functions of a range of sizes and quantified the responsiveness and accuracy of the control. For the control of force-magnitude and for intermediate step sizes of 0.45 bodyweights, we found a bandwidth of 1.8 ± 0.5 Hz, a steady-state error of 2.6 ± 0.9%, and a steady-state variability of 2.7 ± 0.9%. We found similar control performance in terms of responsiveness and accuracy across step sizes and between force-magnitude and position control. Increases in responsiveness correlated with reductions in other measures of control performance, such as a greater magnitude of overshooting. We modelled the observed control performance and found that a second-order model was a good predictor of external leg force control. We discuss how benchmarking force control performance in young healthy humans aids in understanding differences in agility between humans, between humans and other animals, and between humans and engineered systems.


Conflict of interest statement

The authors declare no competing interests.

Figures

Figure 1
Figure 1
Apparatus to characterize external force control. The apparatus constrained the vertical and horizontal motion of each participants’ torso using adjustable scissor jacks that pushed down on their shoulders and pushed up against their forearms, and a stiff aluminum frame securely mounted to the ground. The participants stood in a posture resembling the stance phase of a run and could selectively push more or less or shift the pressure beneath their foot against the ground-embedded force plate. The real-time feedback displayed to the participants the real-time force-magnitude or position signal that they were exerting onto the ground as well as the target step function they were to try and best match.
Figure 2
Figure 2
Step response characteristics. The empirical response (red line) and the step target (blue) line are shown for a single segmented target step response 6 s in length. For force-magnitude control, the step target size is in bodyweights, and for force-position control, the step target size is in centimeters. The evaluated control characteristics include rise time (s), bandwidth (Hz), overshoot (%), steady-state error (%), steady-state variability (%), and fall time (s).
Figure 3
Figure 3
The average step-up response from each participant at each target step size (color lines) and the average of the average response (bold color lines). The vertical line represents when the target step function steps up from its base value of 0.05 bodyweights for force-magnitude control or 0 cm for force-position control to a new target step size (dashed lines). Participants could anticipate when the step target would step up to a new target size therefore the response could precede the visual step change. Here the first second before the step-up and the 2 seconds after are shown. Within this time frame, we evaluated the rise time, bandwidth, overshoot, steady-state error, and steady-state variability.
Figure 4
Figure 4
The average step-down response for each participant at each target step size (color lines) and the average of the average response (bold colored lines). The vertical line represents when the step function steps down from the current step target size (dashed lines) to 0.05 bodyweights for force-magnitude control or 0 cm for force-position control (base values). Here the 2 seconds before the step-down are shown and the 1 second after the signal returns to its base value. Within this timeframe, we evaluated the fall times as participants stepped down from the step target size back down to the base value.
Figure 5
Figure 5
Representative findings from force-magnitude control (0.45 bodyweights), and force-position control (2.5 cm anterior and 1.0 cm medial). We fit a linear mixed-effects model to the data and plot the resultant linear fit as the black line. Each data point corresponds to the results from a single-step response while each color corresponds to a different participant. The R2 value for the fit is shown alongside the p-value, and equation of the line.
Figure 6
Figure 6
Representative modelling results for select force-magnitude and force-position target step size conditions. We plotted the second-order model using the average of the best-fitted parameters (black line) against the average of each participant's response to each step target magnitude (colored lines). The vertical line represents when the step function steps up from zero to the normalized target value of one. The horizontal dashed line is the target step size value of 1. The R2 value shown is the average fit of the model for that condition.

References

    1. Howland HC. Optimal strategies for predator avoidance: The relative importance of speed and manoeuvrability. J. Theor. Biol. 1974;47(2):333–350. doi: 10.1016/0022-5193(74)90202-1. - DOI - PubMed
    1. Full RJ, Kubow T, Schmitt J, Holmes P, Koditschek D. Quantifying dynamic stability and maneuverability in legged locomotion. Integr. Comp. Biol. 2002;42(1):149–157. doi: 10.1093/icb/42.1.149. - DOI - PubMed
    1. J. Hwangbo, J. Lee, A. Dosovitskiy, D. Bellicoso, V. Tsounis, V. Koltun, & M. Hutter. Learning agile and dynamic motor skills for legged robots. Sci. Robot. 4(26) (2019). - PubMed
    1. Vescovi JD, Mcguigan MR. Relationships between sprinting, agility, and jump ability in female athletes. J. Sports Sci. 2008;26(1):97–107. doi: 10.1080/02640410701348644. - DOI - PubMed
    1. Asadi A. Relationship between jumping ability, agility and sprint performance of elite young basketball players: A field-test approach. Braz. J. Kinanthropometry Hum. Performance. 2016;18(2):177. doi: 10.5007/1980-0037.2016v18n2p177. - DOI

Publication types