. 2022 Mar 23;12(1):5050.
doi: 10.1038/s41598-022-08904-8.

Loss of KAP3 decreases intercellular adhesion and impairs intracellular transport of laminin in signet ring cell carcinoma of the stomach

Affiliations

Loss of KAP3 decreases intercellular adhesion and impairs intracellular transport of laminin in signet ring cell carcinoma of the stomach

Tomohiro Soda et al. Sci Rep. .

Abstract

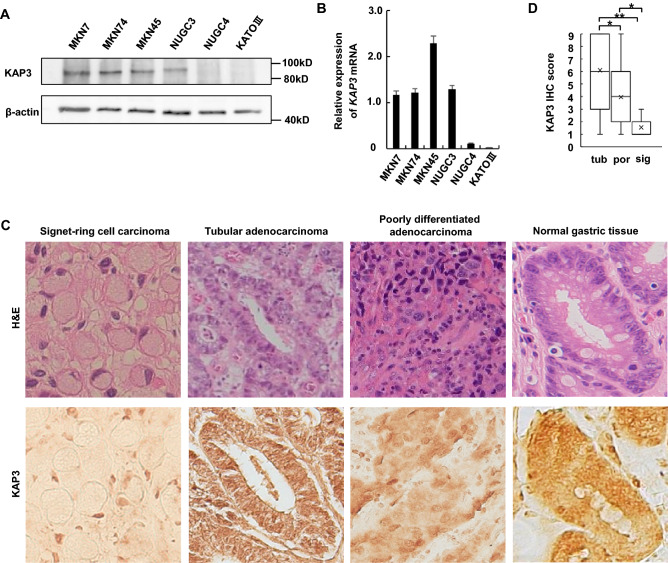
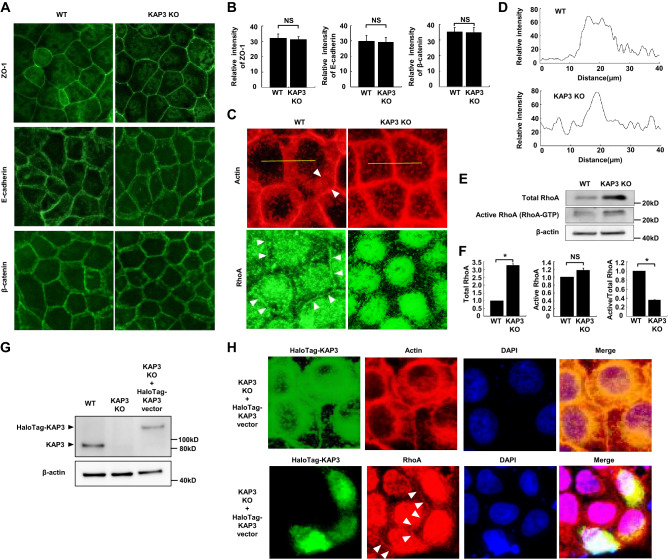
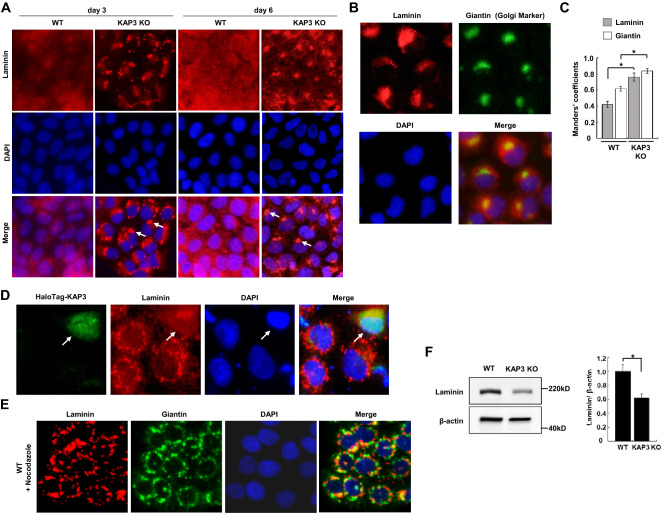
Signet-ring cell carcinoma (SRCC) is a unique subtype of gastric cancer that is impaired for cell-cell adhesion. The pathogenesis of SRCC remains unclear. Here, we show that expression of kinesin-associated protein 3 (KAP3), a cargo adaptor subunit of the kinesin superfamily protein 3 (KIF3), a motor protein, is specifically decreased in SRCC of the stomach. CRISPR/Cas9-mediated gene knockout experiments indicated that loss of KAP3 impairs the formation of circumferential actomyosin cables by inactivating RhoA, leading to the weakening of cell-cell adhesion. Furthermore, in KAP3 knockout cells, post-Golgi transport of laminin, a key component of the basement membrane, was inhibited, resulting in impaired basement membrane formation. Together, these findings uncover a potential role for KAP3 in the pathogenesis of SRCC of the stomach.


Conflict of interest statement

The authors declare no competing interests.

Figures

Figure 1
Figure 1
Loss of KAP3 expression in SRCC of the stomach. (A) Immunoblot analysis of KAP3 in six GC cell lines. β-actin was blotted as an internal (loading) control. (B) Levels of KAP3 mRNA in the same GC cell lines, as determined by quantitative RT-PCR (n = 3). The expression level of ACTB was used as an endogenous control for the mRNA levels. Values are presented as mean ± SD. (C) Hematoxylin–eosin (H&E) staining and immunohistochemistry of KAP3 in three histological types of primary GC. Original magnification, ×200. (D) Semi-quantitative analysis of KAP3 expression in the three histological types of primary GC, which include tubular adenocarcinoma (tub; n = 21), poorly differentiated adenocarcinoma (por; n = 22), and signet-ring cell carcinoma (sig; n = 9). The middle line is median, upper and lower ends of box are 75th and 25th percentiles, and whiskers are maximum and minimum values. “X” indicates the mean value. *P < 0.05; **P < 0.01. IHC immunohistochemistry.
Figure 2
Figure 2
Morphological changes and decreased cell aggregation in KAP3 KO cells. (A) Immunoblot analysis of KAP3 in KAP3 wild-type (WT) and knockout (KO) cells derived from MNK74 cells. β-actin was blotted as an internal (loading) control. (B) Phase contrast images of KAP3 WT and KO cells. The insets are magnified images of the respective micrographs. Original magnification, × 40. (C,D) Cell aggregation assay. Phase contrast images (C) and the percentage (D) of cell aggregation of KAP3 WT and KO cells after 10 days of culturing in non-adherent dishes. Values are presented as mean ± SD. *P < 0.05. Original magnification, × 40; scale bars, 500 µm. (E) Cell viability assay of KAP3 WT and KO cells cultured in non-adherent dishes (n = 5). Values are presented as mean ± SD.
Figure 3
Figure 3
Inactivation of RhoA and impaired formation of a circumferential actomyosin cable in KAP3 KO cells. (A,B) AJC components in KAP3 WT and KO cells. Immunofluorescent staining (A) and the relative intensity (B) of ZO-1, E-cadherin, and β-catenin immunostaining across the cell junctions in KAP3 WT and KO cells (n = 20). Values are presented as mean ± SD. (C) (upper) Immunofluorescence analysis of actin stained with rhodamine phalloidin in KAP3 WT and KO cells. Arrowheads indicate circumferential actomyosin cables in WT cells. (lower) Immunofluorescence analysis of RhoA in KAP3 WT and KO cells. Arrowheads indicate the localization of RhoA on the cell membrane in WT cells. RhoA signal in nuclei in WT and KO cells represents non-specific staining. Cells were viewed with an inverted fluorescence phase contrast microscope. (D) Quantification of immunosignals for F-actin across the cell junctions by densitometric scanning in WT and KO cells. The immunosignals were measured along the indicated yellow lines in (C; upper). (E,F) RhoA pull-down activation assay in KAP3 WT and KO cells. (E) Levels of total and active (GTP-bound) RhoA detected by immunoblotting. β-actin was blotted as an internal (loading) control. (F) The relative expression of total and active RhoA, and the ratio of active to total RhoA, were calculated by densitometric analysis of immunoblots (n = 3). Values are presented as mean ± SD. (G,H) KAP3 rescue experiments using transient expression of HaloTag-KAP3 in KAP3 KO cells. (G) Immunoblot analysis of HaloTag-KAP3 expression using anti-KAP3 antibody. (H) Immunofluorescence analysis of HaloTag-KAP3 (green), actin (upper; red), RhoA (lower; red), and DAPI (blue). HaloTag-KAP3 was detected by HaloTag ligand. Arrowheads indicate localization of RhoA on the membranes of cells that express HaloTag-KAP3.
Figure 4
Figure 4
Impairment of post-Golgi transport of laminin and decreased laminin expression in KAP3 KO cells. (A) Immunofluorescent staining of laminin (red) in KAP3 WT and KO cells at Day 3 or Day 6 after passage. Nuclei were counterstained with DAPI (blue). Arrows indicate an accumulation of laminin in KAP3 KO cells. (B) Co-localization of laminin and giantin (a Golgi marker) in KAP3 KO cells. KAP3 KO cells were stained with anti-laminin antibody (red), anti-giantin antibody (green), and DAPI (blue), and were viewed with an inverted fluorescence phase contrast microscope. (C) Manders’ colocalization coefficient of laminin and giantin in KAP3 WT and KO cells (n = 50). Values are presented as mean ± SD. *P < 0.05. (D) Immunofluorescence analysis of KAP3 KO cells transfected with the HaloTag-KAP3-encoding vector. Cells were stained with HaloTag ligand (green), anti-laminin antibody (red), and DAPI (blue) at Day 3 after transfection. Arrows indicate cells expressing HaloTag-KAP3. (E) Immunofluorescence analysis of KAP3 WT cells that were treated with 1 µg/mL of nocodazole for 16 h. Cells were labeled as in (B). (F) Immunoblot analysis of laminin in KAP3 WT and KO cells. β-actin was blotted as an internal (loading) control. Values are presented as mean ± SD. (n = 3). *P < 0.05.
Figure 5
Figure 5
Impairment of laminin deposition at basement membrane with loss of KAP3 expression in SRCC. (A) Immunohistochemistry of laminin in clinical samples of SRCC and tubular adenocarcinoma of the stomach. Arrowheads indicate laminin at basement membranes. Asterisks indicate cells of SRCC. Staining seen in SRCC is interstitial tissue. Original magnification, ×200. (B) Semi-quantitative analysis of laminin expression in the three histological types of primary GC, which include tubular adenocarcinoma (tub; n = 21), poorly differentiated adenocarcinoma (por; n = 22), and signet-ring cell carcinoma (sig; n = 9). The middle line is median, upper and lower ends of box are 75th and 25th percentiles, and whiskers are maximum and minimum values. “X” indicates the mean value. *P < 0.05; **P < 0.01. IHC immunohistochemistry. (C–E) H&E and immunohistochemical staining of KAP3 and laminin in the normal gastric mucosa (C) and in an early gastric cancer of SRCC limited to the mucosa (D). Dotted circles indicate foci of SRCC. Original magnification, ×40. (E) Magnified view of the square area in the H&E-stained section of SRCC shown in (D). Note that separate (non-adjacent) sections were used for H&E and immunohistochemical staining of KAP3 and laminin (because the original specimens were sectioned multiple times for use in various pathological diagnoses and studies).

Similar articles

Cited by

References

    1. Lauren P. The two histological main types of gastric carcinoma: Diffuse and so-called intestinal-type carcinoma. An attempt at a histo-clinical classification. Acta Pathol. Microbiol. Scand. 1965;64:31–49. - PubMed
    1. Parsonnet J, et al. Helicobacter pylori infection in intestinal- and diffuse-type gastric adenocarcinomas. J. Natl. Cancer. Inst. 1991;83:640–643. - PubMed
    1. Mayer RJ, et al. Gastrointestinal Tract Cancer. In: Longo DL, Fauci AS, Kasper DL, et al., editors. Harrison’s Principles of Internal Medicine. 18. McGraw-Hill Campanies; 2012. pp. 764–776.
    1. Lauwers G, Carneiro F, Graham D, Curado M, Franceschi S. Classification of Tumours of the Digestive System. 4. IARC Press; 2010. pp. 45–58.
    1. Japanese Gastric Cancer Association Japanese classification of gastric carcinoma: 3rd English. Gastric Cancer. 2011;14:101–112. - PubMed

MeSH terms