. 2022 Mar 23;12(1):4952.
doi: 10.1038/s41598-022-08920-8.

Down-regulation of the transcriptional repressor ZNF802 (JAZF1) reactivates fetal hemoglobin in β0-thalassemia/HbE

Affiliations

Down-regulation of the transcriptional repressor ZNF802 (JAZF1) reactivates fetal hemoglobin in β0-thalassemia/HbE

Chokdee Wongborisuth et al. Sci Rep. .

Erratum in

Abstract

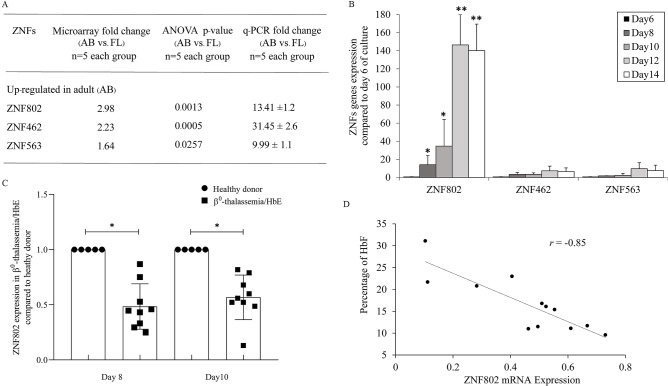
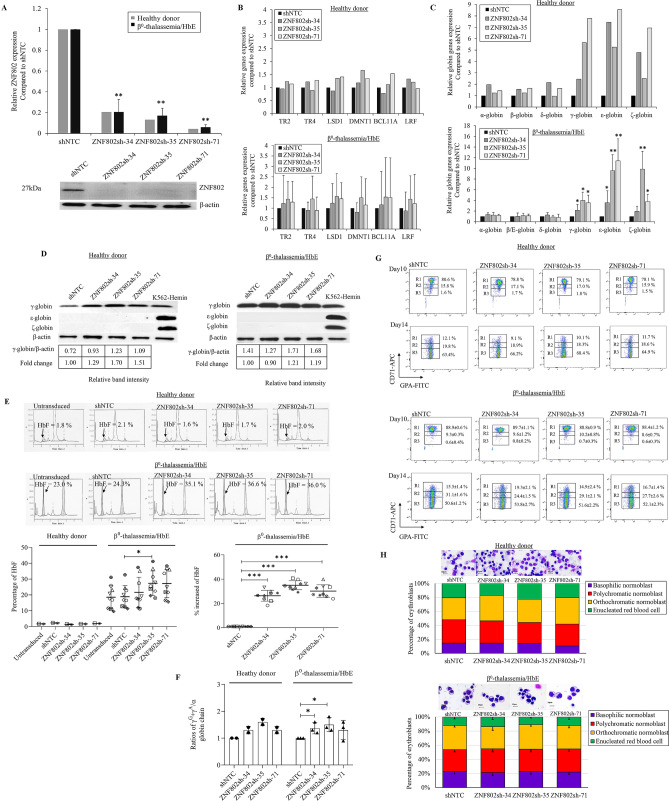
Reactivating of fetal hemoglobin (HbF; α2γ2) can ameliorate the severity of β-thalassemia disease by compensating for adult hemoglobin deficiency in patients. Previously, microarray analysis revealed that zinc finger protein (ZNF)802 (also known as Juxta-posed with another zinc finger gene-1 (JAZF1)) was upregulated in human erythroblasts derived from adult peripheral blood compared with fetal liver-derived cells, implying a potential role as a HbF repressor. However, deficiency in ZNF802 induced by lentiviral shRNA in β0-thalassemia/hemoglobinE erythroblasts had no effect on erythroblast proliferation and differentiation. Remarkably, the induction of HBG expression was observed at the transcriptional and translational levels resulting in an increase of HbF to 35.0 ± 3.5%. Interestingly, the embryonic globin transcripts were also upregulated but the translation of embryonic globin was not detected. These results suggest ZNF802 might be a transcriptional repressor of the γ-globin gene in adult erythroid cells.


Conflict of interest statement

The authors declare no competing interests.

Figures

Figure 1
Figure 1
ZNF expression in human erythroid cells. (A) Validation of ZNF transcripts identified by microarray datasets by RT-qPCR. (B) ZNF802, ZNF462, and ZNF563 expressions during erythroid differentiation (day 8 of culture) and the fold change analysis normalized to its expression in proerythroblasts derived from healthy donors (day 6 of culture, n = 3). *p < 0.05, **p < 0.005. (C) ZNF802 expression at day 8 and day 10 in healthy donors (n = 5) and β0-thalassemia/HbE patients (n = 9). *p < 0.05. (D) Correlation of ZNF802 mRNA expression at day 10 and fetal hemoglobin in β0-thalassemia/HbE patients (n = 12). Error bars represent means and ± SD.
Figure 2
Figure 2
Effects of ZNF802 knockdown in erythroid progenitor cells from healthy donors (n = 2) and β0-thalassemia/HbE patients (n = 9). (A) RT-qPCR and western blotting depicting ZNF802 knockdown efficiency on day 10. RPS18 and β-actin were used as a housekeeping gene and loading control for RT-qPCR and western blot, respectively. (B) RT-qPCR of transcription factors, DRED complex repressors (TR2, TR4, LSD1, DMNT1), major repressor BCL11A, and LRF mRNA expression levels on day 10. *p < 0.05, **p < 0.005. (C) RT-qPCR analysis of the relative fold change of α-globin and β- globin cluster mRNA expression levels. Relative fold change represents the mRNA expression levels normalized to RPS18 of shRNAs targeting ZNF802 (ZNF802sh-34, ZNF802sh-35, and ZNF802sh-71) versus nontargeting control shRNA (shNTC) on day 10. Data are presented as the mean ± SD from healthy donors and β0-thalassemia/HbE patients, *p < 0.05. (D) Representative western blot analysis on day 10 showing each globin protein expression. β-actin was used as a loading control. (E) Illustrative hemoglobin typing showing HbF induction on day 14, *p < 0.05. Percentage increase of HbF compared with shNTC, ***p < 0.001. (F) Globin chain analysis to determine the relative ratio of γ-globin chain induction in healthy donors (n = 2) and β0-thalassemia/HbE patients (n = 3), *p < 0.05. (G). Illustrative flow cytometric analysis on day 10 and day 14 showing transferrin receptor (CD71) and glycophorin A (GPA) expression levels. R1 population, CD71high/GPAhigh; R2 population, CD71medium/GPAhigh; R3 population, CD71low/GPAhigh. (H) Representative cytospin preparations of modified Giemsa-stained cells on day 10 from healthy donors (n = 2) and β0-thalassemia/HbE patients (n = 5) visualized under a light microscope with 100 × magnification. Scale bar indicates 10 μm. Error bars represent means and ± SD.

Similar articles

Cited by

References

    1. Mettananda S, Gibbons RJ, Higgs DR. α-Globin as a molecular target in the treatment of β-thalassemia. Blood. 2015;125:3694–3701. doi: 10.1182/blood-2015-03-633594. - DOI - PMC - PubMed
    1. Watson J. The significance of the paucity of sickle cells in newborn Negro infants. Am. J. Med. Sci. 1948;215:419–423. doi: 10.1097/00000441-194804000-00008. - DOI - PubMed
    1. Somervaille T. Disorders of hemoglobin: genetics, pathophysiology, and clinical management. J. R. Soc. Med. 2001;94:602–603. doi: 10.1177/014107680109401119. - DOI
    1. Suzuki M, Yamamoto M, Engel JD. Fetal globin gene repressors as drug targets for molecular therapies to treat the β-globinopathies. Mol. Cell. Biol. 2014;34:3560–3569. doi: 10.1128/MCB.00714-14. - DOI - PMC - PubMed
    1. Cui S, Kolodziej KE, Obara N, Amaral-Psarris A, Demmers J, Shi L, Engel JD, Grosveld F, Strouboulis J, Tanabe O. Nuclear receptors TR2 and TR4 recruit multiple epigenetic transcriptional corepressors that associate specifically with the embryonic β-type globin promoters in differentiated adult erythroid cells. Mol. Cell. Biol. 2011;31:3298–3311. doi: 10.1128/MCB.05310-11. - DOI - PMC - PubMed