

NaCl exposure results in increased expression and processing of IL-1β in Meniere's disease patients
- PMID: 35322136
- PMCID: PMC8943007
- DOI: 10.1038/s41598-022-08967-7
NaCl exposure results in increased expression and processing of IL-1β in Meniere's disease patients
Abstract
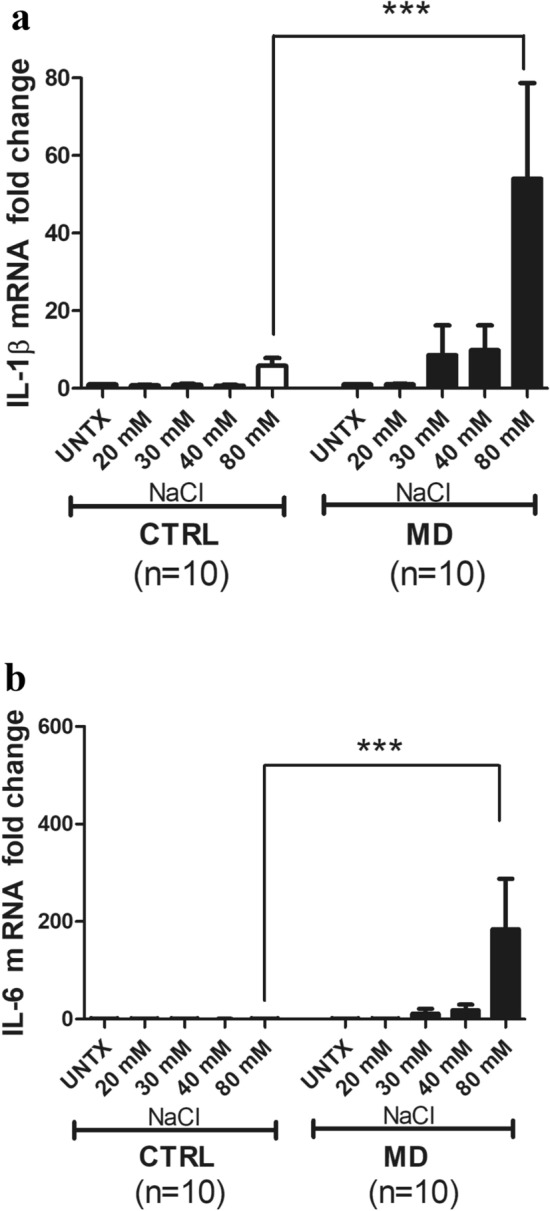
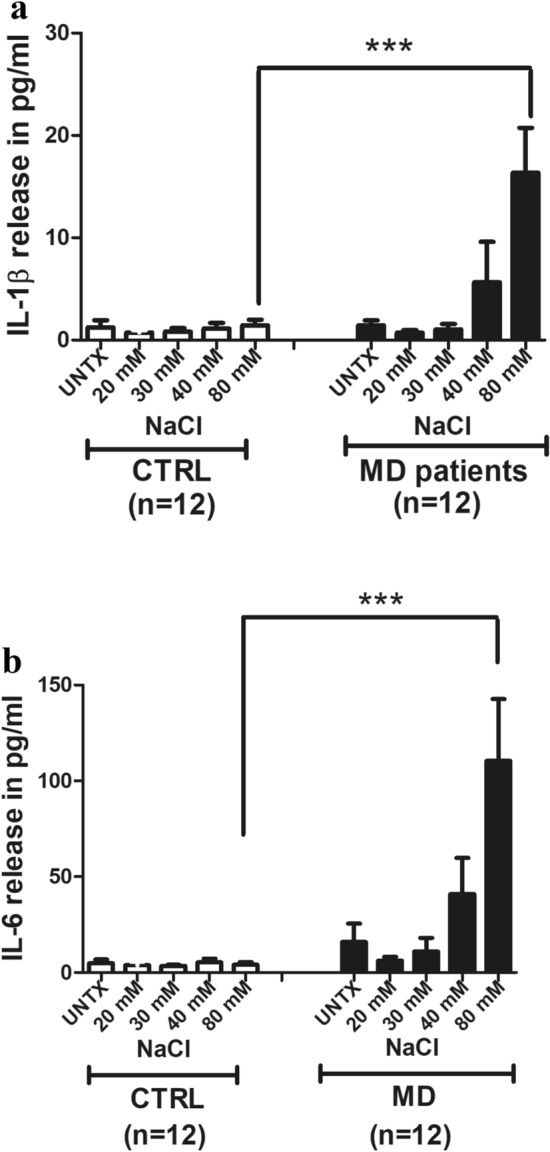
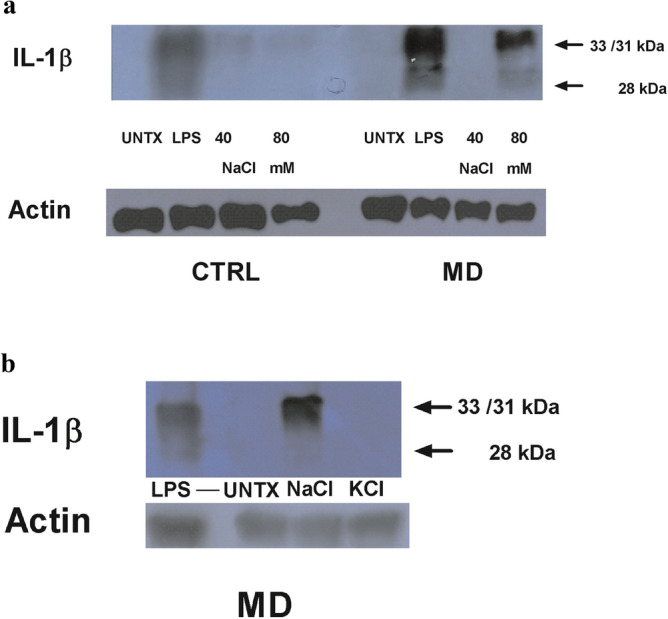
Meniere's disease (MD) is a chronic disease that causes episodic vertigo, fluctuating hearing loss, and aural fullness, initially managed by dietary salt reduction, and use of diuretics. Our prior research in autoimmune inner ear disease (AIED) demonstrated that in peripheral blood mononuclear cell (PBMC) from corticosteroid-resistant AIED patients, increased production, processing and release of interleukin-1β (IL-1β) is observed and hearing could be improved with use of anakinra, an interleukin-1 receptor antagonist. We have further identified that in these AIED patients, IL-1β is uniquely processed to a 28 kDa pro-inflammatory product by caspase-7. In the present study, we characterize the production, processing and release of the pro-inflammatory cytokines IL-1β and IL-6 from PBMC of MD (n = 14) patients in response to sodium chloride (NaCl), and determined the effect of the diuretic triamterene-hydrocholothiazide (T-HCTZ), or anakinra in these patients. We observed that PBMC cultured with NaCl from MD patients show processing of IL-1β to the 28 kDa product, and that this product is abrogated with T-HCTZ. Our observations are consistent with other autoimmune diseases where high concentrations of NaCl caused release of pro-inflammatory cytokines and may provide further insight as to the mechanism of disease progression in MD patients.
© 2022. The Author(s).
Conflict of interest statement
The authors declare no competing interests.
Figures


Similar articles
-
Effect of betahistine on pro-inflammatory cytokine expression in autoimmune inner ear disease and Meniere's disease patients.Laryngoscope Investig Otolaryngol. 2024 Nov 7;9(6):e70032. doi: 10.1002/lio2.70032. eCollection 2024 Dec. Laryngoscope Investig Otolaryngol. 2024. PMID: 39525524 Free PMC article.
-
Autoimmune inner ear disease patient-associated 28-kDa proinflammatory IL-1β fragment results from caspase-7-mediated cleavage in vitro.JCI Insight. 2020 Feb 13;5(3):e130845. doi: 10.1172/jci.insight.130845. JCI Insight. 2020. PMID: 32051334 Free PMC article.
-
Proinflammatory cytokines and response to molds in mononuclear cells of patients with Meniere disease.Sci Rep. 2018 Apr 13;8(1):5974. doi: 10.1038/s41598-018-23911-4. Sci Rep. 2018. PMID: 29654306 Free PMC article.
-
Biologics for Immune-Mediated Sensorineural Hearing Loss.Otolaryngol Clin North Am. 2021 Aug;54(4):803-813. doi: 10.1016/j.otc.2021.05.005. Epub 2021 Jun 10. Otolaryngol Clin North Am. 2021. PMID: 34119332 Review.
-
Rare cases of Ménière's disease in children.J Laryngol Otol. 2006 Apr;120(4):343-52. doi: 10.1017/S0022215106000569. J Laryngol Otol. 2006. PMID: 16623983 Review.
Cited by
-
Exploring causal correlations between inflammatory cytokines and Ménière's disease: a Mendelian randomization.Front Immunol. 2024 Apr 29;15:1373723. doi: 10.3389/fimmu.2024.1373723. eCollection 2024. Front Immunol. 2024. PMID: 38742115 Free PMC article.
-
Correlation between NLRP6 inflammasome and the levels of inflammatory cytokines IL-1b and IL-18 in serum of patients with Meniere's disease.J Med Biochem. 2025 Jul 4;44(4):740-747. doi: 10.5937/jomb0-55001. J Med Biochem. 2025. PMID: 40837366 Free PMC article.
-
Correlation of endolymphatic hydrops and perilymphatic enhancement with the clinical features of Ménière's disease.Eur Radiol. 2024 Sep;34(9):6036-6046. doi: 10.1007/s00330-024-10620-y. Epub 2024 Feb 3. Eur Radiol. 2024. PMID: 38308680
-
Recent advances in understanding molecular bases of Ménière's disease.Fac Rev. 2023 May 11;12:11. doi: 10.12703/r/12-11. eCollection 2023. Fac Rev. 2023. PMID: 37284494 Free PMC article. Review.
-
Effect of betahistine on pro-inflammatory cytokine expression in autoimmune inner ear disease and Meniere's disease patients.Laryngoscope Investig Otolaryngol. 2024 Nov 7;9(6):e70032. doi: 10.1002/lio2.70032. eCollection 2024 Dec. Laryngoscope Investig Otolaryngol. 2024. PMID: 39525524 Free PMC article.
References
-
- Rosenbaum A, Winter MJM. Are diuretics effective for Ménière’s disease? Medwave. 2018;18:e7188. - PubMed
Publication types
MeSH terms
Substances
LinkOut - more resources
Full Text Sources
Medical
