. 2022 Mar 23;12(1):5057.
doi: 10.1038/s41598-022-09135-7.

Accelerated remodeling of the mesophyll-bundle sheath interface in the maize C4 cycle mutant leaves

Affiliations

Accelerated remodeling of the mesophyll-bundle sheath interface in the maize C4 cycle mutant leaves

Peng Gao et al. Sci Rep. .

Abstract

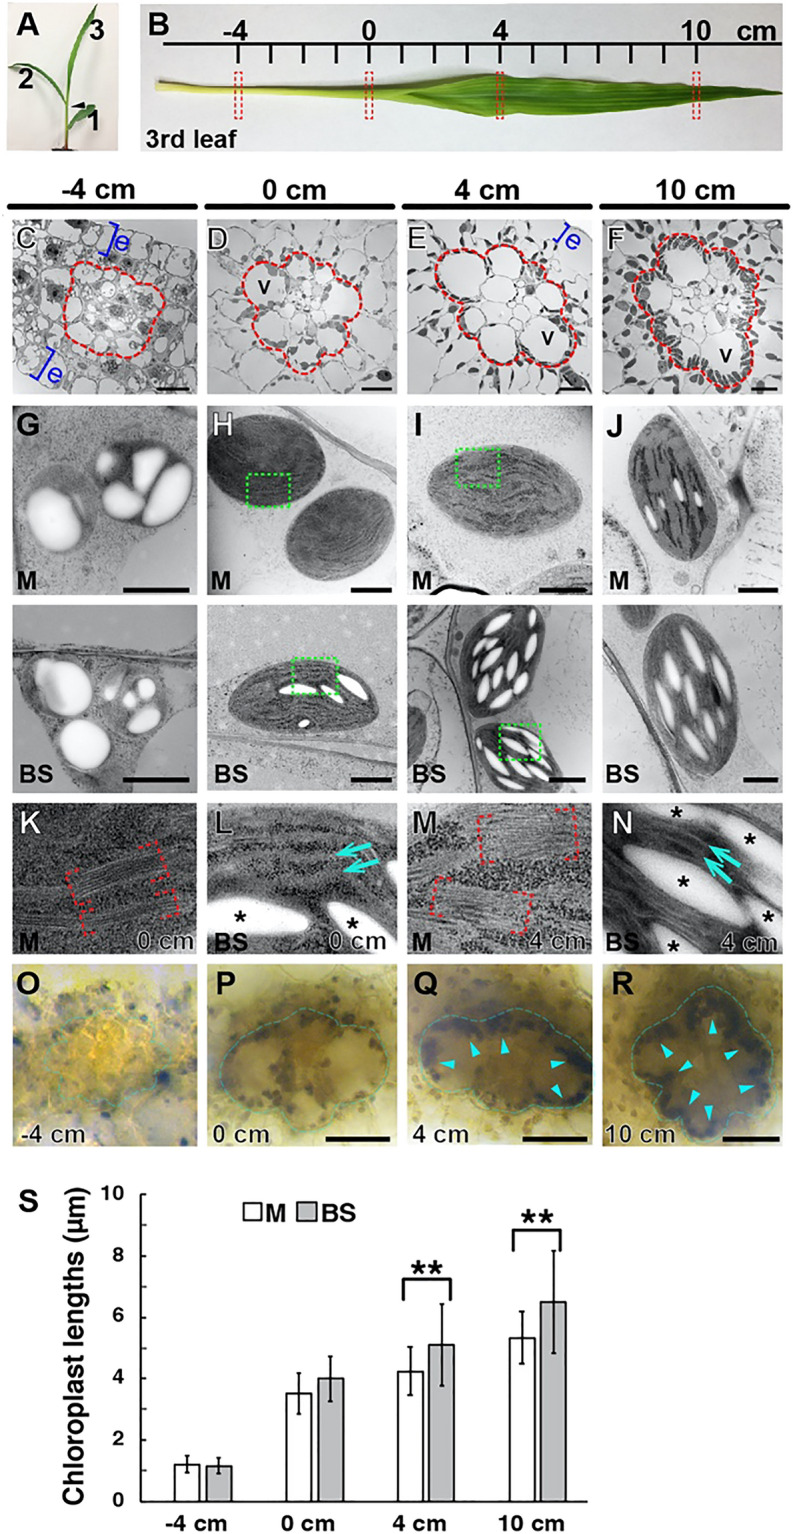
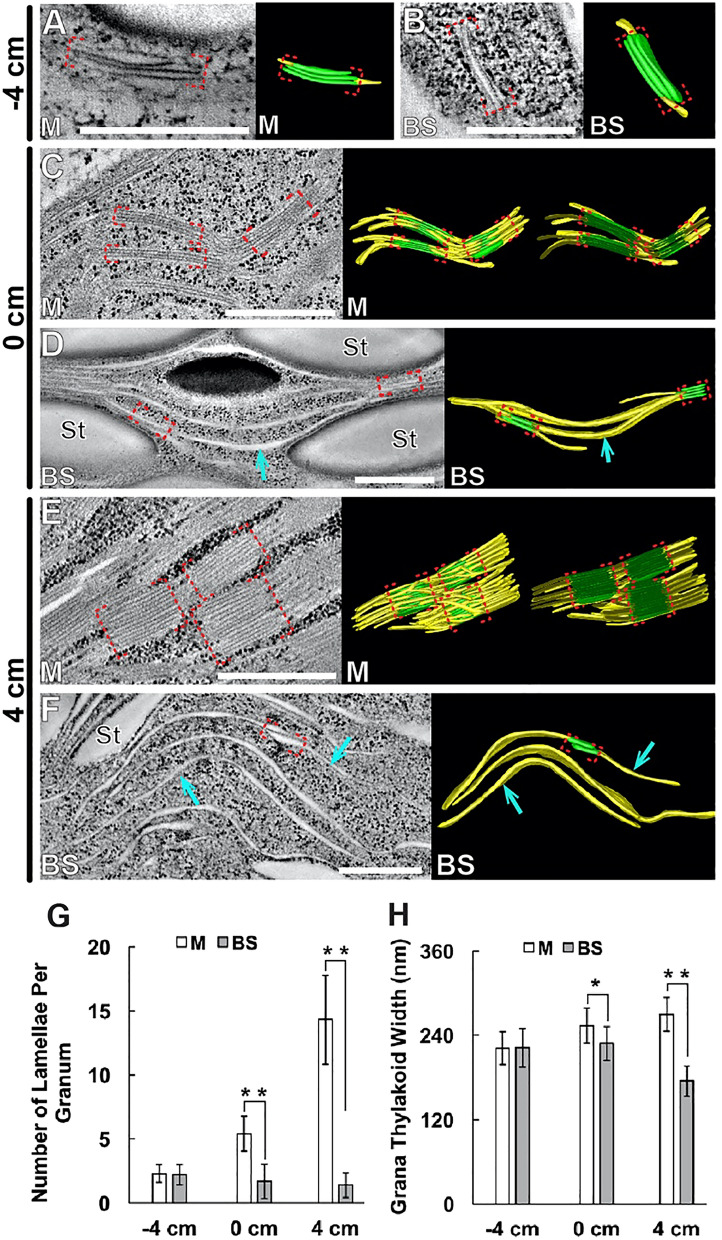
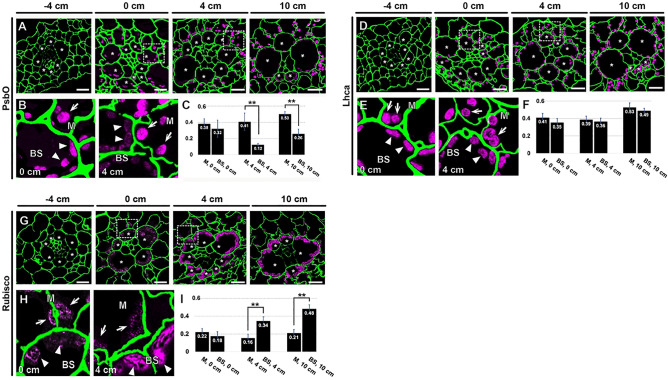
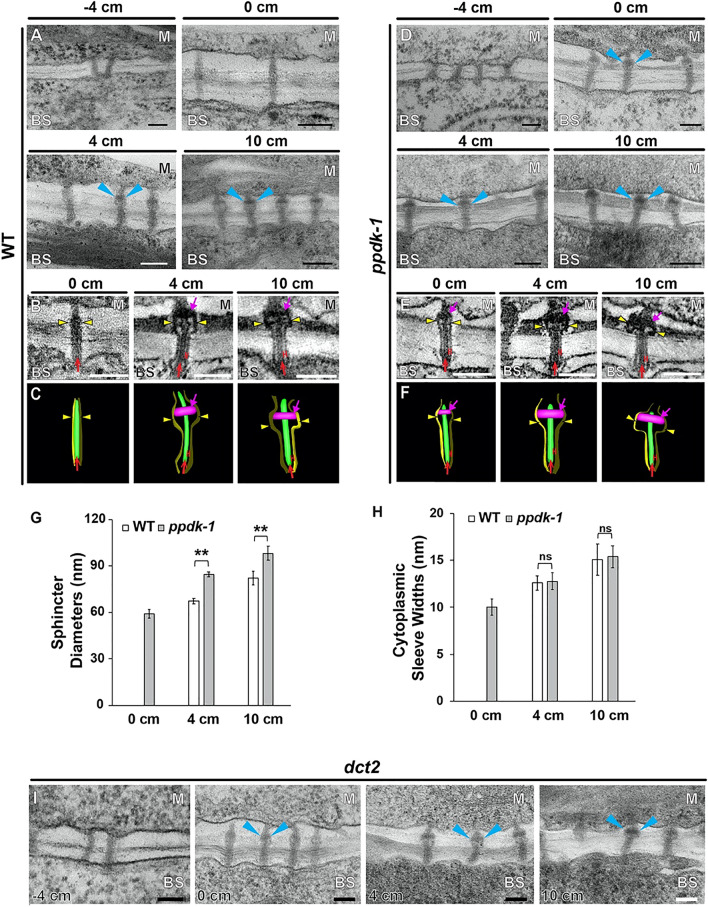
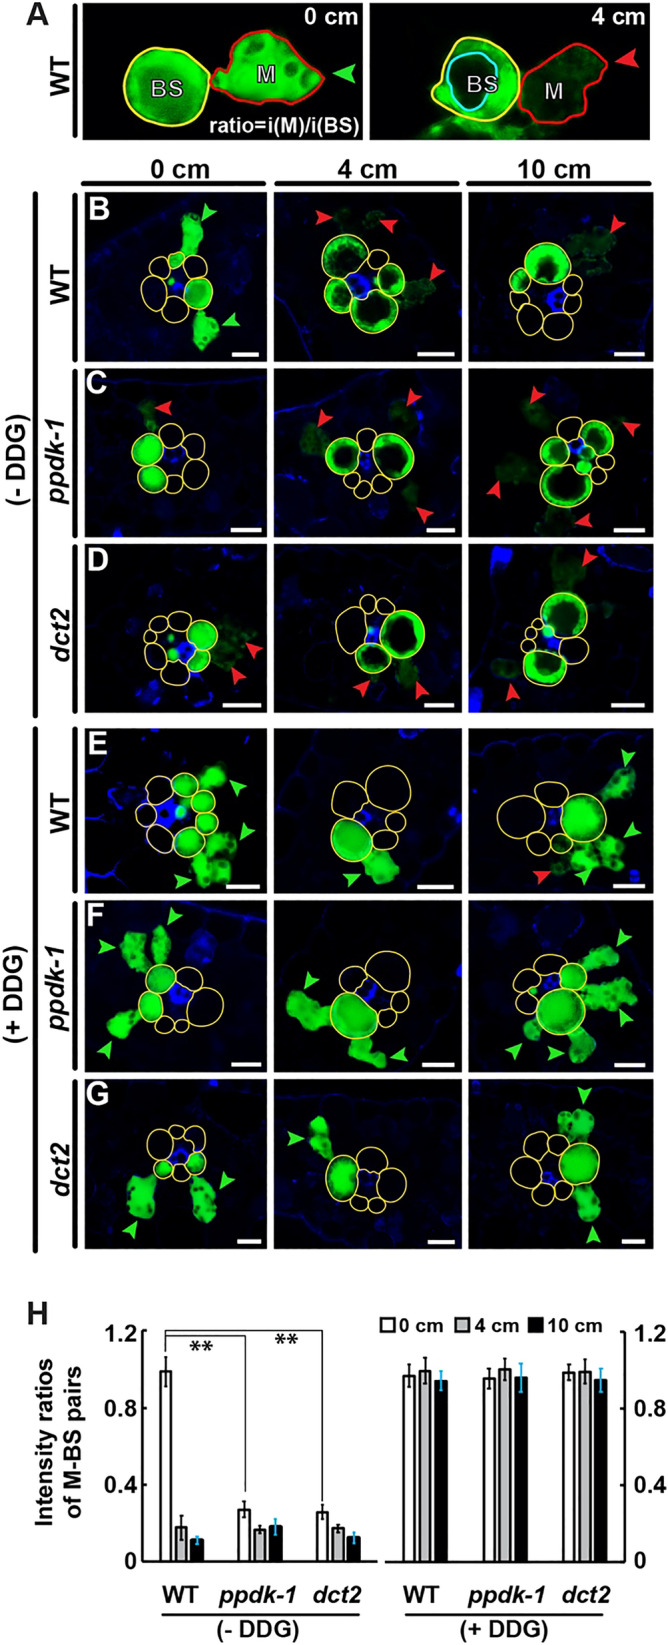
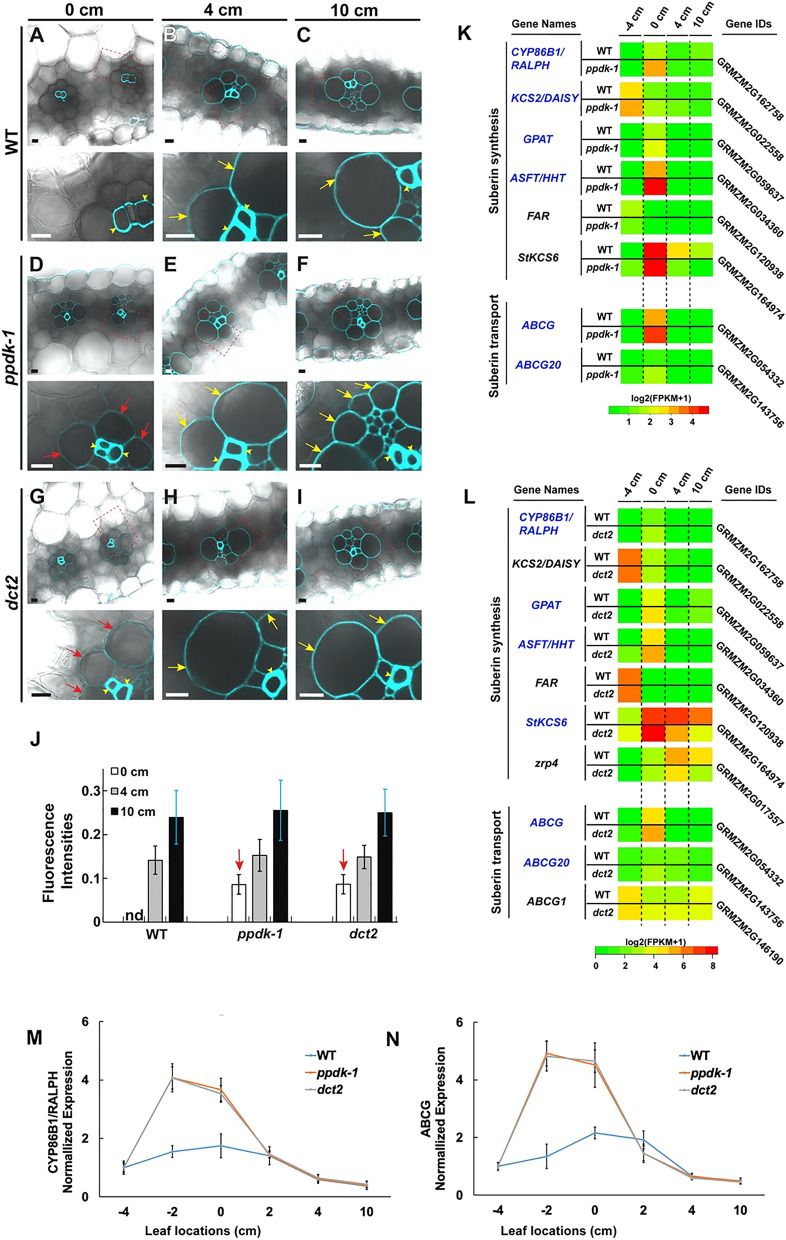
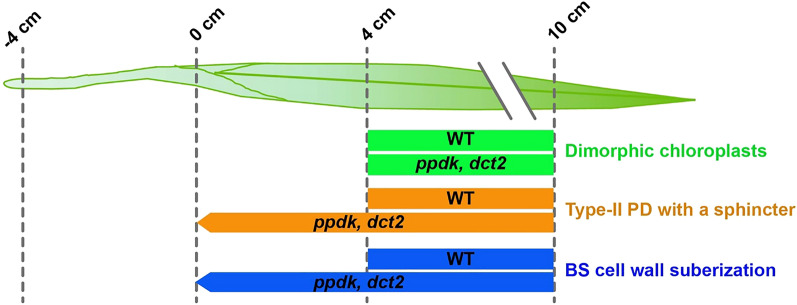
C4 photosynthesis in the maize leaf involves the exchange of organic acids between mesophyll (M) and the bundle sheath (BS) cells. The transport is mediated by plasmodesmata embedded in the suberized cell wall. We examined the maize Kranz anatomy with a focus on the plasmodesmata and cell wall suberization with microscopy methods. In the young leaf zone where M and BS cells had indistinguishable proplastids, plasmodesmata were simple and no suberin was detected. In leaf zones where dimorphic chloroplasts were evident, the plasmodesma acquired sphincter and cytoplasmic sleeves, and suberin was discerned. These modifications were accompanied by a drop in symplastic dye mobility at the M-BS boundary. We compared the kinetics of chloroplast differentiation and the modifications in M-BS connectivity in ppdk and dct2 mutants where C4 cycle is affected. The rate of chloroplast diversification did not alter, but plasmodesma remodeling, symplastic transport inhibition, and cell wall suberization were observed from younger leaf zone in the mutants than in wild type. Our results indicate that inactivation of the C4 genes accelerated the changes in the M-BS interface, and the reduced permeability suggests that symplastic transport between M and BS could be regulated for normal operation of C4 cycle.


Conflict of interest statement

The authors declare no competing interests.

Figures

Figure 1
Figure 1
Dimorphic chloroplasts in the B73 seedling leaf. (A) A 9-day old maize B73 seedling. The first (1), second (2), and third (3) leaves are marked. (B) The four positions (−4, 0, 4, 10 cm) of the third leaf were isolated for microscopy analysis (dashed rectangles). (C–F) Low-magnification TEM images of the four segments in (B). The vascular bundle and BS cells are enclosed in the red outline in each panel. Blue brackets indicate epidermis (e) layers. V vacuole. Scale bars: 10 µm. (G–J) TEM photos of chloroplasts in M cells (upper row) and BS cells (lower row) in the four locations along the leaf. Scale bars: 1.0 µm. (K–N) Higher magnification micrographs of the boxed areas in (H) and (I) to show grana stacks in M chloroplasts (red brackets in K and M) and stroma lamellae in BS chloroplasts (arrows in L and N). Starch particles are denoted with asterisks. (O–R) Starch granules after iodine staining. Starch accumulation in BS cells (outlined with blue lines) is discerned in the 4- and 10-cm samples (blue arrowheads). Scale bars: 50 µm. (S) Lengths of M (white bars) and BS (grey bars) chloroplasts in TEM micrographs. Longer axes of chloroplasts (n =  ~ 25 for each stage) were measured. Error bars correspond to standard deviations (SD) (**, p < 0.01; Student’s t-test).
Figure 2
Figure 2
ET analysis of thylakoid assembly in chloroplasts of the maize leaf. (A–F) Tomographic slice images of thylakoids in M and BS chloroplasts (left) and 3D models (right) in (A,B) −4-cm, (C,D) 0-cm, and (E,F) 4-cm sections. Stacked and unstacked regions of thylakoids are colored in green and yellow, respectively in 3D models. Grana stacks were highlighted with red brackets, unstacked stroma lamellae are marked with blue arrows in (D,F). In panels (C,E), the thylakoid models were clipped to reveal their stack architectures. Scale bars: 500 nm. (G) Average numbers of disks per granum in M and BS chloroplasts (n = 10 per cell type and stage). Error bars depict standard deviations (SDs) (**, p < 0.01; ns, not significant; Student’s t-test). (H) Average widths of grana stacks in M and BS chloroplasts (n = 10 per cell type and stage). Error bars depict SDs (*, p < 0.05; **, p < 0.01; Student’s t-test).
Figure 3
Figure 3
Immunofluorescence localization of chloroplast proteins in M and BS cells at the four leaf development stages. Localization of (A–C) PsbO, (D–F) Lhca, and (G–I) Rubisco large subunit was detected. For each protein, low magnification micrographs (upper images) and higher magnification micrographs of the boxed areas in 0 and 4 cm sections (lower left images) are shown. Cell walls (green) were stained to illustrate Kranz anatomy. BS cells are marked with asterisks in the low magnification images. M and BS chloroplasts are indicated with arrows and arrowheads, respectively, in high magnification images. M chloroplasts are more strongly stained by the PsbO in 4-cm section (B). The opposite is true Rubisco in 4-cm sections (H). Scale bars: 10 µm. Inset graphs (C,F,I) plot fluorescence intensities from M and BS chloroplasts in 0- 4-, and 10-cm sections. Chloroplast fluorescence values were normalized with cell wall fluorescence intensity in each micrograph. Error bars depict standard SDs (**, p < 0.01; Student t-test).
Figure 4
Figure 4
Ultrastructure of PD connecting M and BS cells. (A) TEM micrographs of PD at the M-BS interface in wild-type B73 (WT) leaves. PD sphincters are marked with arrowheads. Scale bars, 100 nm. (B,C) PD and the plasma membrane at the M-BS interface as observed in (B) ET slice images and (C) 3D models. Sphincters, desmotubules, plasma membrane, and cytoplasmic sleeves are marked with magenta arrows, red arrows, yellow arrowheads, and red “H”s respectively. Scale bars, 150 nm. (D–F) TEM micrographs of PD at the M-BS interface in (D) ppdk-1 leaves, (E) ET slice images, and (F) 3D models. Sphincters, desmotubules, plasma membrane, and cytoplasmic sleeves are marked with magenta arrows, red arrows, yellow arrowheads, and red “H”s respectively. (G,H) Morphometric comparisons of PD at the M-BS interface in WT (white bars) and ppdk-1 (gray bars) leaves. (G) Sphincter diameters and (H) cytoplasmic sleeve widths were measured from tomograms at the three stages. Approximately 20 PD from three different plants were examined for each genotype and each stage. Error bars depict SDs (**, p < 0.01; ns: not significant; Student’s t-test). (I) TEM micrographs of PD at the M-BS interface in dct2 leaves. PD sphincters were discerned in 0-cm sections from the ppdk-1 and dct2 mutant leaves. Sphincters are indicated by arrowheads.
Figure 5
Figure 5
CFDA movement assay. (A) Confocal laser scanning micrographs of CFDA fluorescence (green) in WT leaf cross sections (0 and 4 cm). Typical M-BS pairs at 0 cm (left) and 4 cm (right) in WT leaf cross sections emit CFDA fluorescence. Green arrowhead marks fluorescence in M cell comparable to that in BS cell. Red arrowheads indicate faint fluorescence in M cell. Light blue compartment indicates central vacuole. (B–G) WT, ppdk-1, and dct2 leaves (B–D) without DDG or (E–G) with DDG. M-BS units in which the M cells display fluorescence comparable to (less than 30% reduction) the BS cell are denoted with green arrowheads. Red arrowheads mark M cells in which fluorescence is weaker (less than 30% that in BS cell). Note that M cells in the 0-cm ppdk-1 and dct2 sections do not contain dye. BS cell walls are highlighted with yellow lines. Scale bars: 25 µm. (H) CFDA fluorescence ratios in M-BS units. The fluorescence intensities from the cytosols of M and BS cells were quantified to determine ratios. Central vacuoles were excluded when intensities were calculated (**, p < 0.01; Student’s t-test).
Figure 6
Figure 6
Suberin accumulation in BS cell wall. (A–I) Leaf sections at 0 cm, 4 cm, and 10 cm from (A–C) WT B73, (D–F) ppdk-1, and (G–I) dct2 plants stained for suberin. In each panel, lower micrograph images correspond to higher magnifications of the boxed areas in upper micrographs. BS and xylem cell walls visualized by suberin staining are indicated with arrows (red arrows for 0-cm and yellow arrows for 4-and 10-cm images) and arrowheads, respectively. Note that BS cell walls in 0-cm ppdk-1 and dct2 samples stain for suberin staining (D,G), whereas BS cell walls in 0-cm WT sample do not (A). Scale bars: 10 µm. (J) Fluorescence intensities of BS cell walls in WT, ppdk-1, and dct2 leaf 0-cm (white bars), 4-cm (gray bars), and 10-cm (black bars) sections. Fluorescence values of BS cell walls were normalized to those of adjacent xylem walls. (K,L) Heat maps illustrating changes in transcript levels of genes involved in suberin synthesis or transport in ppdk-1 (K) and dct2 (L) leaves. All genes with FPKM values higher than 1 were included in the heat maps (Supplemental Fig. S7). Genes transcribed more actively in the mutant than WT in 0-cm are in blue letters. (M,N) qRT-PCR-based quantification of (M) CYP86B1 and (N) ABCG in six locations in the maize leaf. GAPDH was used as the reference gene. Error bars indicate SDs.
Figure 7
Figure 7
Differentiation/maturation timelines of chloroplasts, PD, and BS suberization in the maize leaf. Type-II PD refer to PD with cytoplasmic sleeves. PD maturation and BS suberization are observed from the 0 cm zone of ppdk-1 and dct2 mutant leaves.

Similar articles

Cited by

References

    1. Leegood RC. C4 photosynthesis: principles of CO2 concentration and prospects for its introduction into C3 plants. J. Exp. Bot. 2002;53:581–590. doi: 10.1093/jexbot/53.369.581. - DOI - PubMed
    1. Taniguchi, M. & Cousins, A. B. The Leaf: A Platform for Performing Photosynthesis (eds. Terashima, I., & Adams Iii, W.W.). 255–279. (Springer, 2018).
    1. Edwards GE, et al. Compartmentation of photosynthesis in cells and tissues of C(4) plants. J. Exp. Bot. 2001;52:577–590. doi: 10.1093/jexbot/52.356.577. - DOI - PubMed
    1. Lundgren MR, Osborne CP, Christin P-A. Deconstructing Kranz anatomy to understand C4 evolution. J. Exp. Bot. 2014;65:3357–3369. doi: 10.1093/jxb/eru186. - DOI - PubMed
    1. Sedelnikova OV, Hughes TE, Langdale JA. Understanding the genetic basis of C 4 Kranz anatomy with a view to engineering C 3 crops. Annu. Rev. Genet. 2018;52:249–270. doi: 10.1146/annurev-genet-120417-031217. - DOI - PubMed

Publication types