. 2022 Aug;29(8):1596-1610.
doi: 10.1038/s41418-022-00950-z. Epub 2022 Mar 23.

Disruption of GMNC-MCIDAS multiciliogenesis program is critical in choroid plexus carcinoma development

Affiliations

Disruption of GMNC-MCIDAS multiciliogenesis program is critical in choroid plexus carcinoma development

Qun Li et al. Cell Death Differ. 2022 Aug.

Abstract

Multiciliated cells (MCCs) in the brain reside in the ependyma and the choroid plexus (CP) epithelia. The CP secretes cerebrospinal fluid that circulates within the ventricular system, driven by ependymal cilia movement. Tumors of the CP are rare primary brain neoplasms mostly found in children. CP tumors exist in three forms: CP papilloma (CPP), atypical CPP, and CP carcinoma (CPC). Though CPP and atypical CPP are generally benign and can be resolved by surgery, CPC is a particularly aggressive and little understood cancer with a poor survival rate and a tendency for recurrence and metastasis. In contrast to MCCs in the CP epithelia, CPCs in humans are characterized by solitary cilia, frequent TP53 mutations, and disturbances to multiciliogenesis program directed by the GMNC-MCIDAS transcriptional network. GMNC and MCIDAS are early transcriptional regulators of MCC fate differentiation in diverse tissues. Consistently, components of the GMNC-MCIDAS transcriptional program are expressed during CP development and required for multiciliation in the CP, while CPC driven by deletion of Trp53 and Rb1 in mice exhibits multiciliation defects consequent to deficiencies in the GMNC-MCIDAS program. Previous studies revealed that abnormal NOTCH pathway activation leads to CPP. Here we show that combined defects in NOTCH and Sonic Hedgehog signaling in mice generates tumors that are similar to CPC in humans. NOTCH-driven CP tumors are monociliated, and disruption of the NOTCH complex restores multiciliation and decreases tumor growth. NOTCH suppresses multiciliation in tumor cells by inhibiting the expression of GMNC and MCIDAS, while Gmnc-Mcidas overexpression rescues multiciliation defects and suppresses tumor cell proliferation. Taken together, these findings indicate that reactivation of the GMNC-MCIDAS multiciliogenesis program is critical for inhibiting tumorigenesis in the CP, and it may have therapeutic implications for the treatment of CPC.


Conflict of interest statement

The authors declare no competing interests.

Figures

Fig. 1
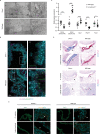
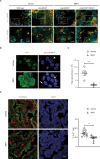
Fig. 1. Multiciliation defects and GMNC program deficiencies in CP tumors.
A Copy number analysis of human CPC (n = 23 tumors from 23 individuals) and CPP (n = 32 tumors from 32 individuals). B Representative images of human CP tumors that show GMNC and FOXJ1 expression by RNAscope (left panels), and ARL13B expression by immunostaining (brown signals in upper right panels, red signals in lower right panel). DAPI staining (blue, lower right panel) labels nuclei. Scale bars, 25 µm. Results were obtained from at least three independent experiments. C Summary of GMNC and FOXJ1 expression in human CP tumors shown in B (CPC: n = 11; CPP: n = 31). D Summary of cilia status in human CP tumors (CPC: n = 6; CPP: n = 11). E RT-qPCR analysis of the expression of GMNC, MCIDAS and FOXJ1 in CP tumors and normal control tissues in humans (CPP: n = 10; CPC: n = 8; normal tissue: n = 1 for brain, trachea, lung, testis, and epididymis, respectively; mean ± s.e.m., student t-test, **P < 0.01). Data represent two independent experiments.
Fig. 2
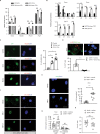
Fig. 2. GMNC-MCIDAS transcriptional program is required for MCC formation in the CP.
A Transmission electron micrographs are shown of CP epithelial cells in newborn Gmnc/ (asterisks) and wild type (arrow) mice. Boxed regions are magnified on the right. Notice that Gmnc/ CP epithelial cell exhibits single basal body and solitary cilia compared to wild type epithelial cell with multiple basal bodies. CP choroid plexus, C cilia, BB basal body. Images are representative of at least three independent experiments. B The expression of acetylated α-tubulin (ac-α-tub, magenta) and γ-tubulin (green) is shown in the CP epithelial cells in newborn Gmnc/ and wild type animals. Boxed regions are shown in higher magnification on the right. DAPI staining (cyan) labels nuclei. Scale bar, 20 µm. BB basal body. Images represent three independent experiments. C RT-qPCR analysis of the expression of Gmnc (primers/probe from exons 4/5 or 2/3), Aqp1 TAp73, and Foxj1 in the CP from Lcre;Gmncflox/− and wild type mice at day P7 (n = 11 animals per genotype, mean ± s.e.m., paired t-test, ****P < 0.0001). Data represent three independent experiments. D Representative images of the expression of Gmnc and Foxj1 (upper panel), Mcidas and Myb (lower panel) are shown at day E13.5 in roof plate (upper roof plate marked by dotted lines) and CP in the hindbrain and the lateral ventricle in Gmnc/ (arrowheads) and wild type (arrows) animals. Scale bars, 50 µm. Images represent at least three independent experiments. E The expression of ARL13B (yellow) and AQP1 (green) is shown in the CP epithelial cells in the hindbrain and lateral ventricles at day P7 in Mcidas/ (arrowheads) and wild type (arrows) animals. DAPI staining (cyan) labels nuclei. Scale bars, 10 µm. Results were obtained from three independent experiments.
Fig. 3
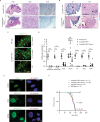
Fig. 3. Disruption of GMNC-MCIDAS program mediates multiciliation defects in Rb1/Trp53-deficient CPC.
A Hematoxylin and eosin (H&E) staining and Ki-67 expression are shown in CPC (arrowheads, boundary between tumor and unaffected brain region is marked by dotted lines) and the CP (arrows) from Lcre;p53cko;Rbcko and Lcre;p53cko;Rbcko;Gmnccko animals. Scale bars, 50 µm. Images are representative of at least three independent experiments. B RNAscope analysis of Gmnc and Mcidas expression in tumor cells (arrowheads, boundary between tumor and unaffected brain region is marked by dotted line) and the CP (arrows) in Lcre;p53cko;Rbcko and Lcre;p53cko;Rbcko;Gmnccko animals. Scale bar, 50 µm. Results were obtained from three independent experiments. C Representative images of immunofluorescence of ARL13B (yellow) and OTX2 (green) are shown in multiciliated epithelial cells (arrows) or monociliated tumor cells (arrowheads) in wild type and Lcre;p53cko;Rbcko animals, respectively. Scale bar, 10 µm. Data represent three independent experiments. D RT-qPCR analysis of gene expression in wild type CP and CPC from Lcre;p53cko;Rbcko and Lcre;p53cko;Rbcko;Gmnccko animals (wild type CP: n = 10; CPC: n = 11 for Lcre;p53cko;Rbcko animals, n = 10 for Lcre;p53cko;Rbcko;Gmnccko animals; mean ± s.e.m., one-way ANOVA, *P < 0.05, ****P < 0.0001, NS not significant). Data represent three independent experiments. E Representative images of immunofluorescence of ARL13B (red) are shown in tumor cells from Lcre;p53cko;Rbcko;Gmnccko animals infected with viruses expressing GMNC-myc (green) or MCIDAS-myc (green). OTX2 (green) labels tumor cells. DAPI staining (blue) labels nuclei. Scale bar, 20 µm. Three independent experiments were conducted. F Kaplan–Meier curve depicting the survival of Lcre;p53cko;Rbcko, Lcre;p53cko;Rbcko;Gmnc−/+, and Lcre;p53cko;Rbcko;Gmnccko animals compared to wild type mice.
Fig. 4
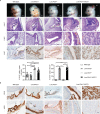
Fig. 4. Aberrant NOTCH and SHH signaling drive CPC in mice.
A Wild type, Lcre;NICD1, Lcre;Ptchcko, and Lcre;Ptchcko;NICD1 animals are shown at day E14.5. Notice the cranium defects resulting from enlarged and folded roof plate in the midbrain-hindbrain region of Lcre;Ptchcko and Lcre;Ptchcko;NICD1 animals (white arrowheads). H&E staining and Ki-67 expression are shown of roof plate (upper roof plate marked by red lines) and the CP (black arrows) in the hindbrain in wild type and Lcre;Ptchcko animals, and CPP and abnormal CP growth (black arrowheads) in Lcre;NICD1 and Lcre;Ptchcko;NICD1 animals, respectively. Enlarged roof plate disrupts the cranium in Lcre;Ptchcko and Lcre;Ptchcko;NICD1 animals (red arrows). The upper roof plate is shown in higher magnification in the right (Lcre;Ptchcko;NICD1 animal) and lower (wild type, Lcre;NICD1, Lcre;Ptchcko, and Lcre;Ptchcko;NICD1 animals) panels. Scale bars, 100 µm. Quantification of Ki-67 expression in the upper roof plate and CP in the hindbrain is shown (wild type mice: n = 11; Lcre;NICD1 mice: n = 4; Lcre;Ptchcko mice: n = 3; Lcre;Ptchcko;NICD1 mice: n = 7 for upper roof plate, n = 8 for the CP; mean ± s.e.m., one-way ANOVA, ***P < 0.001; ****P < 0.0001). Data are representative of at least three independent experiments. B Representative results of immunohistochemical staining for OTX2, and AQP1 are shown in the upper roof plate (marked by dotted lines) and the CP (arrows) in the hindbrain at day E14.5 in wild type and Lcre;Ptchcko animals, and CPP and abnormal CP growth (black arrowheads) in Lcre;NICD1 and Lcre;Ptchcko;NICD1 animals, respectively. Residual AQP1-expressing epithelial cells (red arrowhead) are mixed with tumor cells in Lcre;NICD1 animals. Scale bar, 50 µm. Images represent at least three independent experiments.
Fig. 5
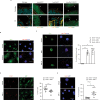
Fig. 5. NOTCH activation leads to reduced multiciliation in CP tumors.
A Immunofluorescent staining for ARL13B (yellow) is shown at day E14.5 in the upper roof plate progenitors (marked by dotted lines and orange arrowheads) and the CP epithelial cells (arrows) in the hindbrain in wild type and Lcre;Ptchcko animals, and CPP and abnormal CP growth (white arrowheads and dotted lines) in Lcre;NICD1 and Lcre;Ptchcko;NICD1 animals, respectively. GFP (green) labels tumor cells. DAPI staining (cyan) labels nuclei. Scale bar, 10 µm. Results were obtained from at least three independent experiments. The expression of ARL13B (red) is shown in tumor cells infected with viruses expressing GFP-tagged dnMAML1 or GFP (B), or treated with vehicle, or IMR-1/IMR-1A (C). GFP (green) labels infected or treated cells. DAPI staining (blue) labels nuclei. Scale bars, 20 µm. The percentage of multiciliated tumor cells after treatment is shown (n = 3, mean ± s.e.m., two-tailed unpaired t-test, **P < 0.01, ***P < 0.001). Results were obtained from at least three independent experiments, respectively. D The expression of Ki-67 (red) is shown in GFP+ tumor cells treated with vehicle or IMR-1. Quantitation of Ki-67 expression is shown (n = 6 per treatment; mean ± s.e.m., paired t-test, ***P < 0.001). Results were obtained from at least three independent experiments. E RNAscope analysis of Foxj1 expression (red) is shown in tumor cells treated with vehicle or IMR-1. DAPI staining (blue) labels nuclei. Scale bar, 20 µm. Quantification of Foxj1 transcript is shown on the right (n = 7 per treatment; mean ± s.e.m., two-tailed unpaired t-test, **P < 0.01). Data are representative of three independent experiments.
Fig. 6
Fig. 6. NOTCH inhibition restores multiciliation in CP tumors.
Representative images of immunofluorescent staining for ARL13B (A, yellow; B, red) are shown in tumor cells at day E17.5 (A) and tumor cells isolated at day P7 (B) from Lcre;NICD1 (A, B) and Lcre;Ptchcko;NICD1 (A) animals treated with vehicle or IMR-1 from day E10.5 to day E16.5. Boxed region of ciliated cells is magnified in lower panel (A). DAPI staining (A, cyan; B, blue) labels nuclei. Scale bars, 5 µm (A), 10 µm (B). Results were obtained from at least three independent experiments. C Quantification total tumor cell numbers isolated at day P7 is shown in Lcre;NICD1 animals treated as described in A and B (n = 5 animals per treatment; mean ± s.e.m., two-tailed unpaired t-test, ***P < 0.001). D The expression of Ki-67 (red) in NICD1+/GFP+ tumor cells at day E17.5 is shown in Lcre;NICD1 animals treated with vehicle or IMR-1 from day E10.5 to day E16.5. DAPI staining (blue) labels nuclei. Scale bar, 20 µm. Quantification of Ki-67 expression in tumor cells is shown (right panel: n = 9 animals for vehicle, n = 8 animals for IMR-1; mean ± s.e.m., two-tailed unpaired t-test, **P < 0.01). Data are representative of three independent experiments.
Fig. 7
Fig. 7. Gmnc suppression by NOTCH mediates multiciliation defects in CP development and tumorigenesis.
A Median FKPM (fragments per kilobase of exon per million reads mapped) values of genes in NOTCH-driven CP tumors and wild type CPs (n = 3 specimens per time point, mean ± s.e.m., two-tailed unpaired t-test, *P < 0.05; **P < 0.01). B RT-qPCR analysis of NOTCH-driven CPP and wild type CP (n = 3 animals per time point, mean ± s.e.m., two-tailed unpaired t-test, ***P < 0.001, ****P < 0.0001). Three independent experiments were conducted. C The expression of ARL13B (red) is shown in tumor cells infected with viruses expressing GMNC-myc, MCIDAS-myc, or control only. GMNC-myc (green), or MCIDAS-myc (green) labels infected cells. DAPI staining (blue) labels nuclei. Scale bar, 20 µm. Quantification of the percentage of MCCs in infected cells is shown on the right (n = 4 per treatment, mean ± s.e.m., one-way ANOVA, *P < 0.05). Results were obtained from three independent experiments. D The expression of Ki-67 (red) is shown in tumor cells from Lcre;NICD1 mice infected with viruses expressing GMNC-myc. GMNC-myc (green) labels infected cells. DAPI staining (blue) labels nuclei. Scale bar, 20 µm. Quantification of Ki-67 expression in tumor cells from Lcre;NICD1 mice infected with viruses expressing GMNC-myc or control vectors is shown in the lower panel (n = 5 per treatment, mean ± s.e.m., paired t-test, ****P < 0.0001). Data represent at least three independent experiments. E Representative images of Gmnc expression (green) by RNAscope are shown in tumor cells treated with vehicle or IMR-1. DAPI staining (blue) labels nuclei. Scale bar, 20 µm. Quantification of Gmnc transcript is shown (n = 7 per treatment; mean ± s.e.m., two-tailed unpaired t-test, ***P < 0.001). Three independent experiments were conducted. F The expression of ARL13B (red) is shown in Gmnc-deficient tumor cells treated with vehicle or IMR-1/IMR-1A. GFP (green) labels tumor cells. DAPI staining (blue) labels nuclei. Scale bar, 20 µm. Data represent five independent experiments. G RT-qPCR analysis of Foxj1 expression in tumor cells treated with vehicle or IMR-1 (tumors from Lcre;NICD1 mice: n = 6 per treatment; tumors from Lcre;NICD1;Gmncflox/− mice: n = 4 per treatment, mean ± s.e.m., paired t-test, *P < 0.05, NS, not significant). Results were obtained from three independent experiments. H Quantification of Ki-67 expression is shown in Gmnc-deficient tumor cells treated with vehicle or IMR-1 (n = 6 per treatment, mean ± s.e.m., two-tailed unpaired t-test, NS not significant). Three independent experiments were conducted.
Fig. 8
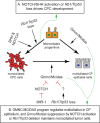
Fig. 8. Schematic diagram of GMNC-MCIDAS program in CP development and tumorigenesis.
A Combined activation of NOTCH and SHH signaling, or loss of Rb1/Trp53 tumor suppressors drives CPC development. B GMNC-MCIDAS program mediates multiciliation in CP epithelium, and is repressed by NOTCH signaling in roof plate progenitors, whereas NOTCH inhibitor IMR-1 promotes GMNC-dependent multiciliation and suppresses tumor growth. GMNC-MCIDAS program suppression in Trp53-deficient CPC maintains monociliated tumor cells.

References

    1. Fame RM, Lehtinen MK. Emergence and developmental roles of the cerebrospinal fluid system. Dev Cell. 2020;52:261–75. - PubMed
    1. Liddelow SA. Development of the choroid plexus and blood-CSF barrier. Front Neurosci. 2015;9:32. - PMC - PubMed
    1. Narita K, Takeda S. Cilia in the choroid plexus: their roles in hydrocephalus and beyond. Front Cell Neurosci. 2015;9:39. - PMC - PubMed
    1. Narita K, Kozuka-Hata H, Nonami Y, Ao-Kondo H, Suzuki T, Nakamura H, et al. Proteomic analysis of multiple primary cilia reveals a novel mode of ciliary development in mammals. Biol Open. 2012;1:815–25. - PMC - PubMed
    1. Nonami Y, Narita K, Nakamura H, Inoue T, Takeda S. Developmental changes in ciliary motility on choroid plexus epithelial cells during the perinatal period. Cytoskeleton. 2013;70:797–803. - PubMed

Publication types

Supplementary concepts