. 2022 Mar 23;5(1):253.
doi: 10.1038/s42003-022-03206-1.

Megapixel camera arrays enable high-resolution animal tracking in multiwell plates

Affiliations

Megapixel camera arrays enable high-resolution animal tracking in multiwell plates

Ida L Barlow et al. Commun Biol. .

Abstract

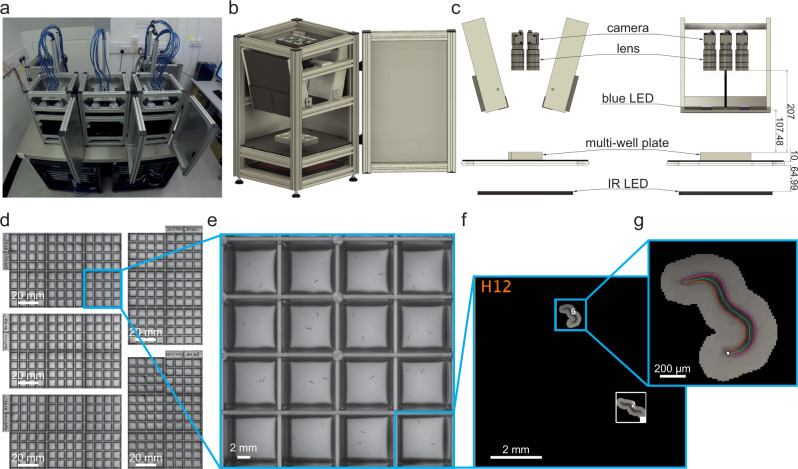
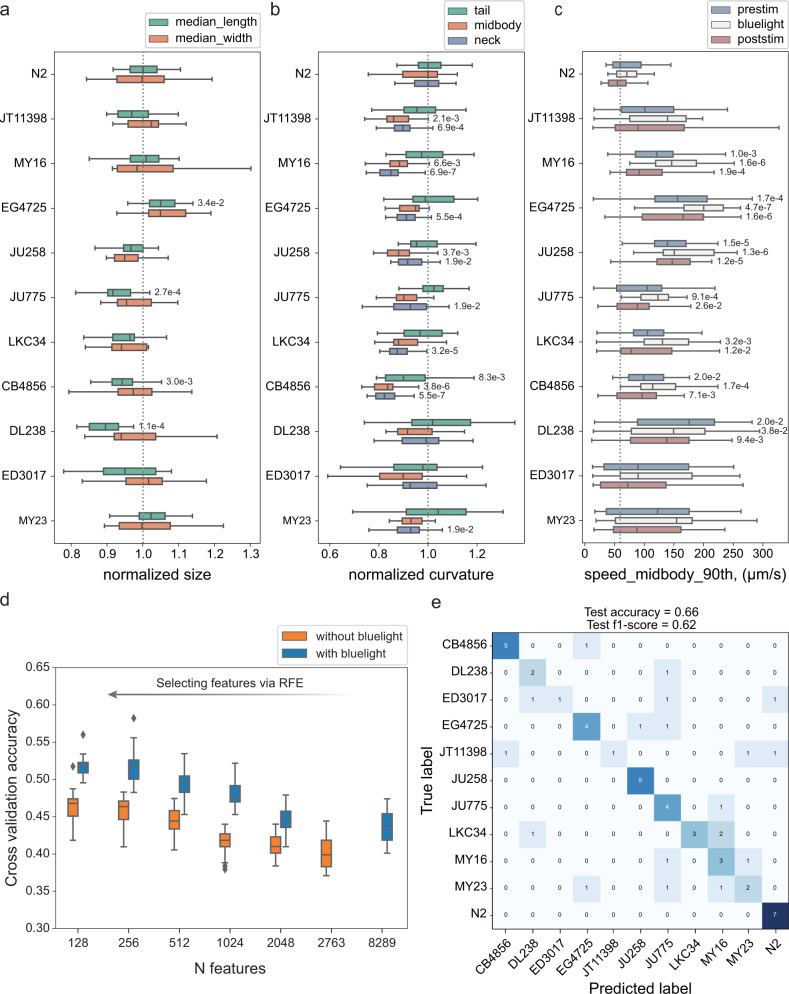
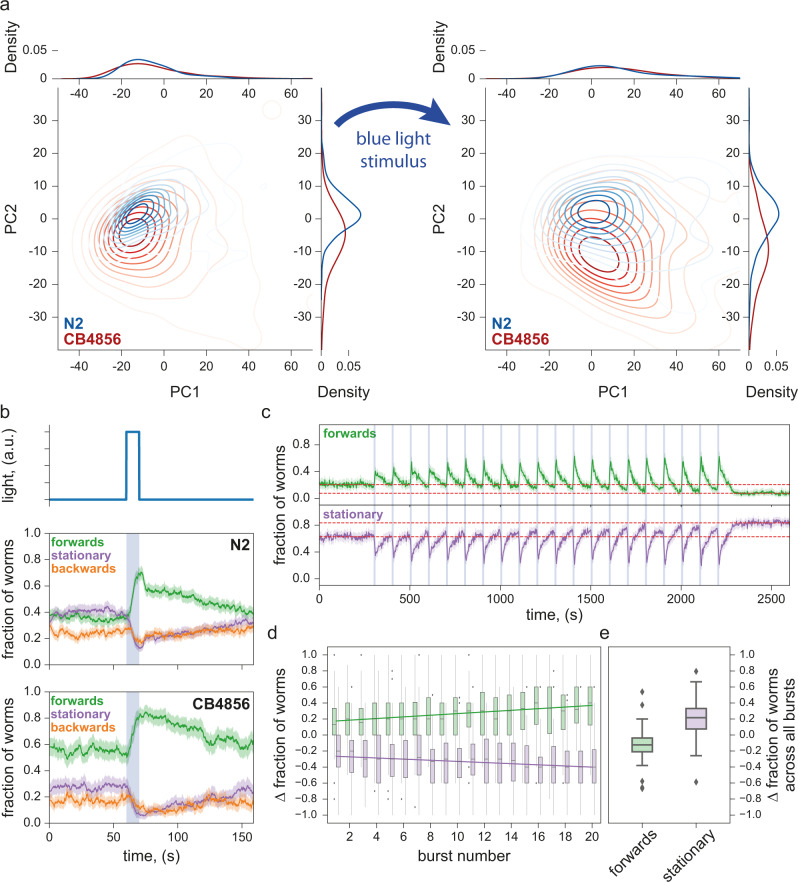
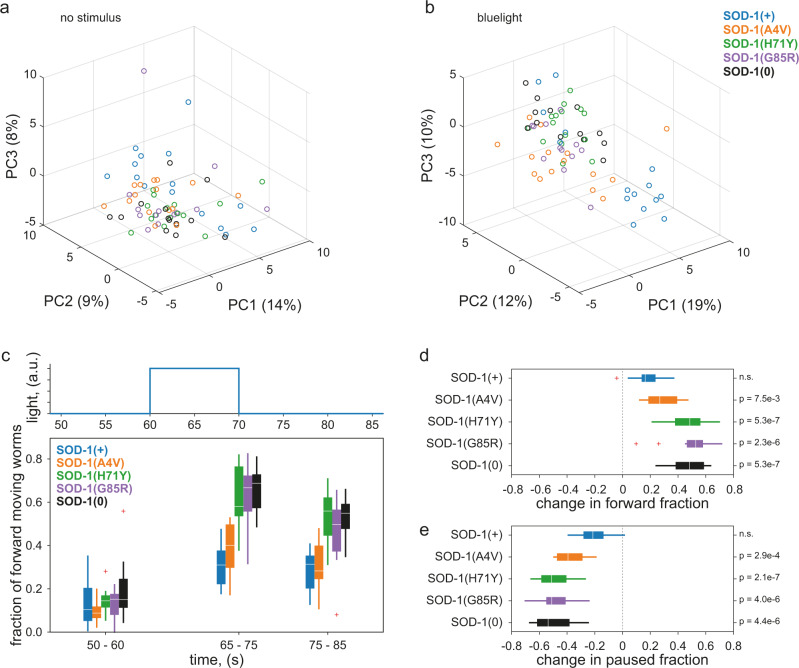
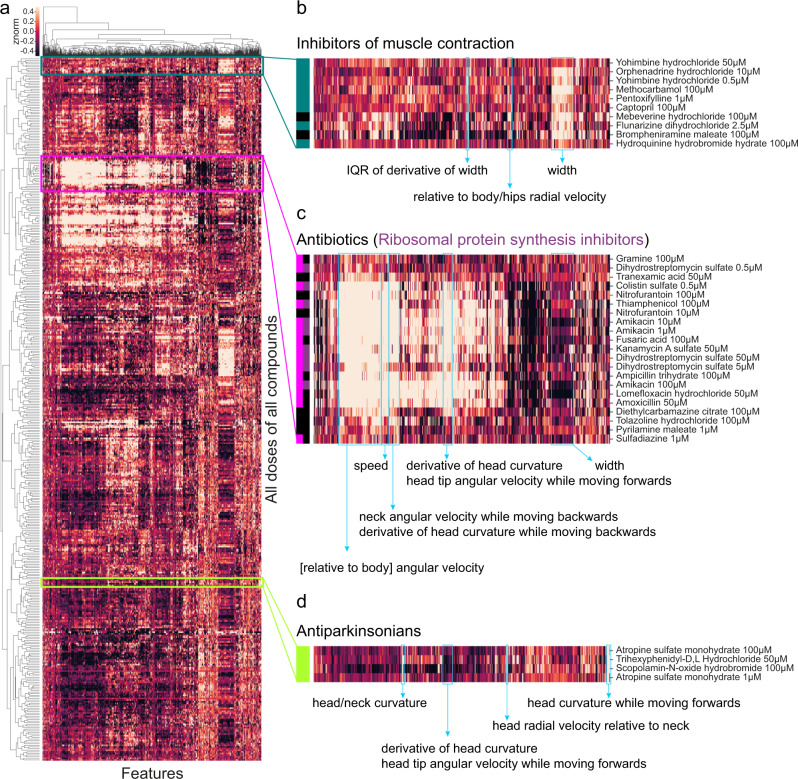
Tracking small laboratory animals such as flies, fish, and worms is used for phenotyping in neuroscience, genetics, disease modelling, and drug discovery. An imaging system with sufficient throughput and spatiotemporal resolution would be capable of imaging a large number of animals, estimating their pose, and quantifying detailed behavioural differences at a scale where hundreds of treatments could be tested simultaneously. Here we report an array of six 12-megapixel cameras that record all the wells of a 96-well plate with sufficient resolution to estimate the pose of C. elegans worms and to extract high-dimensional phenotypic fingerprints. We use the system to study behavioural variability across wild isolates, the sensitisation of worms to repeated blue light stimulation, the phenotypes of worm disease models, and worms' behavioural responses to drug treatment. Because the system is compatible with standard multiwell plates, it makes computational ethological approaches accessible in existing high-throughput pipelines.


Conflict of interest statement

The authors declare the following competing interests: MH and JRS are employees/owners of LoopBio. All other authors declare no competing interests.

Figures

Fig. 1
Fig. 1. Schematic of megapixel camera arrays.
a Five identical camera arrays were mounted on an air supported table. The associated workstations to run the Motif software were arranged in the two server racks underneath. b 3D schematic drawing of a single imaging unit (Kastl–Highres). The six cameras were mounted on a plate that is connected to the rig frame by three spring-loaded screws, and can be moved along the vertical axis. This allows for changing the focal plane of all six cameras at once. One of the imaging unit’s side panels is omitted from this view. c Technical drawing (front and side view) of an imaging unit annotated with dimensions in millimetres. d Using five identical units, 480 wells can be recorded simultaneously. Zooming in to the (e) camera, (f) well, (g) and worm level shows that this system achieves enough resolution to precisely track the nematodes. Each square well measures 8 × 8 mm.
Fig. 2
Fig. 2. Natural variation in behaviour.
ac Examples of features describing morphology, movement, and posture. Each box shows median, 25th and 75th percentile (central mark, left and right edge, respectively), while whiskers show the rest of the distribution except for outliers (outside 1.5 times the IQR above the 75th and below the 25th percentile). Numbers near the boxplots are the p-values indicating statistically significant differences between N2 and wild isolates at a false discovery rate of 5% using Kruskal-Wallis tests and correcting for multiple comparisons with the Benjamin-Yekutieli method. P-values are omitted for nonsignificant differences. a Morphological differences were detected between strains. The length and the midbody width varied in a nonuniform way among strains. b Adequate resolution enabled detailed characterisation of the worm posture and the detection of differences among strains in multiple dimensions. The curvature at different parts of the body varied in a nonuniform way among strains. The neck curvature showed more significant differences. The parts of the body are defined following the conventions adopted in Tierpsy Tracker. c The speed of wild isolates was on average higher than the speed of N2 worms. The response of wild isolates to blue light stimulus varied; some strains (e.g. EG4725) were more sensitive to blue light compared to N2, while others showed less obvious escape response (e.g. DL238). This provided additional dimensions to the behavioural phenotype. d Using the quantitative behavioural phenotypes, strains were classified with significantly higher accuracy than random. Combining features from different blue light conditions increased the dimensionality of the data and the classification accuracy between strains. e Worm strains were predicted in a held-out test set with 66% accuracy which is higher than random (9%). Sample size, in wells (3 worms per well): NN2 = 34, NJT11398 = 21, NMY16 = 27, NEG4725 = 29, NJU258 = 25, NJU775 = 25, NLKC34 = 27, NCB4856 = 29, NDL238 = 16, NED3017 = 20, NMY23 = 23.
Fig. 3
Fig. 3. Escape response to photostimulation.
a PCA plots of N2 and CB4856 in the 10 sec immediately before (left) and immediately after (right) a 10 s stimulus showing detectable behavioural responses: both strains moved to new, better separated positions in the phenotype space as a result of stimulation. Sample size (in wells, two worms per well) is NN2 = 377, NCB4856 = 115 (left), NN2 = 398, NCB4856 = 98 (right) b Photostimulation with blue light elicited similar escape responses in both N2 and CB4856 strains, with the fraction of worms moving forwards increasing during the stimulus and decreasing after the stimulus. However, post-stimulus recovery appears to occur at two timescales for N2 but not for CB4856. Solid lines are means, shaded areas show the 95% confidence interval. Sample size (in wells, two worms per well) is NN2 = 529, NCB4856 = 396. c Repeated photostimulation triggered increasing aversive response in N2, also leaving a higher fraction of worms stationary after serial stimulation than before (vertical separation between the two dashed lines to contrast the before and the after levels). N = 144 wells (three worms per well). d The fraction of worms triggered to move forwards by each stimulus increased throughout the stimulation series, as a decreasing fraction of worms remained stationary across each successive photostimulus. Each data point was obtained by taking the difference in a 10 s window just before and just after the end of each stimulus. N = 144 wells (3 worms per well). e After repeated photostimulation, a larger fraction of the population than before was stationary. This was quantified by taking the difference of the population fractions in each motion mode between the final 5 min and the initial 5 min of the experiment (red dashed lines in c). Each box shows median, 25th and 75th percentile (central mark, lower and upper edge, respectively), while whiskers show the rest of the distribution except for outliers (outside 1.5 times the IQR above the 75th and below the 25th percentile), plotted individually. N = 144 wells (three worms per well).
Fig. 4
Fig. 4. Blue light stimulation elicits different responses amongst ALS disease models.
ab Principal component analysis of 256 extracted behavioural features from standard (a) or blue light (b) imaging conditions. Features were extracted by Tierpsy Tracker. Each datapoint represents one plate average of the strain, with up to 12 independent wells for each strain in every 96-well plate. Each well contained an average of three worms. The time window represented in B is also shown in (c). c Overall fraction of forward locomotion under blue-light imaging conditions. A 10 s blue light pulse started at t = 60 s and feature values were calculated using 10 s windows centred around 5 sec before, 10 s after, and 20 s after the beginning of each blue light pulse. Plate averages were used to generate the plot for each strain. Each box shows median, 25th and 75th percentile (central mark, lower and upper edge, respectively), while whiskers show the rest of the distribution except for outliers (outside 1.5 times the IQR above the 75th and below the 25th percentile), plotted individually. de Changes in the overall fraction of forward (d) or paused (e) locomotion upon blue light stimulation. The difference was calculated by subtracting the average feature values over the t = 50-60 sec pre-stimulus window from those over the t = 65-75 sec blue light pulse window (these correspond to the first and the second time points in (c). Plate averages were used to generate the plot for each strain. Two sample t-test compared to the SOD-1(+) control strain (n.s. not significant). Each box shows median, 25th and 75th percentile (central mark, left and right edge, respectively), while whiskers show the rest of the distribution except for outliers (outside 1.5 times the IQR above the 75th and below the 25th percentile), plotted individually. Sample size (in wells, three worms per well): Nsod-1(+) = 232, Nsod-1(A4V) = 228, Nsod-1(H71Y) = 211, Nsod-1(G85R) = 165, Nsod-1(0) = 195.
Fig. 5
Fig. 5. Worms respond differently to drugs with different modes of action.
a Heatmap of behavioural fingerprints of worms in response to treatment with drugs. Each row is the average phenotype of worms across multiple wells treated with the same compound at the same dose. Each column is a single behavioural feature. The colour indicates the z-normalised feature value. bd Some compounds from the same class cluster together according to their behavioural response including inhibitors of muscle contraction (b), antibiotics (c), and antiparkinsonian (anticholinergic) drugs (d).

Similar articles

Cited by

References

    1. Gomez-Marin A, Paton JJ, Kampff AR, Costa RM, Mainen ZF. Big behavioral data: psychology, ethology and the foundations of neuroscience. Nat. Neurosci. 2014;17:1455–1462. - PubMed
    1. Anderson DJ, Perona P. Toward a Science of Computational Ethology. Neuron. 2014;84:18–31. - PubMed
    1. Berman GJ. Measuring behavior across scales. BMC Biol. 2018;16:23. - PMC - PubMed
    1. Brown, A. E. X. & de Bivort, B. Ethology as a physical science. Nat. Phys. 14, 653–657 (2018).
    1. Baek J-H, Cosman P, Feng Z, Silver J, Schafer WR. Using machine vision to analyze and classify Caenorhabditis elegans behavioral phenotypes quantitatively. J. Neurosci. Methods. 2002;118:9–21. - PubMed

Publication types