. 2022 Apr;604(7905):343-348.
doi: 10.1038/s41586-022-04533-3. Epub 2022 Mar 23.

AAV-delivered suppressor tRNA overcomes a nonsense mutation in mice

Affiliations

AAV-delivered suppressor tRNA overcomes a nonsense mutation in mice

Jiaming Wang et al. Nature. 2022 Apr.

Abstract

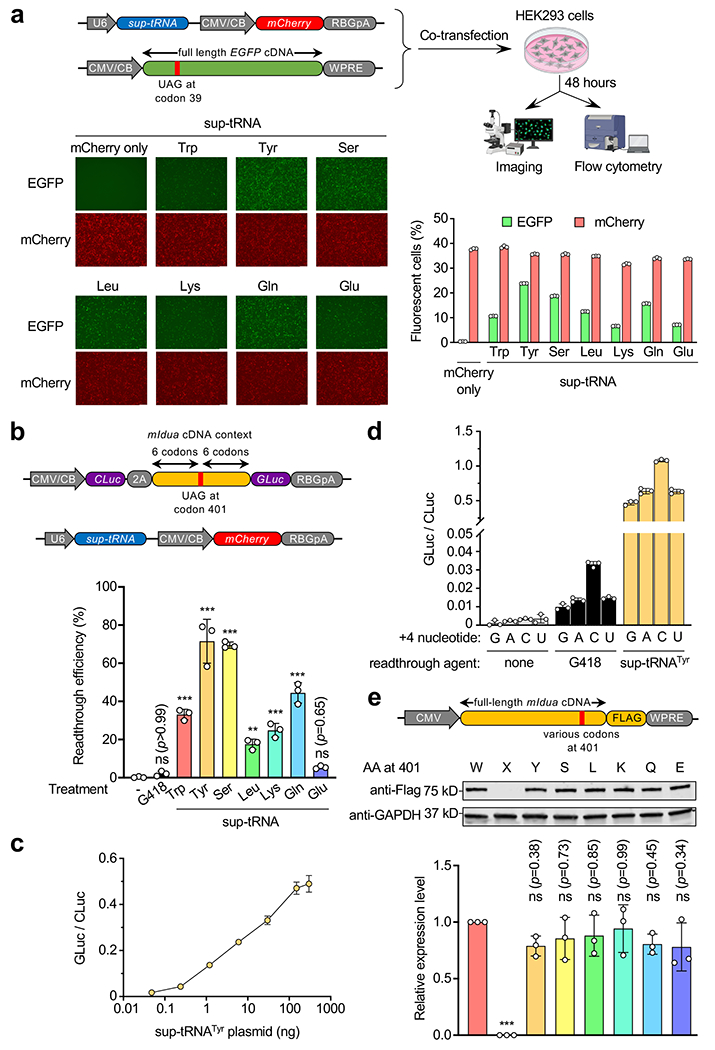
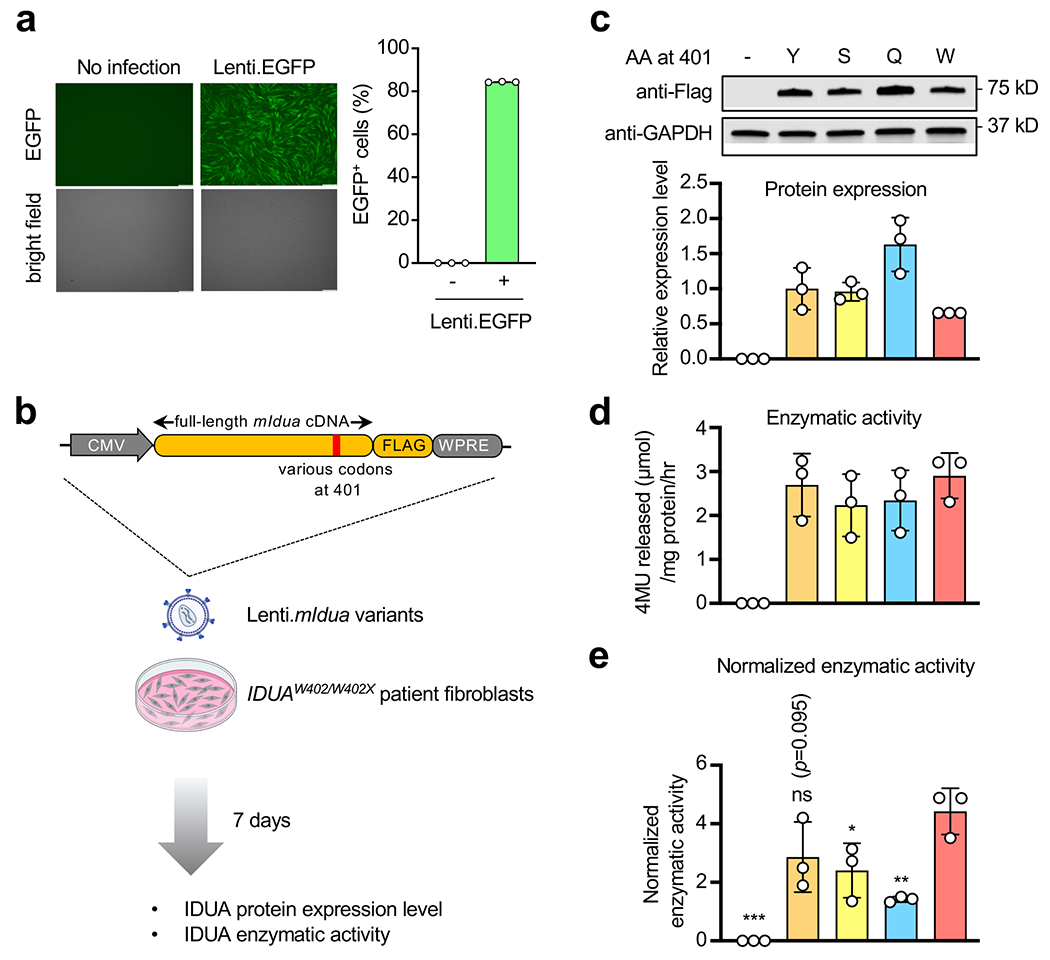
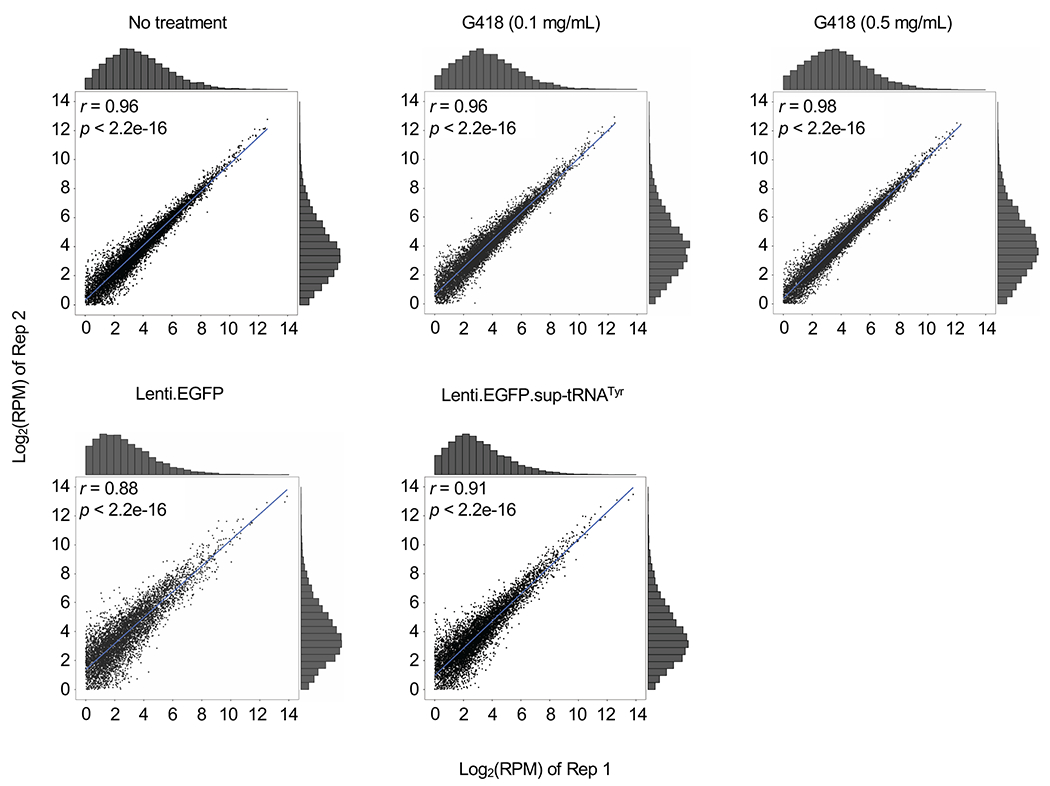
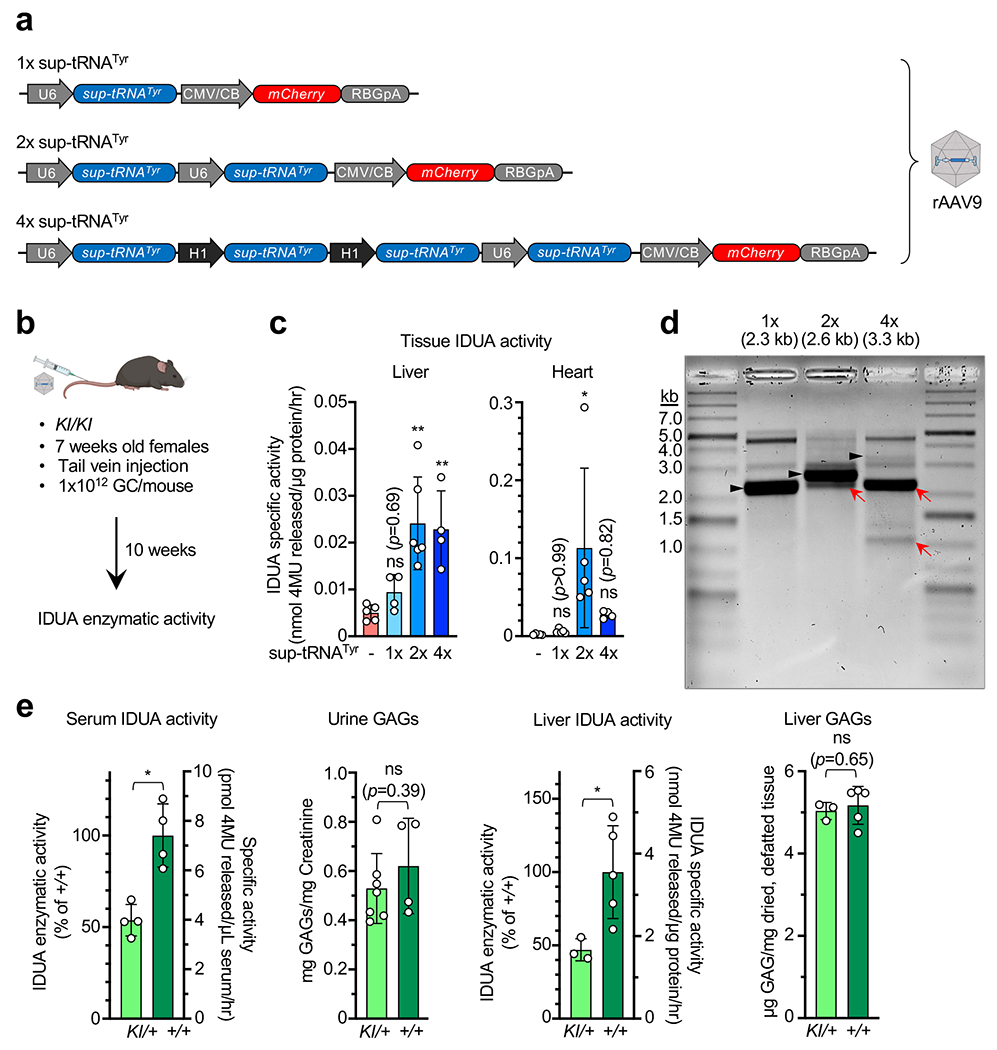
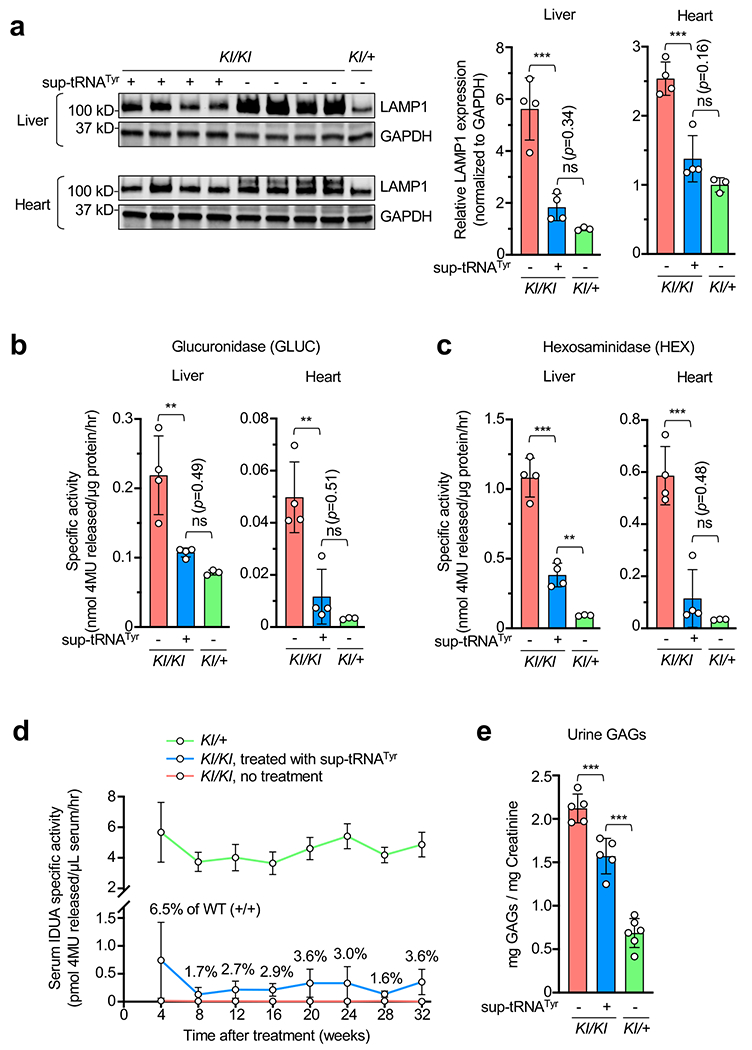
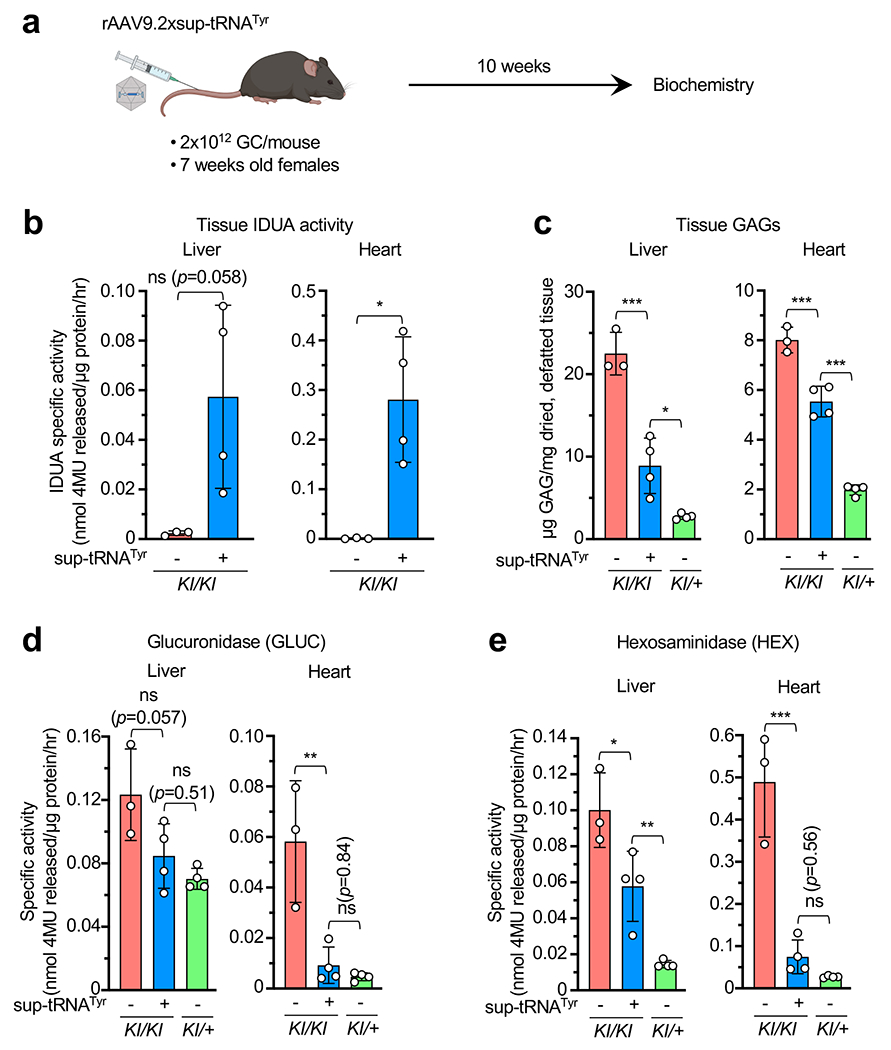
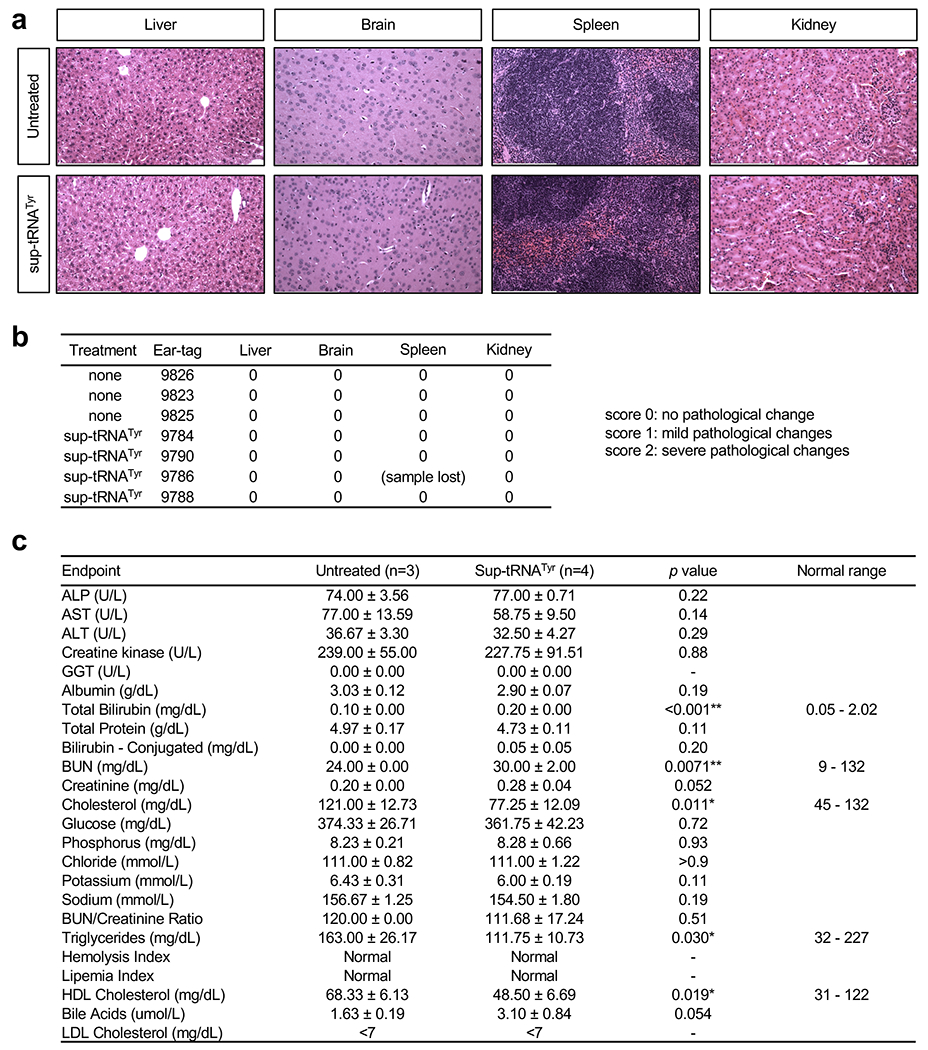
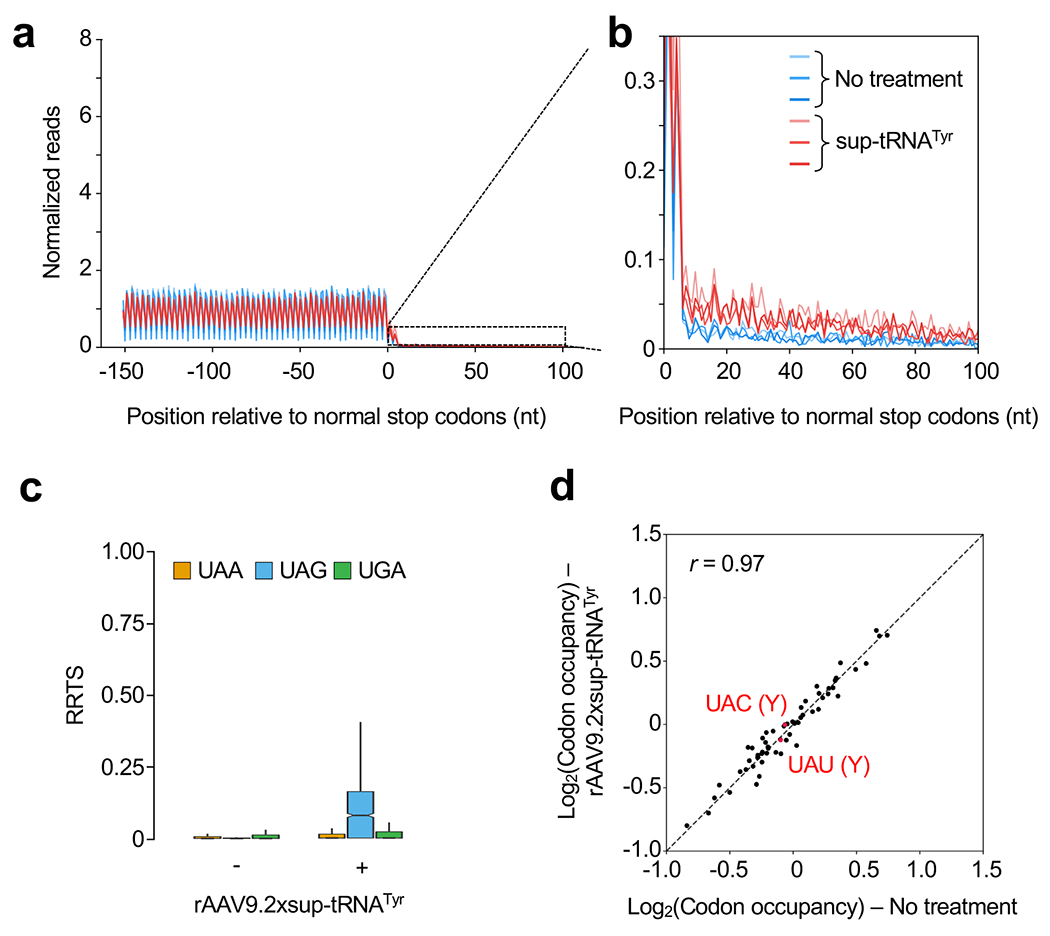
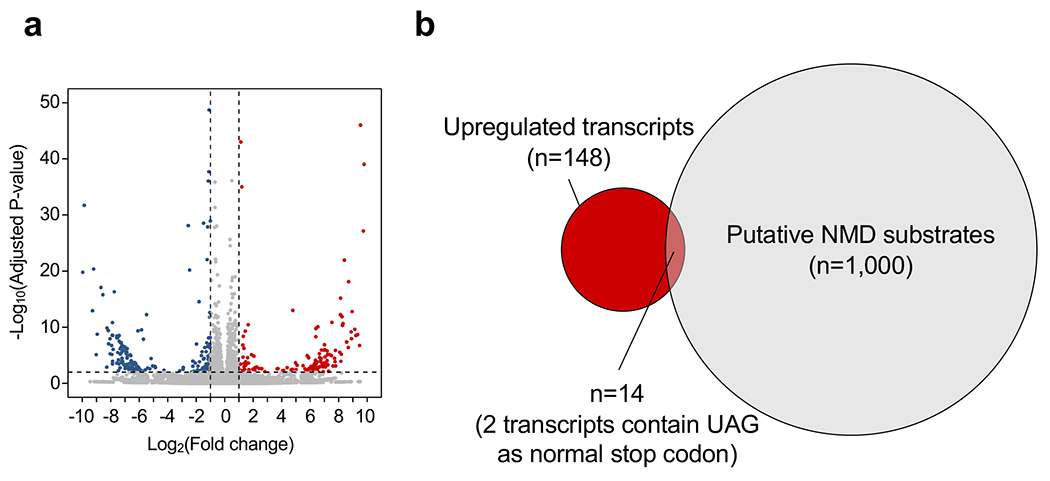
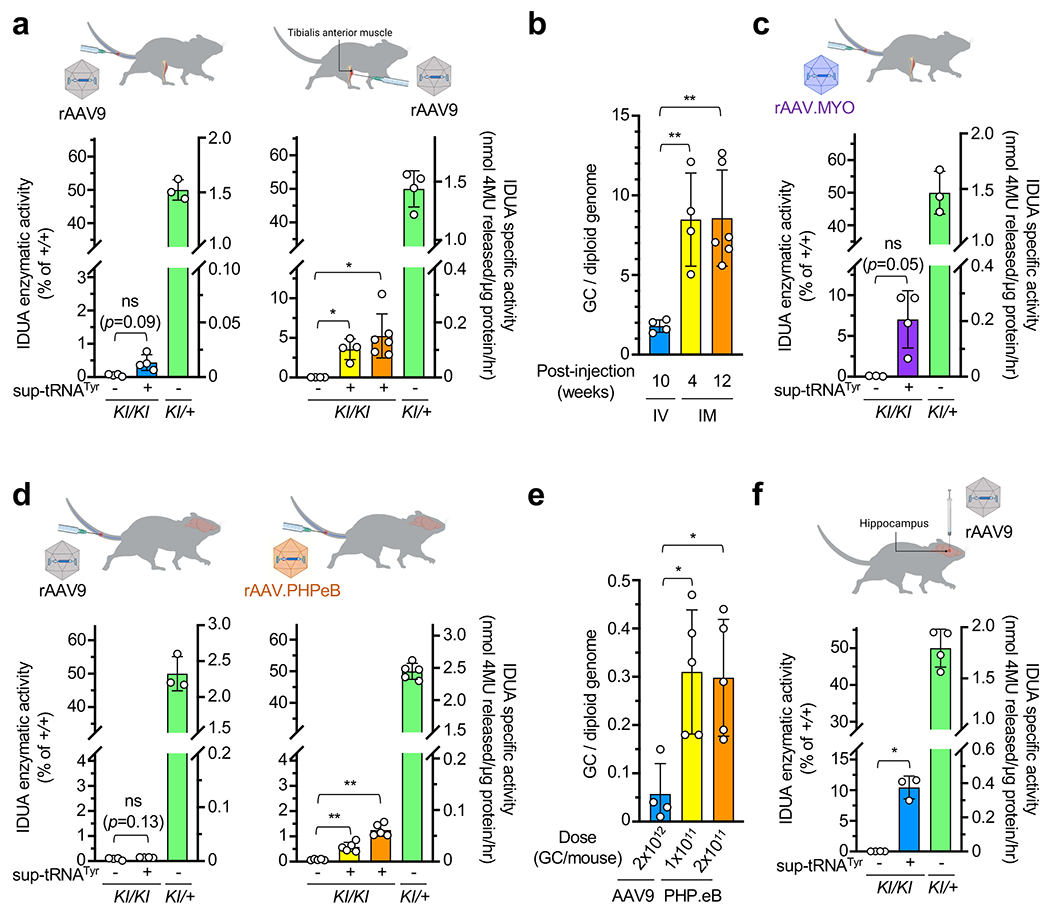
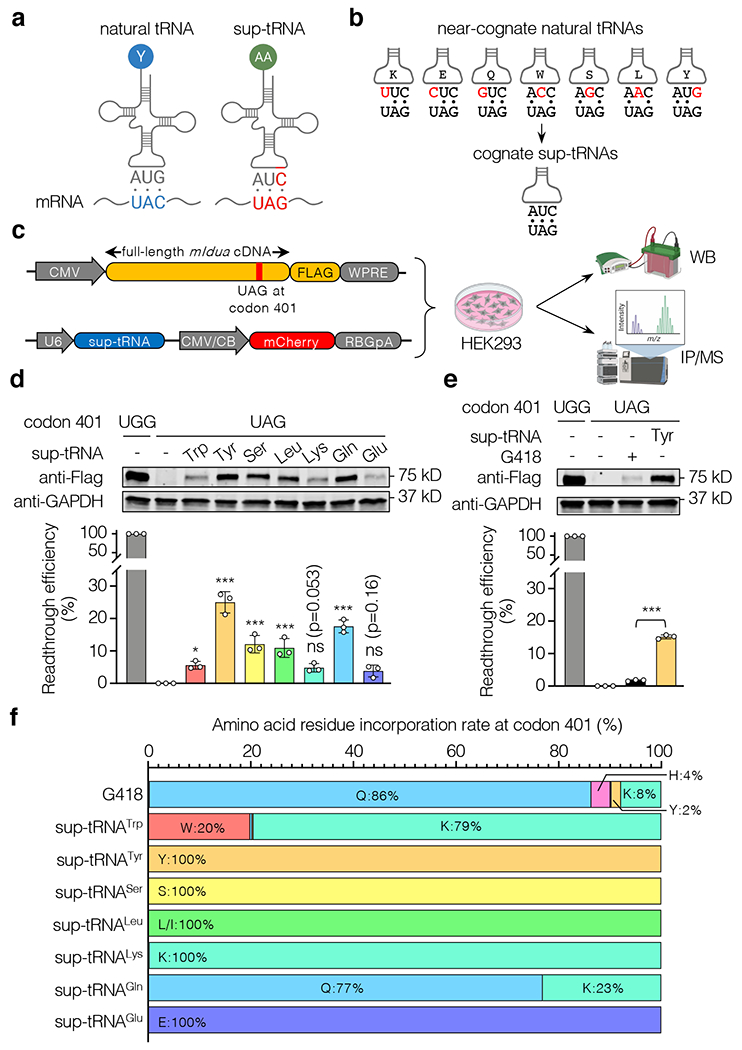
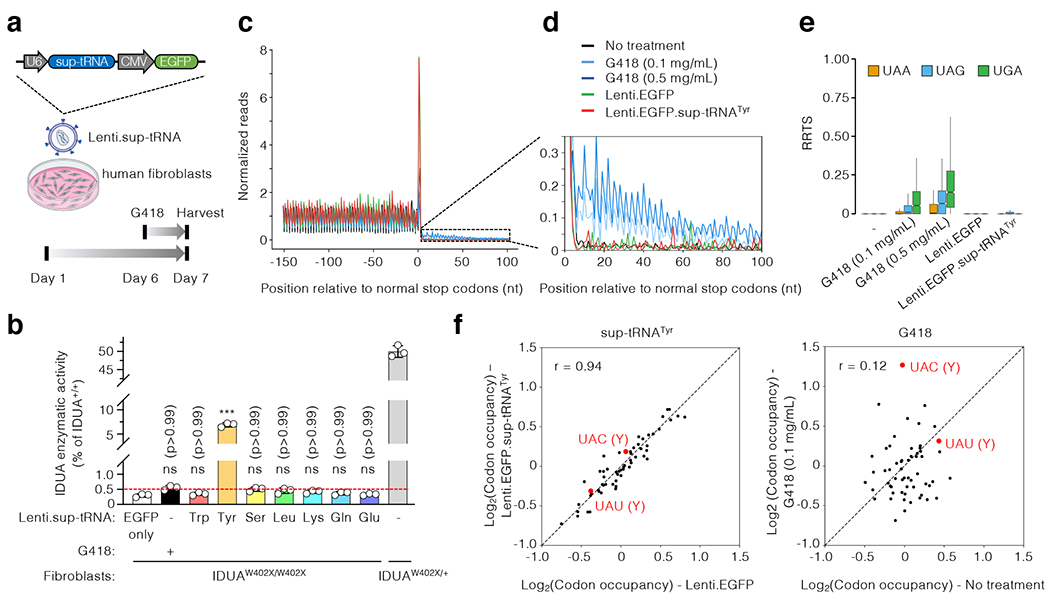
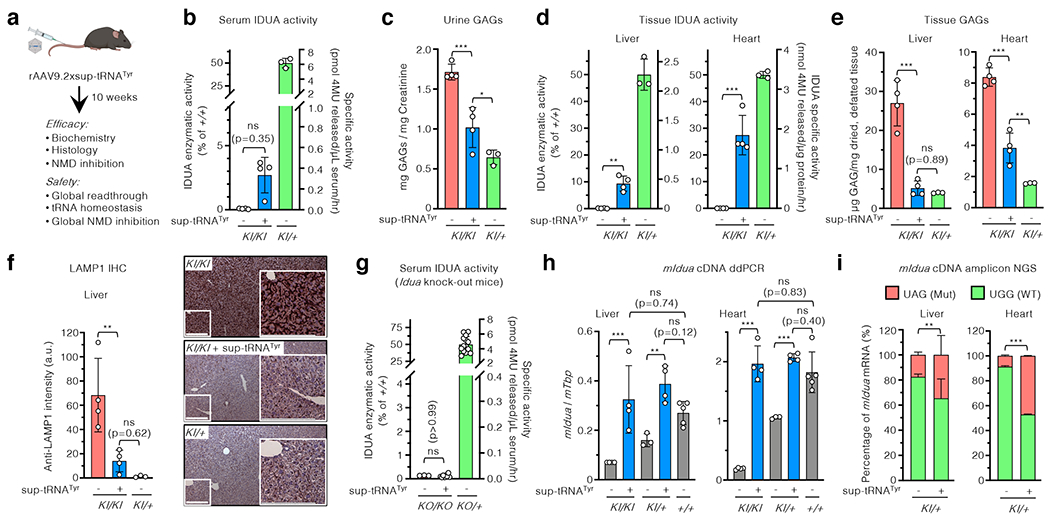
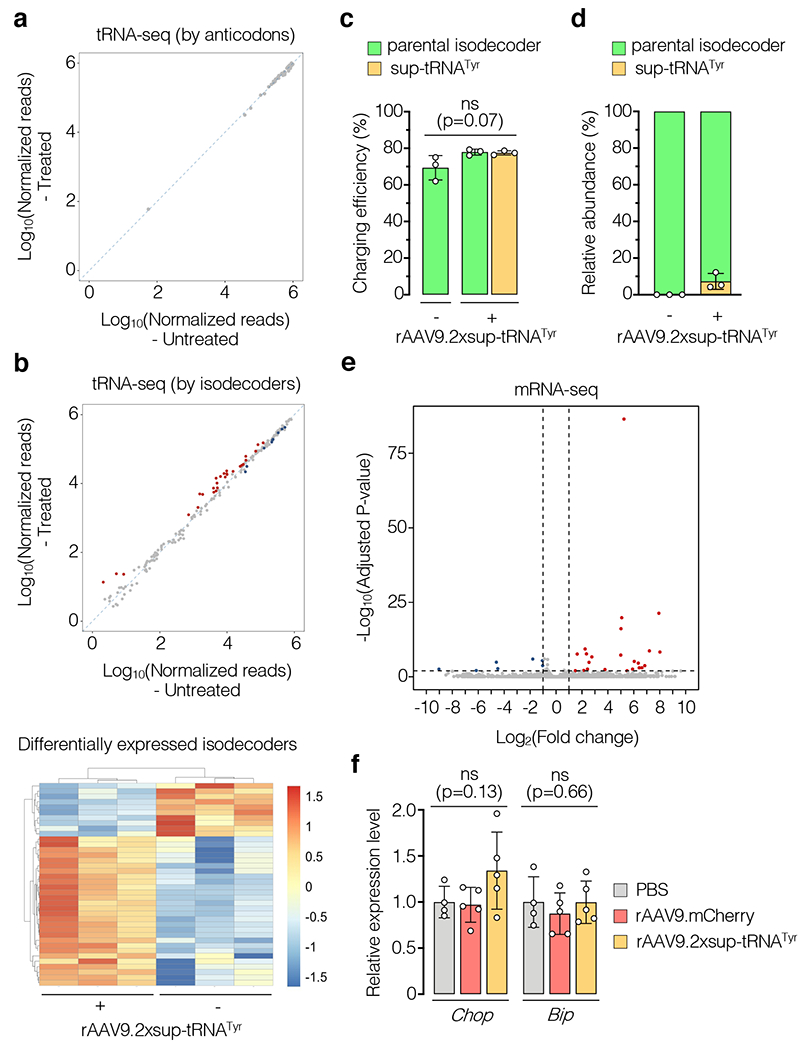
Gene therapy is a potentially curative medicine for many currently untreatable diseases, and recombinant adeno-associated virus (rAAV) is the most successful gene delivery vehicle for in vivo applications1-3. However, rAAV-based gene therapy suffers from several limitations, such as constrained DNA cargo size and toxicities caused by non-physiological expression of a transgene4-6. Here we show that rAAV delivery of a suppressor tRNA (rAAV.sup-tRNA) safely and efficiently rescued a genetic disease in a mouse model carrying a nonsense mutation, and effects lasted for more than 6 months after a single treatment. Mechanistically, this was achieved through a synergistic effect of premature stop codon readthrough and inhibition of nonsense-mediated mRNA decay. rAAV.sup-tRNA had a limited effect on global readthrough at normal stop codons and did not perturb endogenous tRNA homeostasis, as determined by ribosome profiling and tRNA sequencing, respectively. By optimizing the AAV capsid and the route of administration, therapeutic efficacy in various target tissues was achieved, including liver, heart, skeletal muscle and brain. This study demonstrates the feasibility of developing a toolbox of AAV-delivered nonsense suppressor tRNAs operating on premature termination codons (AAV-NoSTOP) to rescue pathogenic nonsense mutations and restore gene function under endogenous regulation. As nonsense mutations account for 11% of pathogenic mutations, AAV-NoSTOP can benefit a large number of patients. AAV-NoSTOP obviates the need to deliver a full-length protein-coding gene that may exceed the rAAV packaging limit, elicit adverse immune responses or cause transgene-related toxicities. It therefore represents a valuable addition to gene therapeutics.


Conflict of interest statement

COMPETING INTERESTS

J.W., Y.Z., C.A.M., G.G. and D.W. are inventors of a patent application filed by University of Massachusetts Chan Medical School concerning the design and applications of suppressor tRNAs described in this study. G.G. is a scientific co-founder of Voyager Therapeutics, Adrenas Therapeutics and Aspa Therapeutics and holds equity in the companies. G.G. and D.W. are inventors on patents related to AAV-based gene therapy, some of which were licensed to commercial entities. Other authors have no competing interest.

Figures

Extended Data Figure 1.
Extended Data Figure 1.. Sup-tRNAs suppressed UAG PTCs in HEK293 cells.
a, Workflow of a fluorescence reporter assay to examine sup-tRNA-induced readthrough of the Y39X premature termination codon (PTC) in the enhanced green fluorescence protein (EGFP) gene. Representative fluorescence images and quantification of fluorescent cells by flow cytometry are shown. Scale bar=250 μm. b, Dual-luciferase reporter assay to quantify G418 (0.1 mg/mL) or sup-tRNA-induced readthrough at the Idua-W401X PTC. Readthrough efficiency is calculated as the normalized ratio of Gaussia luciferase (Gluc) activity to Cypridina luciferase (Cluc) activity. Data are mean ± s.d. of three biological replicates. c, Dual-luciferase reporter assay using escalating amounts of sup-tRNATyr plasmid in co-transfection. d, Dual-luciferase reporter assay using a series of constructs harboring different nucleotides immediately downstream of the W401X PTC (+4 nucleotide), in the absence or presence of G418 (0.1 mg/mL) or sup-tRNATyr plasmid co-transfection. e, Representative Western blot images and quantification of protein expression from mouse Idua cDNA variants that encode different amino acid residues at codon 401. Data are mean ± s.d. of three biological replicates. Statistical analysis was performed by one-way ANOVA followed by two-sided Dunnett’s multiple comparisons test (b and e). **p < 0.01, ***p < 0.001, ns: not significant. Nucleotide sequences of EGFP-Y39X and dual-luciferase reporters are shown in Supplementary Table 4. For gel source data, see Supplementary Figure 1.
Extended Data Figure 2.
Extended Data Figure 2.. Comparable expression level and enzymatic activity among Idua variants.
a, Representative images and quantification of EGFP+ human fibroblasts by flow cytometry following Lenti.EGFP infection. Scale bar=250 μm. b, Workflow to examine mouse Idua cDNA variants expression and IDUA enzyme activity in IDUAW402X/W402X patient fibroblasts. The lentiviral construct expressing FLAG-tagged mouse IDUA variants is shown. c, Representative Western blot images and quantification of relative protein expression of mouse IDUA variants with different amino acid residues at codon 401. d, Absolute IDUA enzyme activity of different mouse IDUA variants. e, IDUA enzyme activity of different mouse IDUA variants normalized to expression level. Data are mean ± s.d. of three technical replicates (a), or of three biological replicates (c, d and e). Statistical analysis was performed by one-way ANOVA followed by two-sided Dunnett’s multiple comparisons (e). *p < 0.05, **p < 0.01, ***p < 0.001, ns: not significant. For gel source data, see Supplementary Figure 1.
Extended Data Figure 3.
Extended Data Figure 3.. Good correlation between replicates in Ribo-seq.
Density of coding sequence (CDS) is shown comparing two biological replicates of MPS-I patient fibroblasts treated under indicated conditions. Pearson correlations (two-sided) of log-transformed CDS densities and p values are shown. Histogram shows the CDS distribution sorted by binned densities.
Extended Data Figure 4.
Extended Data Figure 4.. Optimizing sup-tRNA expression cassette for in vivo rAAV delivery.
a, Schematic showing AAV9 vector constructs expressing 1x, 2x, or 4x sup-tRNATyr. Nucleotide sequences are shown in Supplementary Table 4. b, Workflow to study in vivo rAAV9 delivery of various sup-tRNATyr expression cassettes in the IduaW401X/W401X knock-in mice (KI/KI). c, IDUA enzymatic activity in liver (n=5, 4, 6, 4 as indicated by individual circles) and heart (n=5, 5, 5, 4 as indicated by individual circles) tissue lysates derived from mice treated by indicated AAV9 vectors. Data are mean ± s.d. Statistical analysis was performed by one-way ANOVA followed by two-sided Dunnett’s multiple comparisons test against the untreated group. d, Representative denaturing gel electrophoresis of extracted rAAV vector genomes of the 1x, 2x, 4x constructs of three technical replicates. Predicated vector genome sizes are labeled at the top. Black arrowheads: intact vector genomes; red arrows: truncated vector genomes. e, Characterization of serum IDUA activity (n=4 per group), urine GAGs (n=7 or 4 per group), liver IDUA activity (n=3 or 5 per group), and liver GAGs (n=3 or 5 per group) in KI/+ and wildtype (+/+) mice. Statistical analysis was performed by two-sided Student t-test. *p < 0.05, **p < 0.01, ns: not significant.
Extended Data Figure 5.
Extended Data Figure 5.. rAAV9.2xstRNATyr alleviated lysosomal abnormalities in MPS-I mice and yielded long-term (>6 months) therapeutic effect.
a-c, Western blot images and quantification of mouse LAMP1 protein expression (a), glucuronidase activity (b), and hexosaminidase activity (c) in the liver and heart of KI/KI mice with (+) or without (−) rAAV9.2xsup-tRNATyr treatment (n=4 per group), KI/+ without (−) rAAV9.2xsup-tRNATyr treatment (n=3). Data are mean ± s.d. of individual animals (circles). d, Serum IDUA enzyme activity in untreated KI/+ mice (green line, n=8), untreated KI/KI mice (red line, n=7) and KI/KI mice treated with rAAV9.2xsup-tRNATyr (blue line, n=7) at various timepoints after treatment at 6 weeks old. IDUA activity in untreated KI/+ mice was normalized to 50% of that in WT (+/+) mice at each timepoint, and IDUA activity in treated KI/KI mice as percentage of that in WT (+/+) mice is labeled. e, Urine GAG levels in KI/KI with (+) or without (−) rAAV9.2xsup-tRNATyr treatment (n=5 per group), KI/+ mice without (−) rAAV9.2xsup-tRNATyr treatment (n=6) determined at 28 weeks post treatment. Statistical analysis was performed by one-way ANOVA followed by two-sided Dunnett’s multiple comparisons test (a-c and e). **p < 0.01, ***p < 0.001, ns: not significant. For gel source data, see Supplementary Figure 1.
Extended Data Figure 6.
Extended Data Figure 6.. rAAV9.2xstRNATyr rescued MPS-I phenotype in female mice.
a, Workflow to assess in vivo rAAV9.2xsup-tRNATyr treatment efficacy in female IduaW401X/W401X knock-in mice (KI/KI). b, IDUA enzymatic activity in liver and heart tissue lysates derived from KI/KI mice with (+) or without (−) rAAV9.2xsup-tRNATyr treatment (n=4 and 3, respectively). Statistical analysis was performed by two-sided Welch’s t-test. c-e, Tissue GAG (c), glucuronidase activity (d), and hexosaminidase activity (e) levels in KI/KI with (+) or without (−) rAAV9.2xsup-tRNATyr treatment (n=4 or 3 per group), KI/+ mice without (−) rAAV9.2xsup-tRNATyr treatment (n=4). Data are mean ± s.d. of individual animals (circles). Statistical analysis was performed by one-way ANOVA followed by two-sided Dunnett’s multiple comparisons test (c-e). *p < 0.05, **p < 0.01, ***p < 0.001, ns: not significant.
Extended Data Figure 7.
Extended Data Figure 7.. No gross toxicity was observed in mice treated with rAAV9.2xsup-tRNATyr.
a, Representative H&E staining images of liver, brain, spleen, and kidney sections in untreated (n=3) or sup-tRNATyr-treated (n=4) male KI/+ mice. Mice were treated at 6 weeks old, and euthanized at 16 weeks old. Scale bar=200 μm. b, Blind pathological assessment of the liver, brain, spleen, and kidney H&E slides as described in (a). c, Summary of endpoint serum clinical biochemistry of untreated (n=3) or sup-tRNATyr-treated (n=4) KI/+ mice. Data are mean ± s.d. of biological replicates. Statistical analysis was performed by two-sided Student t-test. *p < 0.05, **p < 0.01. Note that for the endpoints showing statistical significance, values of both groups are within the normal ranges (https://phenome.jax.org/projects/CGDpheno2).
Extended Data Figure 8.
Extended Data Figure 8.. Ribosome profiling revealed that global readthrough is largely restricted to UAG in the liver.
a, Metagene plot showing normalized reads of ribosome protected fragments (RPFs) relative to the distance from the normal stop codon at position 0. RPFs from untreated (blue, n=3 mice), or rAAV9.2xsup-tRNATyr-treated KI/KI male mice (red, n=3 mice) are overlaid. b, Magnified view of the 3′UTR showing increased RPFs in this region in the rAAV9.2xsup-tRNATyr treated mouse livers. c, Box plot of ribosome readthrough score (RRTS) derived from ribosome profiling of KI/KI mouse livers with (+) or without (−) rAAV9.2xsup-tRNATyr treatment (n=3 per group). RRTS values were calculated for transcripts harboring different normal stop codons, namely UAA (orange), UAG (blue), and UGA (green), respectively. Center line indicates the median, the box ends indicate the first and third quartiles, and the whiskers indicate the range of the remaining data excluding outliers. d, Scatter plot showing RPF densities at each codon (codon occupancy) in KI/KI mouse livers with (+) or without (−) rAAV9.2xsup-tRNATyr treatment (n=3 per group). Two tyrosine (Y) codons are highlighted in red.
Extended Data Figure 9.
Extended Data Figure 9.. mRNA-seq analysis on human fibroblasts.
Cells were infected with Lenti.sup-tRNATyr.EGFP or Lenti.EGFP as control for seven days as described in Fig. 2a. a, Volcano plot showing differentially expressed transcripts in Lenti.sup-tRNATyr.EGFP-treated cells compared to control cells. Red and blue dots denote significantly upregulated and downregulated transcripts (adjusted p<0.01 and fold change>2), respectively. b, Venn diagram showing the upregulated transcripts in a and published set of 1,000 human putative NMD substrates.
Extended Data Figure 10.
Extended Data Figure 10.. rAAV.2xsup-tRNATyr treatment efficacy correlates with gene delivery efficiency.
a, IDUA activity in the tibialis anterior (TA) muscle lysates derived from KI/KI mice ± rAAV9.2xsup-tRNATyr treatment via either intravenous (IV) injection of 2x10¹² GC (left panel; n=4 per group) or from KI/KI mice ± rAAV9.2xsup-tRNATyr treatment via intramuscular (IM) injection of 3x10¹¹ GC to the TA muscle (right panel; n=4 or 6 per group). Tissues were harvested at 10 weeks (blue), 4 weeks (yellow), or 12 weeks (orange) post treatment. The right y-axis denotes absolute IDUA specific activity, and the left y-axis denotes relative activity normalized to untreated heterozygous mice as 50% of WT (+/+) level. b, Quantification of AAV vector genome copy numbers in the TA muscle of the mice described in a. c, IDUA enzymatic activity in the TA muscle lysates derived from KI/KI mice ± rAAVMYO.2xsup-tRNATyr treatment via IV injection at 2x10¹² GC (n=4 or 3 per group), and euthanized at 4 weeks post treatment. d, IDUA activity in the brain lysates derived from KI/KI mice ± rAAV.2xsup-tRNATyr treatment via intravenous (IV) injection. Mice were treated with either rAAV9 (left panel; n=4) at 2x10¹² GC or rAAV.PHPeB (right panel; n=5 per group) at 1x10¹¹ GC (yellow) or 2x10¹¹ GC (orange). e, Quantification of AAV vector genome copy numbers in the brain of the mice described in d. f, IDUA activity in the hippocampus lysates derived from KI/KI mice ± rAAV9.2xsup-tRNATyr treatment via intrahippocampal injection of 2.2x10¹⁰ GC (n=4 or 3 per group). Mice were euthanized at 4 weeks post treatment. Data are mean ± s.d. of individual animals (circles). Statistical analysis was performed by one-way Brown-Forsythe and Welch ANOVA followed by two-sided Dunnett T3’s multiple comparisons test (a, c, d, f), or ANOVA followed by two-sided Dunnett’s multiple comparison test (b, e). *p < 0.05, **p < 0.01, ***p < 0.001, ns: not significant.
Figure 1.
Figure 1.. Sup-tRNAs suppressed the mIdua-W401X mutation in HEK293 cells.
a, Schematic showing that a natural tRNA recognizes a sense codon (UAC in blue), whereas a suppressor tRNA (sup-tRNA) recognizes a stop codon (UAG in red) by the engineered anticodon. b, Near-cognate natural tRNAs have anticodons partially base-pairing with UAG (mismatches are in red), whereas sup-tRNAs have the engineered 3’-AUC-5’ anticodon that completely base-pairs with UAG. c, Workflow to examine sup-tRNA-induced readthrough efficiency by Western blot (WB) and amino acid residue incorporation by immunoprecipitation/mass spectrometry (IP/MS). Constructs expressing FLAG-tagged mouse IDUA and sup-tRNA, respectively, are shown. d, Representative Western blot images and quantification of mouse IDUA protein expression restored by sup-tRNA-induced readthrough. Data are mean ± s.d. of three biological replicates. e, Representative Western blot images and quantification of mouse IDUA protein expression restored via readthrough by G418 (0.1 mg/mL) or sup-tRNATyr. Data are mean ± s.d. of three biological replicates. f, Amino acid residue incorporation rate at the mIdua-W401X PTC by G418 or various sup-tRNAs as determined by mass spectrometry analysis of FLAG-tagged mouse IDUA. Statistical analysis was performed by one-way ANOVA followed by two-sided Dunnett’s multiple comparisons test (d and e). *p < 0.05, **p < 0.01, ***p < 0.001, ns: not significant. For gel source data, see Supplementary Figure 1.
Figure 2.
Figure 2.. Functional characterization of sup-tRNA in MPS-I patient fibroblasts.
a, Workflow to examine readthrough of the endogenous IDUA-W402X mutation in human fibroblasts by G418 or lentiviral vectors expressing sup-tRNA (Lenti.sup-tRNA). The Lenti.sup-tRNA construct is shown. b, IDUA activity assay in fibroblasts from an MPS-I patient carrying homozygous IDUA-W402X mutation (IDUAW402X/W402X) or carrier (IDUAW402X/+), treated with or without readthrough agent. The y-axis denotes relative activity normalized to untreated IDUAW402X/+ as 50% of normal level (IDUA+/+). Red dashed line indicates that 0.5% of normal IDUA activity was associated with attenuated disease (see text for details). Data are mean ± s.d. of three biological replicates. c, Metagene plot showing normalized reads of ribosome protected fragments (RPFs) relative to the distance from the normal stop codon at position 0. RPFs from untreated MPS-I patient fibroblasts (black), or cells treated for 24 hr with G418 (light blue: 0.1 mg/mL; dark blue: 0.5 mg/mL), Lenti.EGFP (green), or Lenti.EGFP.sup-tRNATyr (red) are overlaid. d, Magnified view of the 3′ untranslated region (UTR) showing increased RPFs in this region in G418-treated cells, but not in cells treated with sup-tRNATyr. e, Box plot of ribosome readthrough score (RRTS) derived from ribosome profiling of patient fibroblasts treated under indicated conditions. Representative results of two biological replicates are shown. RRTS values were calculated for transcripts harboring different normal stop codons, namely UAA (orange), UAG (blue), and UGA (green), respectively. Center line indicates the median, the box ends indicate the first and third quartiles, and the whiskers indicate the range of the remaining data excluding outliers. f, Scatter plots showing RPF densities at each codon (codon occupancy) in patient fibroblasts under indicated conditions. Two tyrosine (Y) codons are highlighted in red. Statistical analysis was performed by one-way ANOVA followed by two-sided Dunnett’s multiple comparisons test (b). ***p < 0.001, ns: not significant.
Figure 3.
Figure 3.. rAAV9.2xsup-tRNATyr treatment rescued MPS-I phenotype in mice.
a, Workflow to assess in vivo rAAV9 delivery of the 2xsup-tRNATyr expression cassette in male IduaW401X/W401X knock-in mice (KI/KI). b-f, Serum IDUA enzymatic activity (b), urine GAG levels (c), tissue IDUA enzymatic activity (d), tissue GAG levels (e), and representative LAMP1 immunohistochemistry images and quantification of liver sections (f) in KI/KI mice with (+) or without (−) rAAV9.2xsup-tRNATyr treatment at 10 weeks post treatment (n=4 per group). In b and d, the right y-axis denotes absolute IDUA specific activity, and the left y-axis denotes relative activity normalized to untreated heterozygous mice (KI/+) (n=3) as 50% of wildtype (+/+) level. In f, scale bar=200 μm. g, Serum IDUA activity in KO/KO mice with (+) or without (−) sup-tRNATyr treatment (n=3 and 8, respectively) and KO/+ without sup-tRNATyr treatment (n=14). h, Droplet digital PCR (ddPCR) quantification of mouse Idua cDNA in the liver and heart of KI/KI (n=4), KI/+ (n=4), or +/+ (n=5) mice, with (+) or without (−) rAAV9.2xsup-tRNATyr treatment. i, Next generation sequencing (NGS) quantification of targeted mouse Idua cDNA amplicons in the liver and heart of KI/+ mice, with (+) or without (−) rAAV9.2xsup-tRNATyr treatment (n=4 per group). The percentage of Idua cDNA harboring the W401X mutation [UAG(Mut), orange] or WT sequence [UGG(WT), green] is shown. Statistical analysis in (i) was performed by two-sided Fisher’s exact test. In b-h, statistical analysis was performed by one-way ANOVA followed by two-sided Dunnett’s multiple comparisons test; data are mean ± s.d. of individual animals (circles). *p < 0.05, **p < 0.01, ***p < 0.001, ns: not significant.
Figure 4.
Figure 4.. Transcriptome changes in the liver following sup-tRNATyr treatment.
a, Differential expression analysis of unique tRNA transcripts grouped by anticodons in rAAV9.2xsup-tRNATyr-treated mouse livers relative to untreated mouse livers (n=3 per group). b, Same as a, but grouped by unique isodecoders (top panel). Red and blue dots denote significantly upregulated and downregulated isodecoders (adjusted p<0.05), respectively. The bottom panel shows a heat map of differentially expressed isodecoders in treated and untreated mouse livers. c, Quantification of charging efficiency of the parental tRNATyr isodecoder and sup-tRNATyr in mouse livers with (+) or without (−) rAAV9.2xsup-tRNATyr treatment (n=3 per group). d, Quantification of the relative expression levels of sup-tRNATyr and the parental tRNATyr isodecoder in mouse livers as described in c (n=3 per group). e, Volcano plot showing differentially expressed transcripts revealed by RNA-seq in rAAV9.2xsup-tRNATyr-treated mouse livers compared to rAAV9.mCherry-treated ones (n=5 per group). Red and blue dots denote significantly upregulated and downregulated genes (adjusted p<0.01 and fold change>2), respectively. f, Reverse-transcription and ddPCR of Chop and Bip mRNA in livers of PBS (n=4), rAAV9.mCherry (n=5), and rAAV9.2xsup-tRNATyr (n=5) treated mice. Data are mean ± s.d. of individual animals (circles) in c, d and f. Statistical analysis was performed by one-way ANOVA. ns: not significant.

Comment in

  • tRNA molecules run a STOP sign.
    Kingwell K. Kingwell K. Nat Rev Drug Discov. 2022 May;21(5):337. doi: 10.1038/d41573-022-00066-6. Nat Rev Drug Discov. 2022. PMID: 35396352 No abstract available.

Similar articles

Cited by

References

    1. Wang D, Tai PWL & Gao G Adeno-associated virus vector as a platform for gene therapy delivery. Nat Rev Drug Discov. (2019). - PMC - PubMed
    1. Li C & Samulski RJ Engineering adeno-associated virus vectors for gene therapy. Nat Rev Genet. 21, 255–272 (2020). - PubMed
    1. Mendell JR et al. Current Clinical Applications of In Vivo Gene Therapy with AAVs. Mol Ther. (2020). - PMC - PubMed
    1. Hordeaux J et al. Adeno-Associated Virus-Induced Dorsal Root Ganglion Pathology. Hum Gene Ther. 31, 808–818 (2020). - PubMed
    1. Van Alstyne M et al. Gain of toxic function by long-term AAV9-mediated SMN overexpression in the sensorimotor circuit. Nat Neurosci. (2021). - PMC - PubMed