. 2022 Jun;606(7915):791-796.
doi: 10.1038/s41586-022-04522-6. Epub 2022 Mar 23.

Androgen receptor activity in T cells limits checkpoint blockade efficacy

Affiliations

Androgen receptor activity in T cells limits checkpoint blockade efficacy

Xiangnan Guan et al. Nature. 2022 Jun.

Abstract

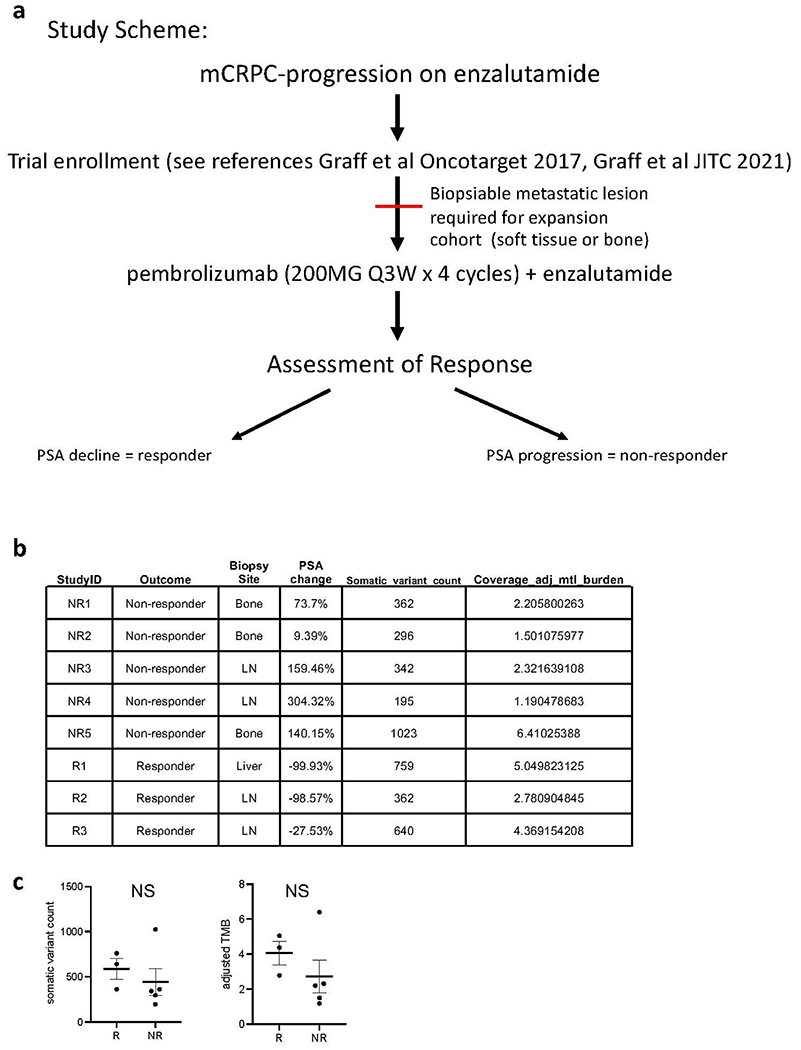
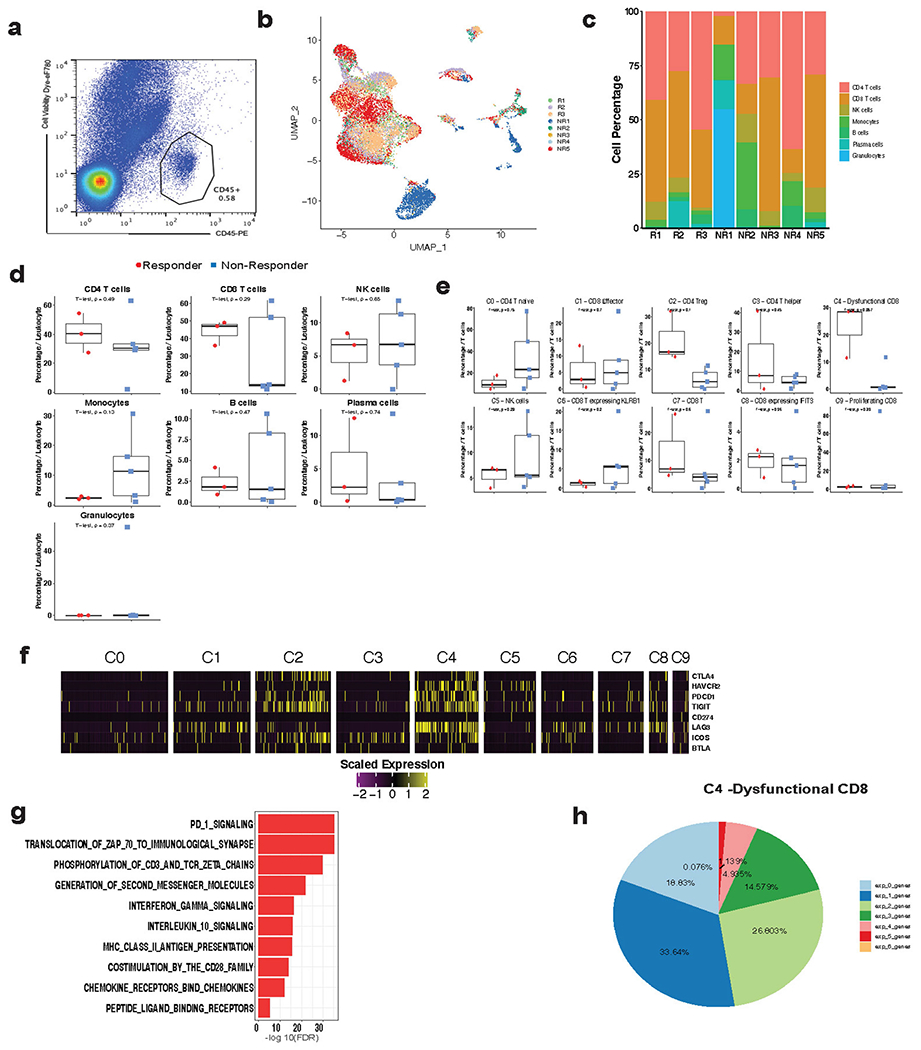
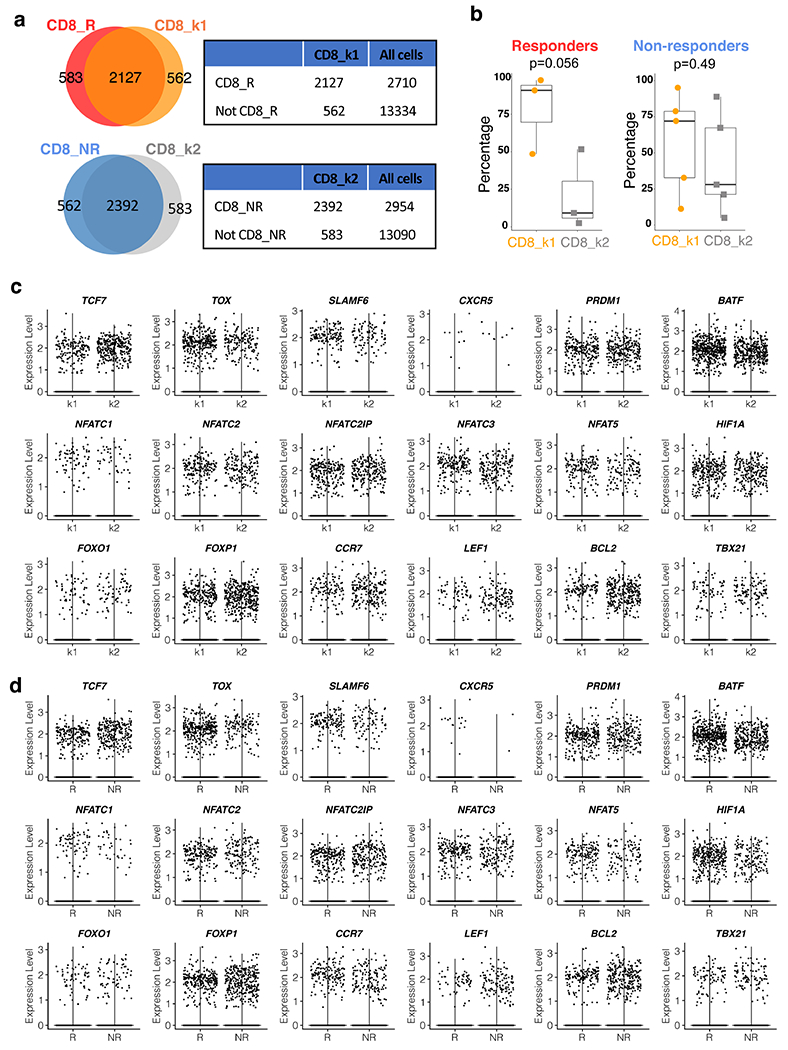
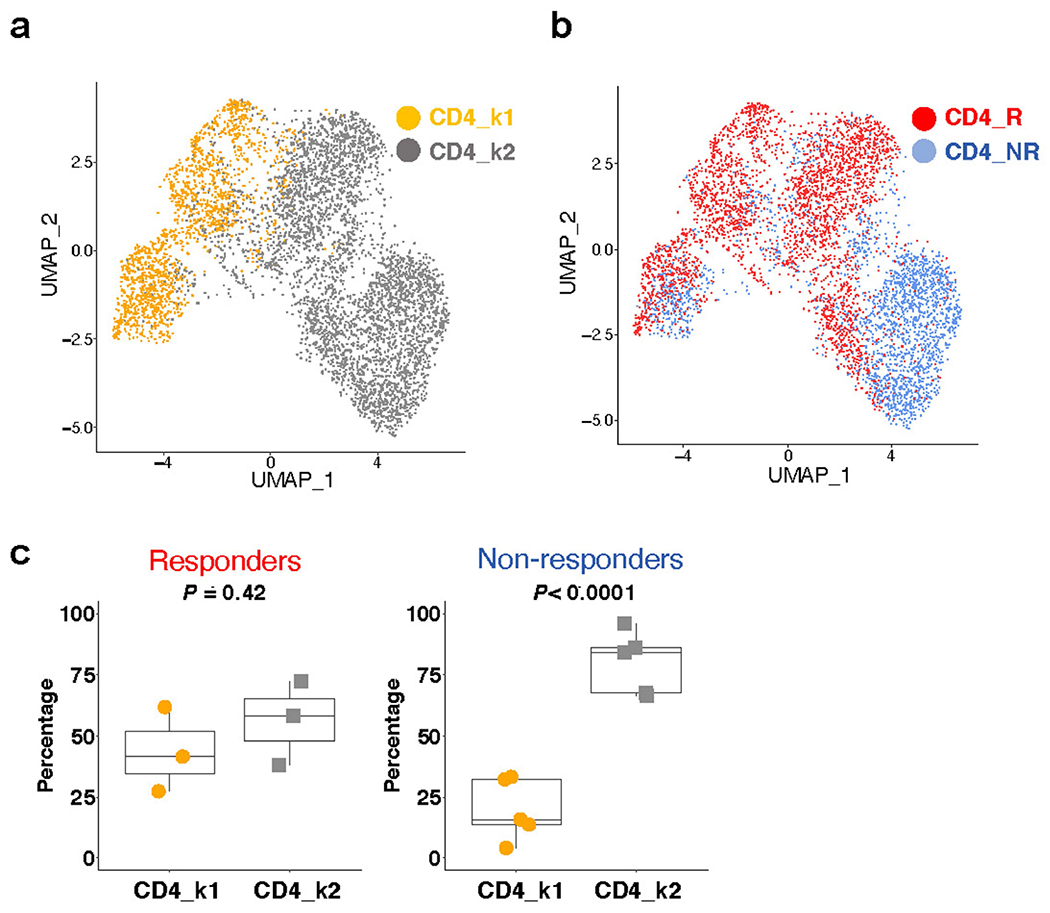
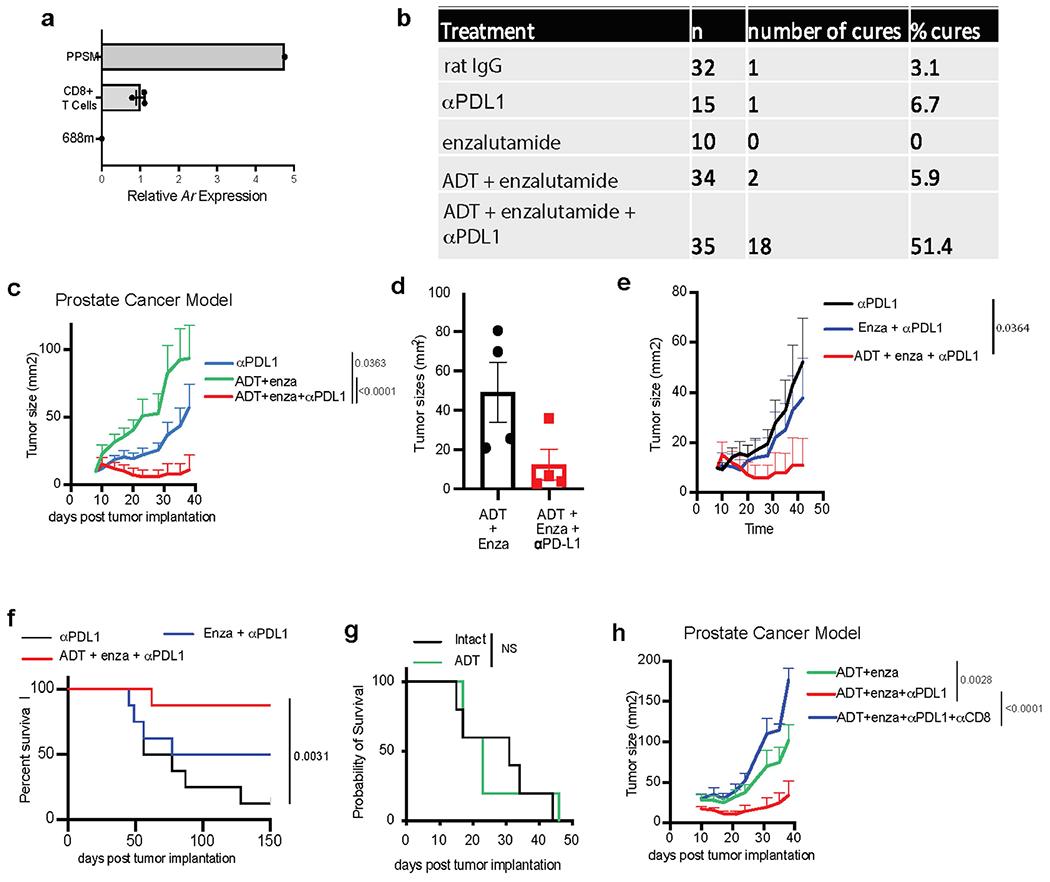
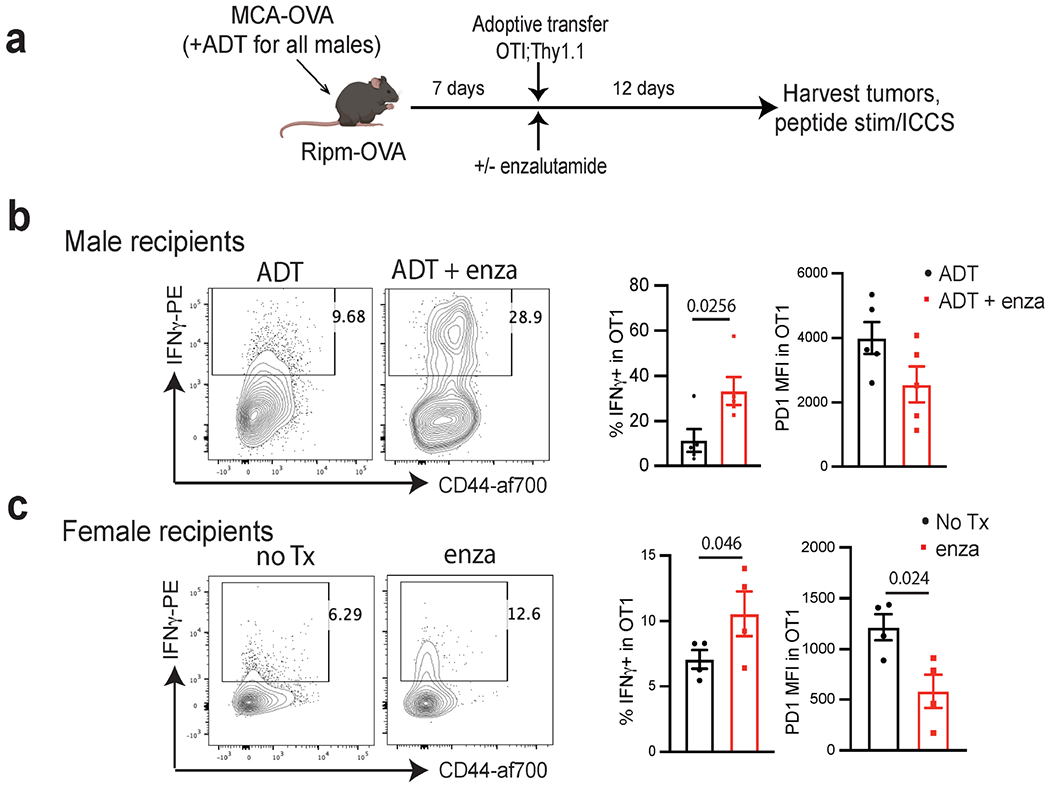
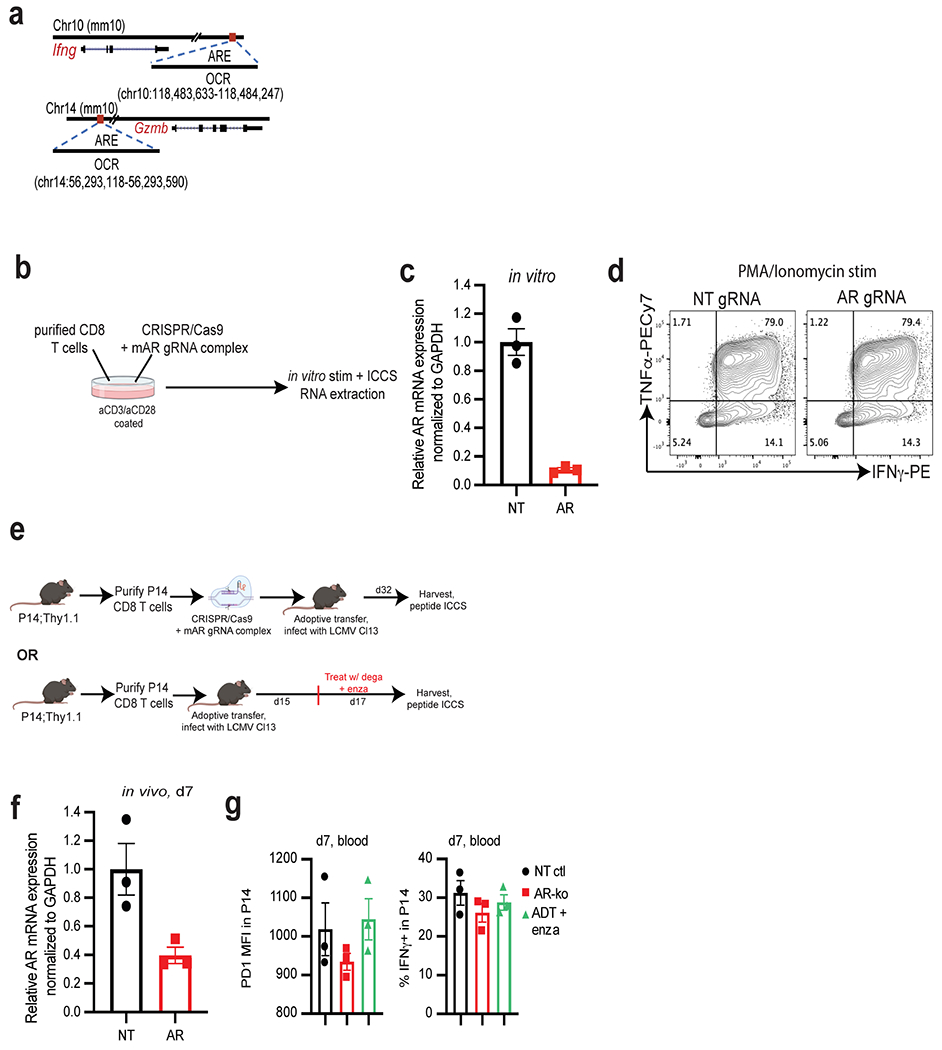
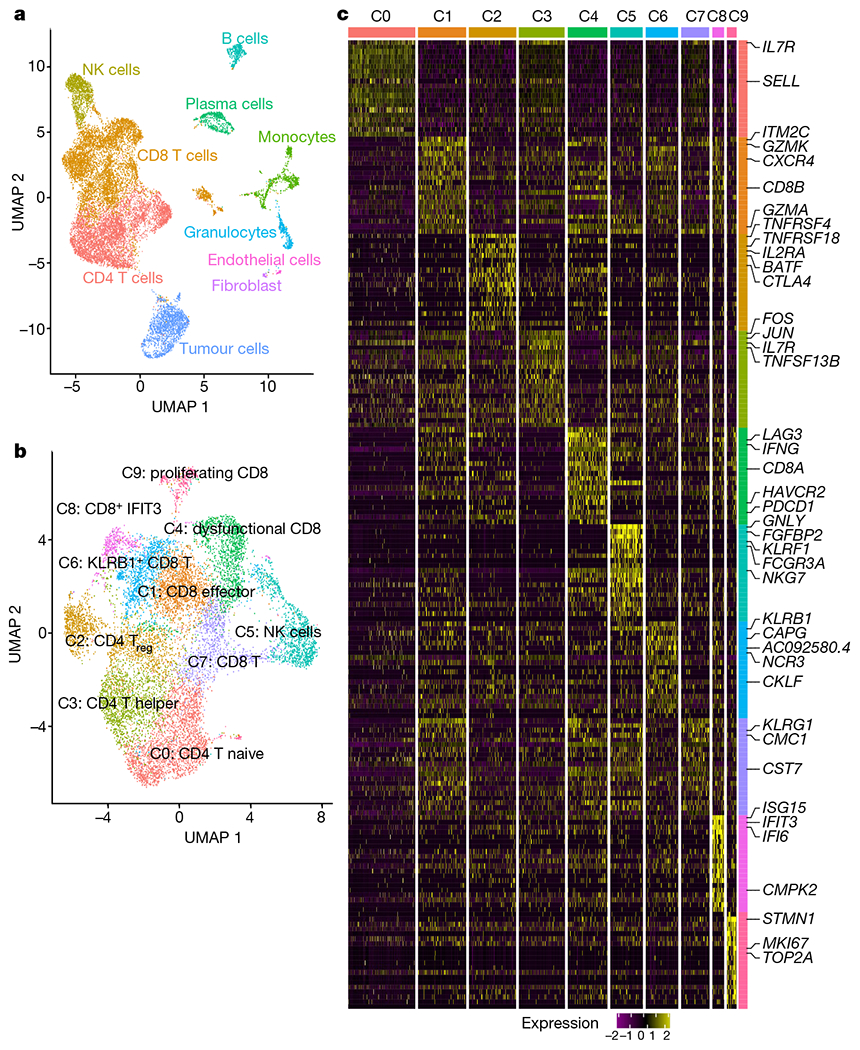
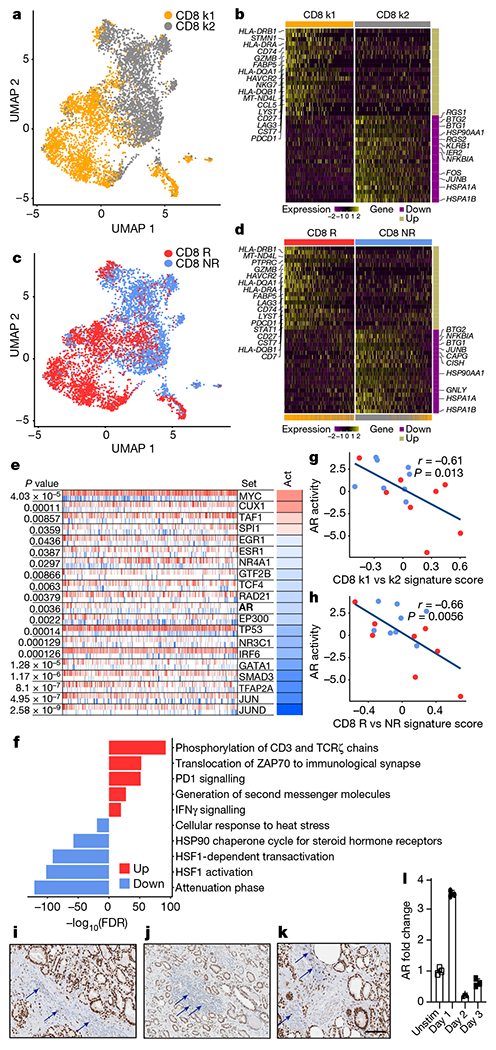
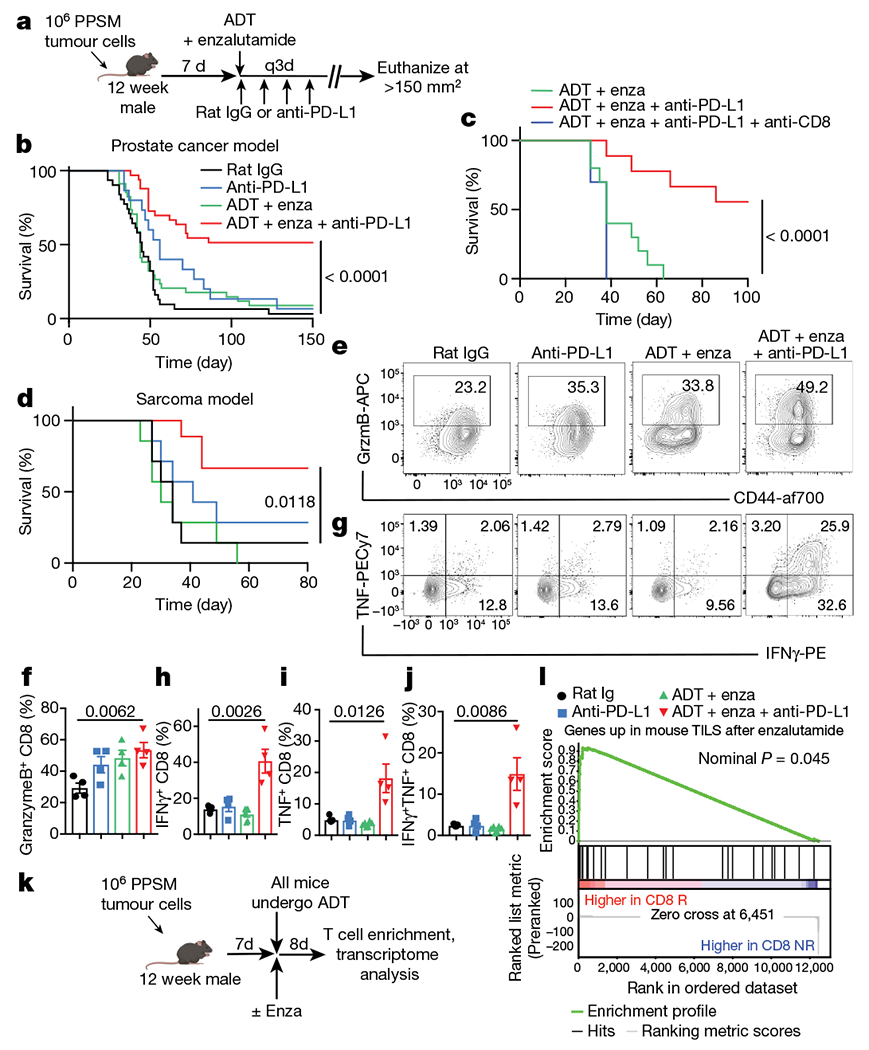
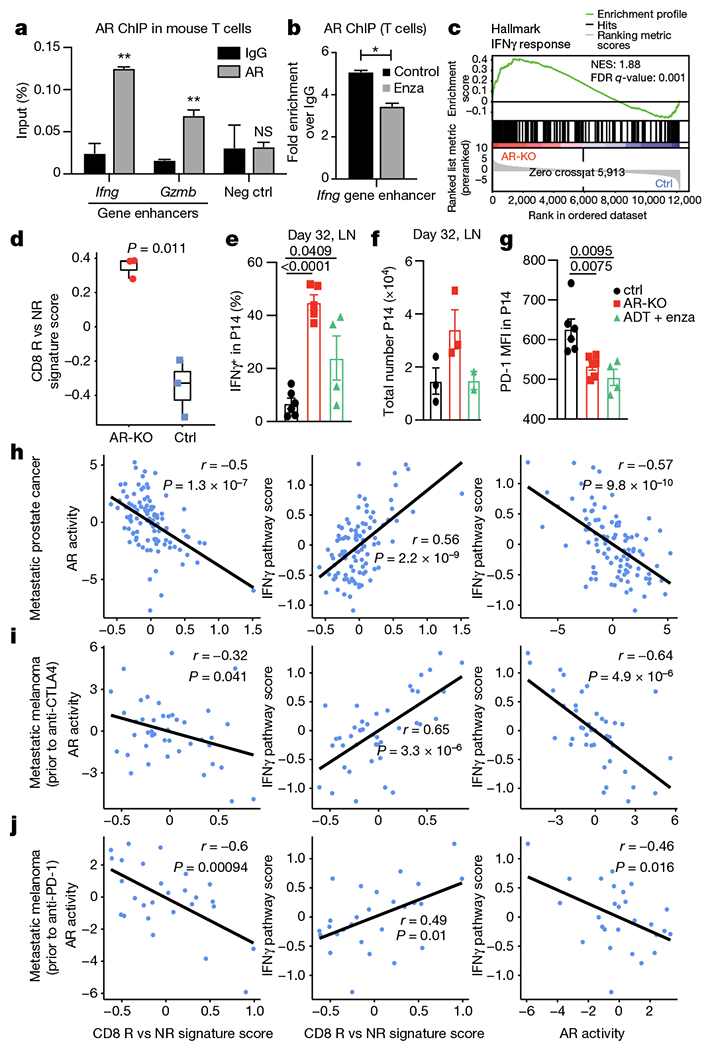
Immune checkpoint blockade has revolutionized the field of oncology, inducing durable anti-tumour immunity in solid tumours. In patients with advanced prostate cancer, immunotherapy treatments have largely failed1-5. Androgen deprivation therapy is classically administered in these patients to inhibit tumour cell growth, and we postulated that this therapy also affects tumour-associated T cells. Here we demonstrate that androgen receptor (AR) blockade sensitizes tumour-bearing hosts to effective checkpoint blockade by directly enhancing CD8 T cell function. Inhibition of AR activity in CD8 T cells prevented T cell exhaustion and improved responsiveness to PD-1 targeted therapy via increased IFNγ expression. AR bound directly to Ifng and eviction of AR with a small molecule significantly increased cytokine production in CD8 T cells. Together, our findings establish that T cell intrinsic AR activity represses IFNγ expression and represents a novel mechanism of immunotherapy resistance.


Conflict of interest statement

R.F.T. and J.N.G. are employees of the US Government. The contents do not represent the views of the US Department of Veterans Affairs or the United States Government. S.A.H. is an employee of AstraZeneca. A.E.M. received research funding from AstraZeneca.

Figures

Extended Data Fig. 1 |
Extended Data Fig. 1 |. Clinical trial scheme of patients enrolled and details on biopsy location and genomics.
a. Clinical trial study scheme. b. Per-patient tumor mutations are shown in a table with each row representing an individual participant on study, and each column representing the unique participant identifier (StudyID), the participant’s response to study treatment (Outcome), the site of biopsied tissue specimen analyzed (Biopsy Site), the relative (%) change in PSA with treatment (PSA change), the number of somatic variants detected in that tumor specimen (Somatic_variant_count), and the coverage-adjusted tumor mutational burden defined as the Somatic_variant_count / #Mbp genome covered by ≥ 6 reads (Coverage_adj_mtl_burden). c. Comparison of the somatic variant counts (left) or coverage-adjusted tumor mutational burdens (right) for study responders (R, n = 3 patients) versus non-responders (NR, n = 5 patients); NS represents no significant difference detected by two-tailed Student’s t-test; mean values are depicted as bold horizontal lines. Error bars represent S.E.M.
Extended Data Fig. 2 |
Extended Data Fig. 2 |. CD8 T cell subset associated with response to checkpoint therapy in mCRPC patients.
a, Representative flow cytogram for sorting tumor-associated leukocytes prior to scRNAseq. b, UMAP of all single cells (n = 16,044 cells) in this study colored by patient. c, Stack bar graph showing the % of cells per sample for immune cell clusters across each patient biopsy. d, e, Box plots comparing the % of cells per sample for immune cell clusters between responders (n = 3 patients) and non-responders (n = 5 patients). Percentage was calculated out of all immune cells (d) or all T/NK cells (e). Two-tailed unpaired Student’s t-test. Box center line, median; box, the interquartile range (IQR, the range between the 25th and 75th percentile); whiskers, 1.58 times IQR. f, Heatmap showing the expression of CTLA4, HAVCR2, PDCD1, TIGIT, CD274, LAG3, ICOS, BTLA in various T cell clusters. g, Pathways enriched in dysfunctional CD8 T cells (C4 cluster). h, Percentage of cells co-expressing a combination of PDCD1, LAG3, HAVCR2, CTLA4, TNFRSF4, and TIGIT in dysfunctional CD8 T cells (C4 cluster).
Extended Data Fig. 3 |
Extended Data Fig. 3 |. Expression of various genes associated with CD8 T cytotoxicity and exhaustion.
a, Venn diagram and contingency table showing the significant overlap between CD8_R and CD8_k1 (Top, P < 0.0001) and between CD8_NR and CD8_k2 (Bottom, P < 0.0001). All cells: all the single cells that passed quality control in this study, as shown in Fig. 1a. Two-tailed Fisher’s exact test. b, Percentage of CD8_k1 or CD8_k2 clusters per sample in responders (n = 3 patients) and non-responders (n = 5 patients). Two-tailed unpaired Student’s t-test. Box center line, median; box, the interquartile range (IQR, the range between the 25th and 75th percentile); whiskers, 1.58 times IQR. c, d, Violin plot comparing the gene expression in CD8_k1 and CD8_k2 (c), and CD8_R and CD8_NR (d). R, responder; NR, non-responder.
Extended Data Fig. 4 |
Extended Data Fig. 4 |. CD4_k1 is not associated with response.
a, UMAP plot showing the two distinct CD4 T cells states identified using k-means clustering (n = 5,322 cells). b, UMAP plot showing CD4 T cells colored by response and non-response patient groups (n = 5,322 cells). c, Percentage of CD4_k1 or CD4_k2 clusters per sample in responders (n = 3 patients) and non-responders (n = 5 patients). Two-tailed unpaired Student’s t-test. Box center line, median; box, the interquartile range (IQR, the range between the 25th and 75th percentile); whiskers, 1.58 times IQR. R, responder; NR, non-responder.
Extended Data Fig. 5 |
Extended Data Fig. 5 |. Survival data following orthotopic PPSM implantation and enzalutamide + anti-PD-L1 treatment.
a, Ar expression by qPCR in mouse CD8 T cells, as compared with PPSM and 688m AR positive and negative control cell lines, respectively. Data combined from 3 independent experiments. b, Summary table of the experiments described in Fig. 3a. c, Average tumor growth of PPSM tumor bearing animals treated with different treatment combination as described in Fig. 3a. Data combined from 4 independent experiments, 8 to 10 animals per group. d, 12–14 wk old male mice were orchiectomized and PPSM tumor cells were injected orthotopically in the anterior lobe of the prostate. One week later, animals were treated with enzalutamide or enzalutamide + anti-PD-L1 (5 animals per group). 4 weeks post tumor inoculation, tumors were collected and measured. e–f, PPSM tumor bearing animals were treated along the same timeline as Fig. 3a but in the absence of ADT. Average tumor growth (e) and survival curves (f) of tumor bearing animals treated with combination therapy in the presence or absence of ADT (data depict one representative experiment of two experiments, 8 animals per group). g, Survival curves of PPSM tumor bearing animals orchiectomized or not at day 7 (5 animals per group). h, Average tumor growth of PPSM tumor bearing animals treated with combination therapy and α-CD8 depleting antibody (data depict one representative experiment of two experiments, 10 animals per group). Error bars represent S.E.M. Two-way ANOVA was used for c, e and h, and log-rank (Mantel-Cox) was used for f and g.
Extended Data Fig. 6 |
Extended Data Fig. 6 |. Phenotyping data of tumor infiltrating CD8 T cells from orthotopic PPSM tumors, degarelix treated, and enzalutamide + anti-PD-L1 treated.
ad, PPSM tumor bearing animals were treated as in Fig 3a. CD8 T cell number (a), Ki67 expression (b), PD-1 MFI (c) and CD44 MFI (d) in CD8 T cells in the tumor the day after the 3rd treatment with α-PD-L1. Data representative of 3 independent experiments with 3 animals per group. eg, PPSM tumor cells were surgically injected orthotopically in the prostate, and orchiectomy was performed. One week later, animals were treated with enzalutamide only or enzalutamide + α-PD-L1 (5 animals per group). 4 weeks post tumor inoculation, tumors were harvested and processed for flow cytometry. Graphs show percent IFNγ+ (e), TNFα+ (f) and IFNγ+TNFα+ double producing (g) CD8 T cells in the tumor (n = 5 animals). hl, PPSM tumor bearing animals underwent ADT (degarelix, 1 dose, d14 post tumor inoculation), enzalutamide (started at d14) and α-PD-L1 (3 doses, d14, 17, 20). Tumors were harvested on day 21 and processed for flow cytometry. Graphs show percent Ki67+ (h), IFNγ+ (i), TNFα+ (j), IFNγ+TNFα+ (k) and granzyme B+ (l) CD8 T cells in the tumor. Data representative of 2 independent experiments with 3 animals per group. m–o, PPSM tumor bearing animals were treated with the same timeline as in Fig. 3a, but with enzalutamide + α-PD-L1 or ADT + α-PD-L1. Tumors were harvested the day after the 3rd dose of α-PD-L1 and processed for flow cytometry. m, Percent granzyme B+ CD8 T cells in the tumor. n, Representative flow cytogram showing IFNγ and TNFα expression in CD8 T cells in the tumor, and o, Summarized percent IFNγ+TNFα+ CD8 T cells in the tumor. Data representative of 2 independent experiments with 3 animals per group. Error bars represent S.E.M. Two-tailed unpaired Student t-test.
Extended Data Fig. 7 |
Extended Data Fig. 7 |. Enzalutamide treatment leads to increased cytokine production in tumour specific T cells.
a, Experimental design. Male or female Ripm-OVA animals were implanted with MCA-OVA tumours. Male animals were treated with ADT (degarelix) at time of tumour inoculation. At d7 animals were adoptively transferred with OT1;Thy1.1 CD8 T cells, and half of the animals were started on enzalutamide treatment (5 animals per group). 12 days post adoptive transfer, tumors were harvested, and TILs were stimulated with SIINFEKL peptide followed by ICCS. b, c, Representative flow cytograms showing CD44 and IFNγ expression in OTI T cells in the tumor, and summarized % IFNγ+ and PD-1 MFI in OTI in the tumor in males (b) and females (c). Data representative of 2 independent experiments with 5 animals per group ICCS; intra-cellular cytokine staining. Error bars represent S.E.M. Two-tailed unpaired Student t-test.
Extended Data Fig. 8 |
Extended Data Fig. 8 |. T cell deletion of Ar.
a, Open chromatin regions (OCRs) containing predicted androgen receptor elements (AREs) in Ifng and Gzmb loci. b, Experimental design of the generation of Ar-KO CD8 T cells in vitro using CRISPR/Cas9. Purified CD8 T cells were electroporated with Cas9/gRNA complex (NT or AR gRNA), and put in culture in vitro for 3 days in plates coated with α-CD3 and α-CD28. 3 days later, stimulated cells were harvested, and RNA was extracted or cells were restimulated in vitro for 5 h with PMA/Ionomycin, followed by ICCS (made with www.BioRender.com). c, Ar mRNA levels by qPCR in CD8 T cells electroporated with non-targeting (NT) or Ar gRNA/Cas9 after 3 days of in vitro stimulation. Data representative of 4 independent experiments with 3 replicate wells. d, Representative flow cytograms of IFNγ and TNFα expression after restimulation with PMA/Ionomycin. e, Schematic of LCMV experiment (made with www.BioRender.com), 3 animals per group. f, Ar mRNA levels in purified P14 at day 7 post adoptive transfer (from experiment described in Fig. 4e–g). Data representative of 2 independent experiments with 3 replicate wells. g, PD1 MFI and percent IFNγ+ in P14 in the blood at day 7 post adoptive transfer. Error bars represent S.D. for c and f, and S.E.M for g.
Fig. 1 |
Fig. 1 |. The immune landscape of tumours from patients with mCRPC prior to checkpoint therapy.
a, Uniform manifold approximation and projection (UMAP) of all cells that passed quality control (n = 16,044 cells). Cells are coloured on the basis of cell type. b, UMAP of all T and NK cells collected in this study with cells coloured by cell type (n = 12,073 cells). c, Heat map showing scaled expression of the top 20 cell markers ranked by fold change in each cluster in b. Colours represent cell types as in b. A list of representative genes is shown on the right.
Fig. 2 |
Fig. 2 |. CD8 T cell signature associated with response implicates a functional role for AR.
a, Unsupervised k-means clustering (n = 5,664 cells) of CD8 T cells. b, Scaled expression of top 20 differentially expressed genes ranked by fold change between CD8 k1 and CD8 k2 cells. c, UMAP plot showing CD8 T cells coloured by clinical response (CD8 R and CD8 NR) (n = 5,664 cells). d, Scaled expression of the top 20 differentially expressed genes ranked by fold change between CD8 R and CD8 NR T cells. e, Master regulator analysis to identify transcription factors whose activity is different between CD8 R and CD8 NR T cells. The top 20 transcription factors predicted to be most activated (red) or deactivated (blue) in CD8 R versus CD8 NR T cells. Tick marks depict targets of transcription factors that are positively (red) or negatively (blue) regulated. Act, inferred differential activity for each transcription factor. f, Pathway analysis of the top 10 molecular signatures distinguishing CD8 R versus CD8 NR T cells. g, h, Correlation between CD8 k1 versus CD8 k2 signature score (g) or CD8 R versus CD8 NR signature score (h) with AR activity in individual patients on our trial (n = 16 patients, from whom bulk RNA-seq but no single-cell RNA-seq data were available). Each dot represents data from 1 patient. Red, responder; blue, non-responder. Two-tailed Pearson correlation. ik, Immunohistochemistry of AR in tumours from patients with treatmentnaive prostate cancer, Gleason grades 4 + 3 (i), 3 + 3 (j) and 3 + 4 (k). Arrows indicate positive AR expression in immune cells. l, Kinetics of AR expression in purified human CD8 T cells after TCR stimulation. Individual data points represent technical replicates from one experiment. Data depict one representative experiment of two experiments; two donors of peripheral blood mononuclear cells (PBMC). Data are mean ± s.d. k1, k-means cluster 1; k2, k-means cluster 2.
Fig. 3 |
Fig. 3 |. Dual inhibition of AR and PD-1/PD-L1 improves T cell function and overall survival in mouse tumour models.
a, Experimental design for mouse tumour model (created with BioRender.com). q3d, dose given every three days. b, Survival curves of PPSM tumour-bearing mice treated as indicated. Data combined from 4 independent experiments, 8 to 10 mice per group per experiment. Enza, enzalutamide. c, Survival curves of PPSM tumour-bearing mice treated with combination therapy and anti-CD8 depleting antibody (10 mice per group). Data depict one representative experiment of two experiments. d, Survival curves of MCA-205 tumour-bearing mice treated as in a. Data depict one representative experiment of two experiments, 8 mice per group. ej, PPSM tumour-bearing mice were treated as in a and tumours were collected the day after the third anti-PD-L1 antibody treatment. e, CD44 and granzyme B expression in CD8 TILs. f, Percentage of granzyme B+ CD8 T cells. g, IFNγ and TNF expression in CD8 TILs. hj, Percentage of IFNγ+ (h), TNF+ (i) and IFNγ+TNF+ ( j) CD8 TILs. Data representative of three independent experiments; three mice per group. k, Experimental design (created with Biorender.com). l, GSEA illustrating the association of AR-inhibited genes in mouse TILs with CD8 R single-cell signature (nominal P = 0.045, nonparametric permutation test). Data are mean ± s.e.m.; log-rank (Mantel–Cox) test was used for bd. Two-tailed unpaired Student t-test was used for f and hj.
Fig. 4 |
Fig. 4 |. Suppressing AR function in T cells promotes IFNG activity.
a, b, AR ChIP–qPCR data shows specific binding of AR to the predicted AREs of Ifng and Gzmb genes in activated mouse T cells (a) and the effect of enzalutamide on AR binding to these AREs (b). Data are representative of n = 3 independent experiments; unpaired Student t-test. c, GSEA illustrating the significant enrichment of IFNγ response in mouse Ar-knockout (AR-KO) versus control CD8 T cells (n = 3 biological replicates). NES, normalized enrichment score. d, Enrichment of the human CD8 R versus NR signature in mouse Ar-knockout versus control CD8 T cells. Two-tailed unpaired Student’s t-test. In box plots: centre line, median; box, interquartile range (IQR; the range between the 25th and 75th percentile); whiskers, 1.58 × IQR. eg, Wild-type or Ar-KO P14 T cells were transferred into congenic recipients; recipients were infected with LCMV clone 13, and transferred T cells in the draining lymph nodes were assessed 32 days later for IFNγ+ (e), total number (f) and PD-1 mean fluorescence intensity (MFI) (g). hj, Correlation between CD8 R versus NR signature score and AR activity (left) or IFNγ pathway activity (middle) and between AR activity and IFNγ pathway activity (right) in a larger mCRPC patient cohort (h; n = 99 patients) and two metastatic melanoma cohorts (i; n = 42 patients and j; n = 27 patients). Two-tailed Pearson correlation. LN, lymph node. Error bars represent s.e.m.; two-tailed unpaired Student t-test used in eg.

Comment in

Similar articles

Cited by

References

    1. Beer TM et al. Randomized, double-blind, phase III trial of ipilimumab versus placebo in asymptomatic or minimally symptomatic patients with metastatic chemotherapy-naive castration-resistant prostate cancer. J. Clin. Oncol 35, 40–47 (2017). - PubMed
    1. Kwon ED et al. Ipilimumab versus placebo after radiotherapy in patients with metastatic castration-resistant prostate cancer that had progressed after docetaxel chemotherapy (CA184-043): a multicentre, randomised, double-blind, phase 3 trial. Lancet Oncol. 15, 700–712 (2014). - PMC - PubMed
    1. Fong PC et al. Pembrolizumab plus enzalutamide in abiraterone-pretreated patients with metastatic castrate resistant prostate cancer: cohort C of the phase 1b/2 KEYNOTE-365 study. J. Clin. Oncol 37, suppl:abstr 5010 (2019)
    1. Sharma P et al. Nivolumab plus ipilimumab for metastatic castration-resistant prostate cancer: preliminary analysis of patients in the CheckMate 650 trial. Cancer Cell. 38, 489–499 (2020). - PubMed
    1. Antonarakis ES et al. Pembrolizumab for treatment-refractory metastatic castration-resistant prostate cancer: multicohort, open-label phase II KEYNOTE-199 study. J. Clin. Oncol 38, 395–405 (2020). - PMC - PubMed

MeSH terms