

Visualizing Opioid-Use Variation in a Pediatric Perioperative Dashboard
- PMID: 35322398
- PMCID: PMC8942721
- DOI: 10.1055/s-0042-1744387
Visualizing Opioid-Use Variation in a Pediatric Perioperative Dashboard
Abstract
Background: Anesthesiologists integrate numerous variables to determine an opioid dose that manages patient nociception and pain while minimizing adverse effects. Clinical dashboards that enable physicians to compare themselves to their peers can reduce unnecessary variation in patient care and improve outcomes. However, due to the complexity of anesthetic dosing decisions, comparative visualizations of opioid-use patterns are complicated by case-mix differences between providers.
Objectives: This single-institution case study describes the development of a pediatric anesthesia dashboard and demonstrates how advanced computational techniques can facilitate nuanced normalization techniques, enabling meaningful comparisons of complex clinical data.
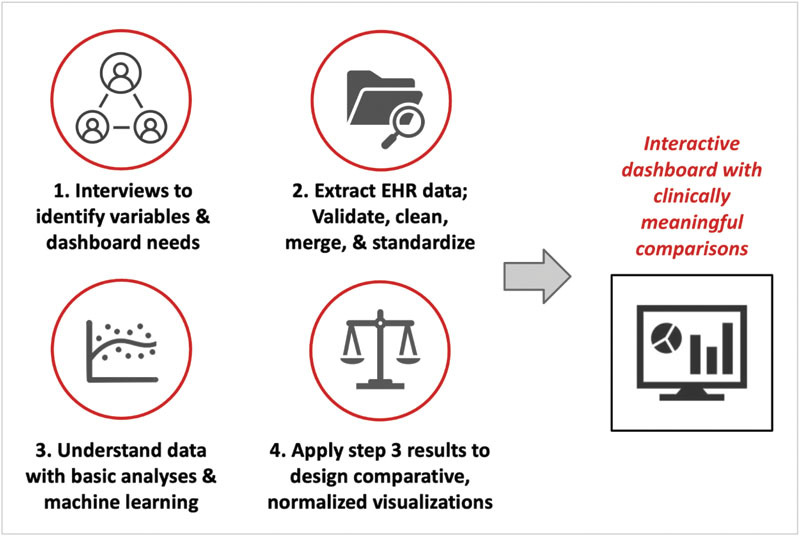
Methods: We engaged perioperative-care stakeholders at a tertiary care pediatric hospital to determine patient and surgical variables relevant to anesthesia decision-making and to identify end-user requirements for an opioid-use visualization tool. Case data were extracted, aggregated, and standardized. We performed multivariable machine learning to identify and understand key variables. We integrated interview findings and computational algorithms into an interactive dashboard with normalized comparisons, followed by an iterative process of improvement and implementation.
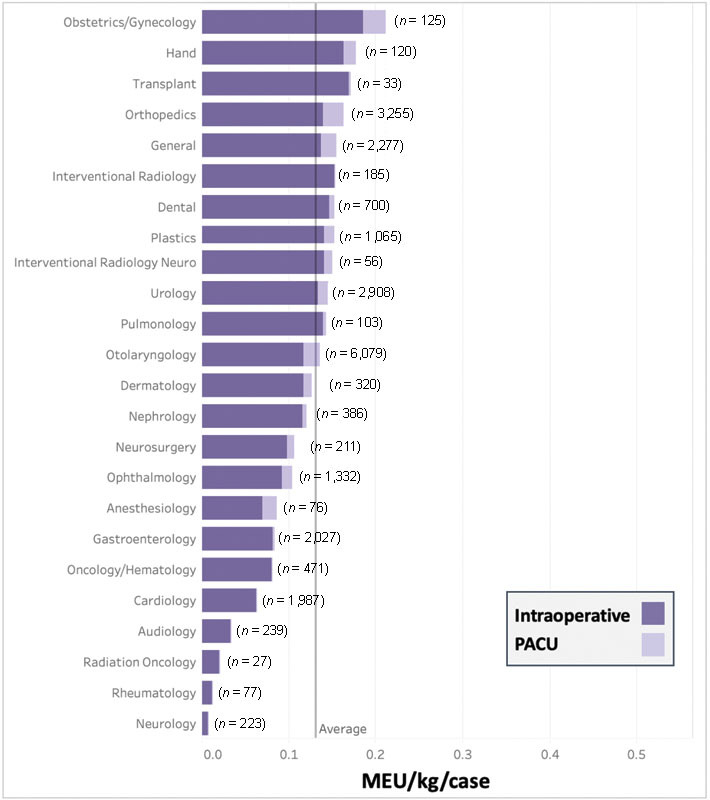
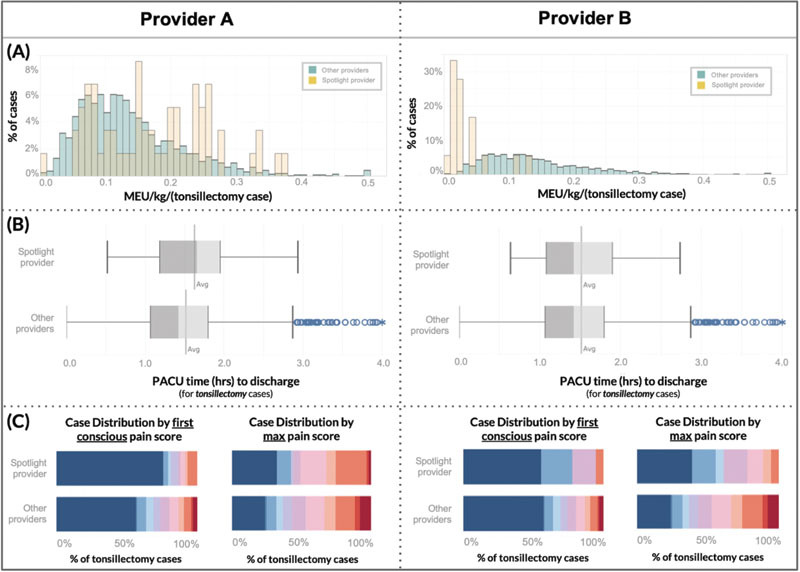
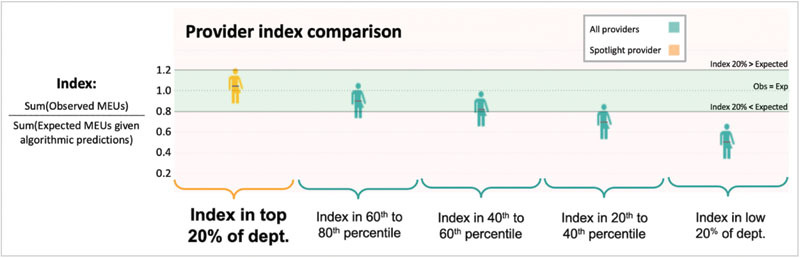
Results: The dashboard design process identified two mechanisms-interactive data filtration and machine-learning-based normalization-that enable rigorous monitoring of opioid utilization with meaningful case-mix adjustment. When deployed with real data encompassing 24,332 surgical cases, our dashboard identified both high and low opioid-use outliers with associated clinical outcomes data.
Conclusion: A tool that gives anesthesiologists timely data on their practice patterns while adjusting for case-mix differences empowers physicians to track changes and variation in opioid administration over time. Such a tool can successfully trigger conversation amongst stakeholders in support of continuous improvement efforts. Clinical analytics dashboards can enable physicians to better understand their practice and provide motivation to change behavior, ultimately addressing unnecessary variation in high impact medication use and minimizing adverse effects.
Thieme. All rights reserved.
Conflict of interest statement
None declared.
Figures
Similar articles
-
Dashboard of Short-Term Postoperative Patient Outcomes for Anesthesiologists: Development and Preliminary Evaluation.JMIR Perioper Med. 2023 Sep 19;6:e47398. doi: 10.2196/47398. JMIR Perioper Med. 2023. PMID: 37725426 Free PMC article.
-
Development, implementation and preliminary evaluation of clinical dashboards in a department of anesthesia.J Clin Monit Comput. 2021 May;35(3):617-626. doi: 10.1007/s10877-020-00522-x. Epub 2020 May 16. J Clin Monit Comput. 2021. PMID: 32418147 Free PMC article.
-
Developing an Audit and Feedback Dashboard for Family Physicians: User-Centered Design Process.JMIR Hum Factors. 2023 Nov 9;10:e47718. doi: 10.2196/47718. JMIR Hum Factors. 2023. PMID: 37943586 Free PMC article.
-
Quality Improvement in Anesthesiology - Leveraging Data and Analytics to Optimize Outcomes.Anesthesiol Clin. 2018 Mar;36(1):31-44. doi: 10.1016/j.anclin.2017.10.006. Anesthesiol Clin. 2018. PMID: 29425597 Review.
-
Creation of an integrated outcome database for pediatric anesthesia.Paediatr Anaesth. 2016 Apr;26(4):345-55. doi: 10.1111/pan.12857. Paediatr Anaesth. 2016. PMID: 26956515 Review.
Cited by
-
Opioid Prescribing for Chronic Musculoskeletal Conditions: Trends over Time and Implementation of Safe Opioid-Prescribing Practices.Appl Clin Inform. 2023 Oct;14(5):961-972. doi: 10.1055/s-0043-1776879. Epub 2023 Dec 6. Appl Clin Inform. 2023. PMID: 38057261 Free PMC article.
-
Visual communication of public health data: a scoping review.Front Digit Health. 2025 Apr 24;7:1555231. doi: 10.3389/fdgth.2025.1555231. eCollection 2025. Front Digit Health. 2025. PMID: 40343212 Free PMC article.
-
Electronic Health Record User Dashboard for Optimization of Surgical Resident Procedural Reporting.Appl Clin Inform. 2025 Jan;16(1):185-192. doi: 10.1055/a-2444-0342. Epub 2024 Oct 17. Appl Clin Inform. 2025. PMID: 39419264
-
Development of a Real-Time Dashboard for Overdose Touchpoints: User-Centered Design Approach.JMIR Hum Factors. 2024 Jun 11;11:e57239. doi: 10.2196/57239. JMIR Hum Factors. 2024. PMID: 38861717 Free PMC article.
-
Use of artificial intelligence in paediatric anaesthesia: a systematic review.BJA Open. 2023 Feb 7;5:100125. doi: 10.1016/j.bjao.2023.100125. eCollection 2023 Mar. BJA Open. 2023. PMID: 37587993 Free PMC article. Review.
References
-
- Morton N S, Errera A. APA national audit of pediatric opioid infusions. Paediatr Anaesth. 2010;20(02):119–125. - PubMed
-
- Howard R F, Lloyd-Thomas A, Thomas M. Nurse-controlled analgesia (NCA) following major surgery in 10,000 patients in a children's hospital. Paediatr Anaesth. 2010;20(02):126–134. - PubMed
-
- Association of Paediatric Anaesthetists of Great Britain and Ireland . Good practice in postoperative and procedural pain management, 2nd ed. Paediatr Anaesth. 2012;22 01:1–79. - PubMed
-
- Long D R, Friedrich S, Eikermann M. High intraoperative opioid dose increases readmission risk in patients undergoing ambulatory surgery. Br J Anaesth. 2018;121(05):1179–1180. - PubMed
Publication types
MeSH terms
Substances
LinkOut - more resources
Full Text Sources
Medical