. 2022 May;9(15):e2104296.
doi: 10.1002/advs.202104296. Epub 2022 Mar 24.

Bioactivity and miRNome Profiling of Native Extracellular Vesicles in Human Induced Pluripotent Stem Cell-Cardiomyocyte Differentiation

Affiliations

Bioactivity and miRNome Profiling of Native Extracellular Vesicles in Human Induced Pluripotent Stem Cell-Cardiomyocyte Differentiation

Ana F Louro et al. Adv Sci (Weinh). 2022 May.

Abstract

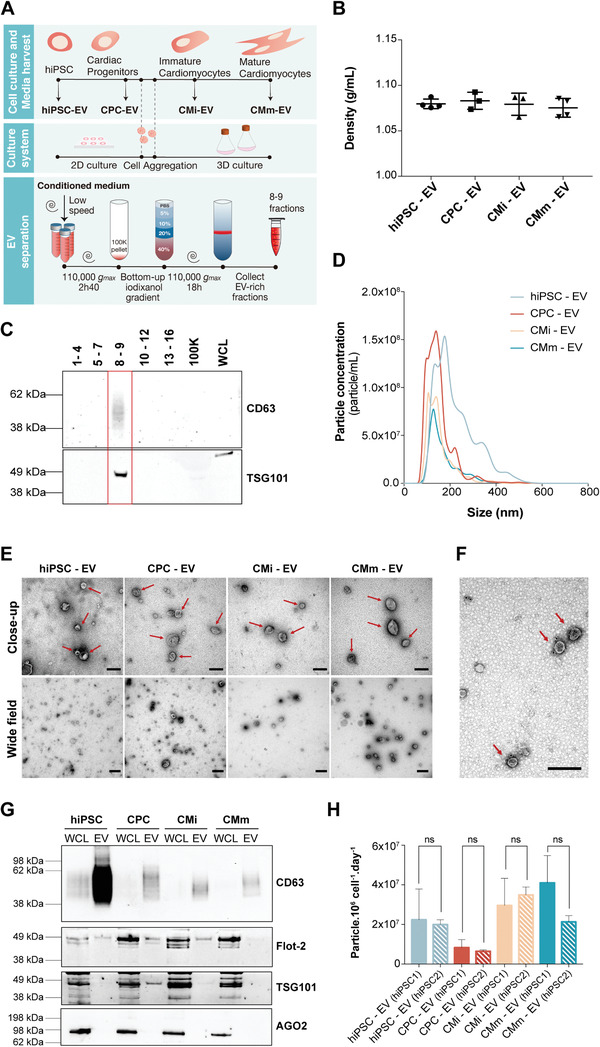
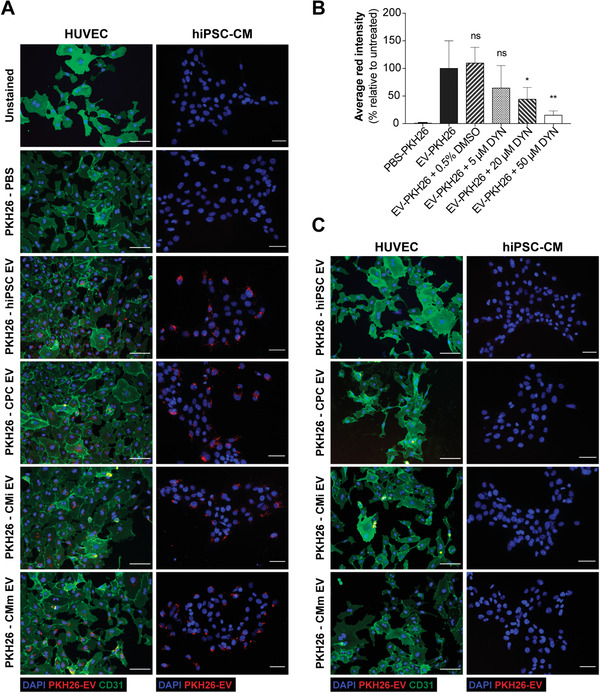
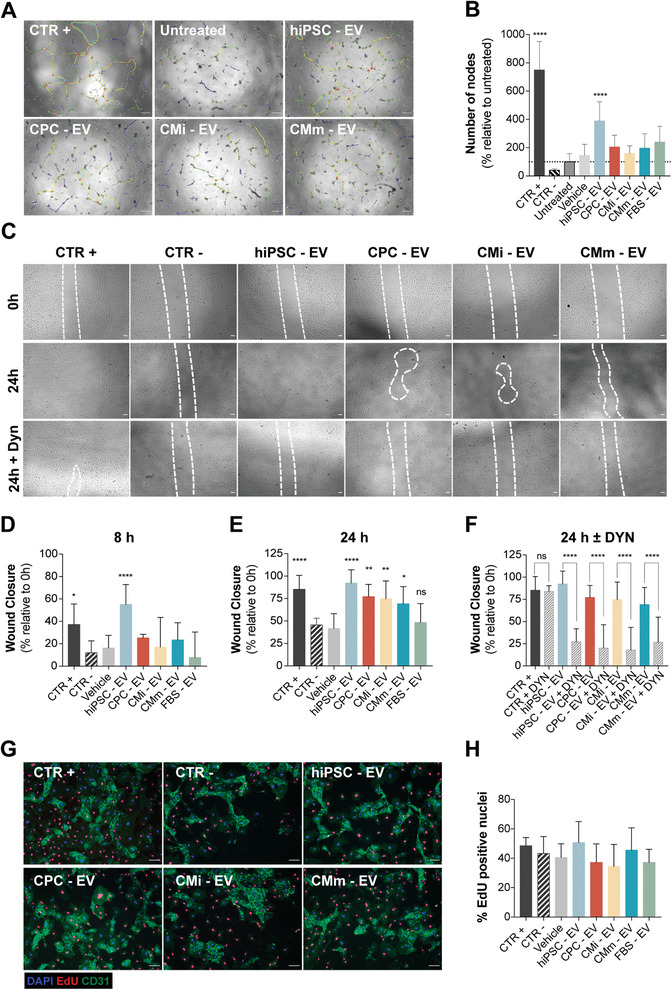
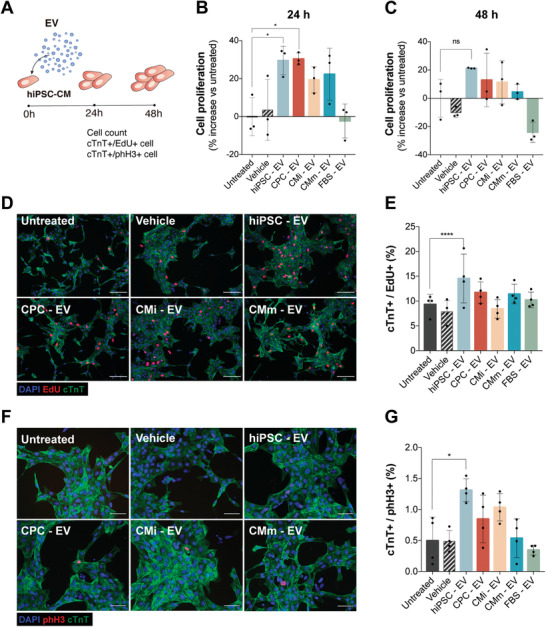
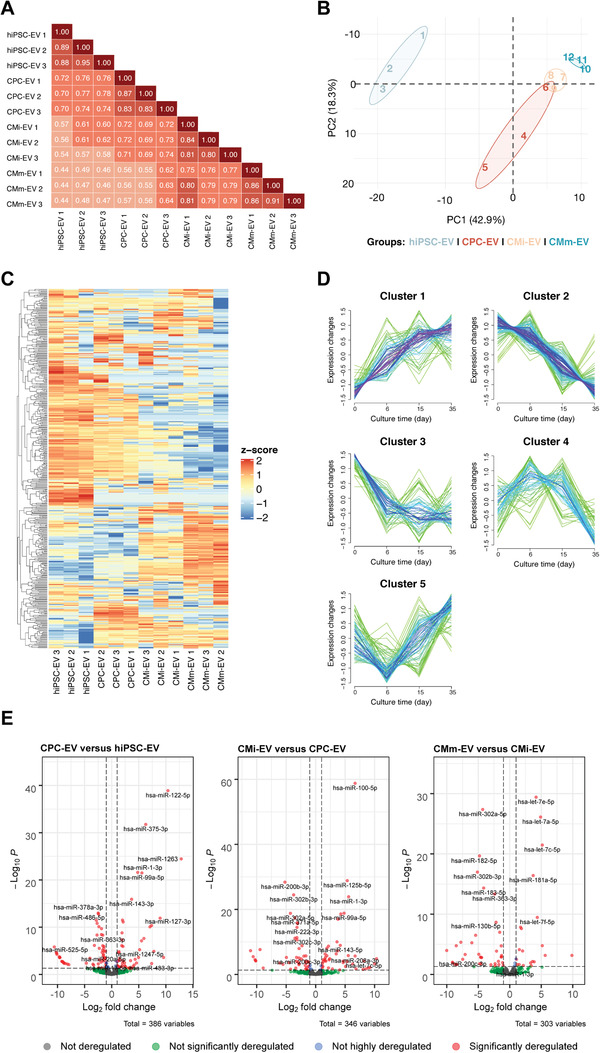
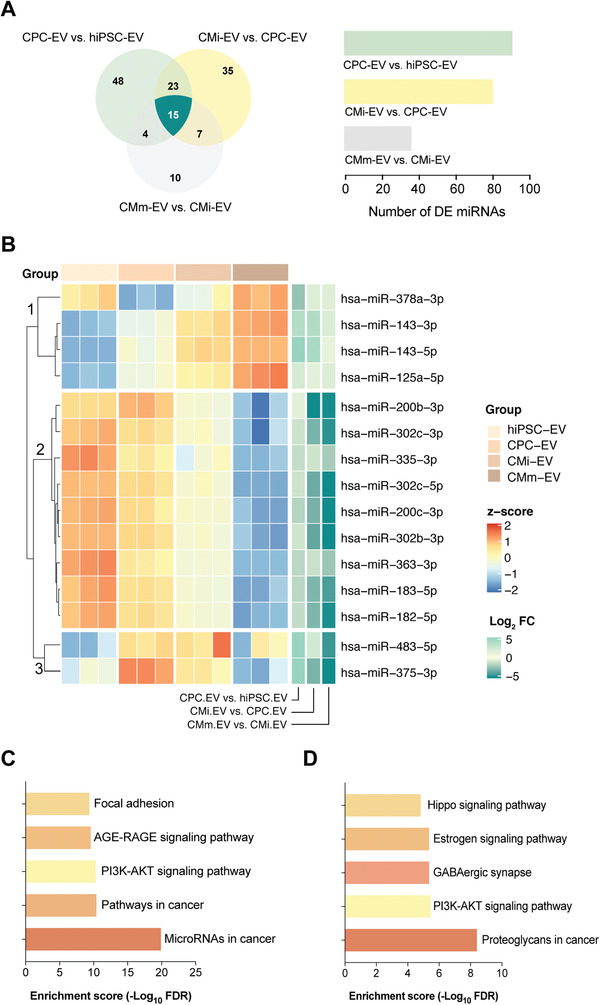
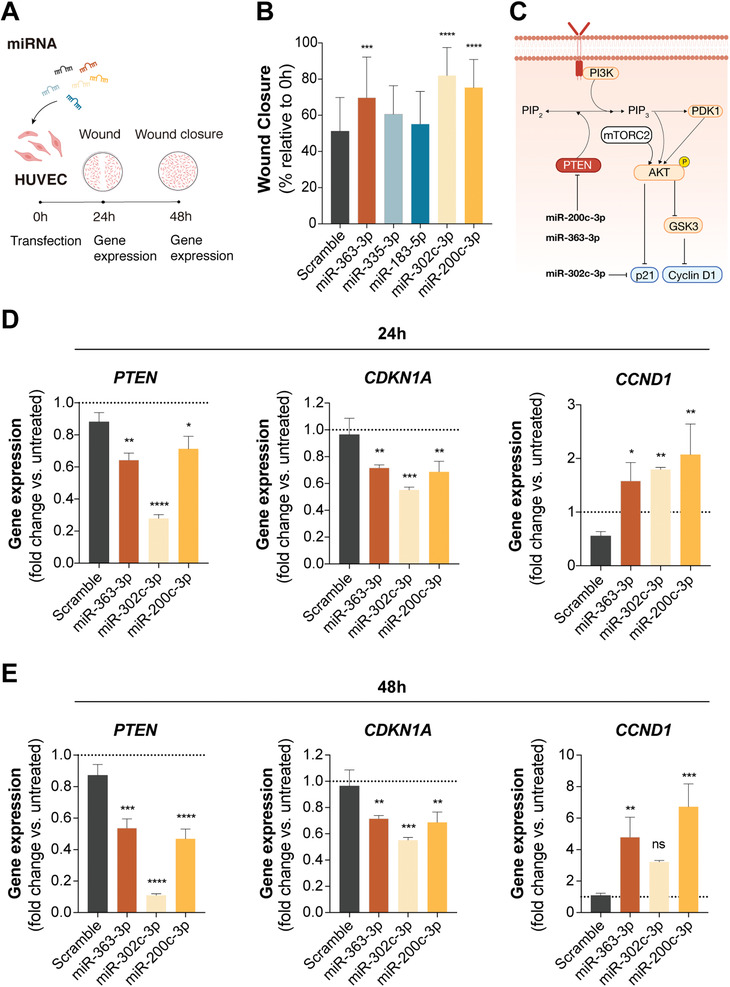
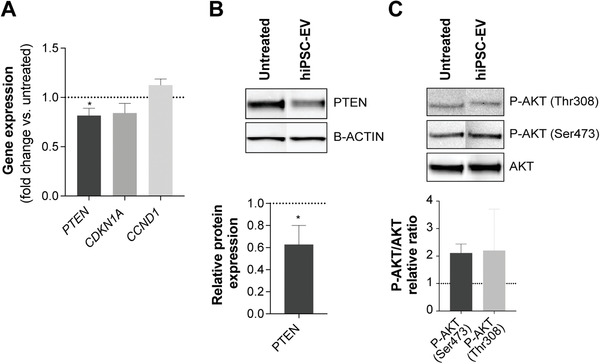
Extracellular vesicles (EV) are an attractive therapy to boost cardiac regeneration. Nevertheless, identification of native EV and corresponding cell platform(s) suitable for therapeutic application, is still a challenge. Here, EV are isolated from key stages of the human induced pluripotent stem cell-cardiomyocyte (hiPSC-CM) differentiation and maturation, i.e., from hiPSC (hiPSC-EV), cardiac progenitors, immature and mature cardiomyocytes, with the aim of identifying a promising cell biofactory for EV production, and pinpoint the genetic signatures of bioactive EV. EV secreted by hiPSC and cardiac derivatives show a typical size distribution profile and the expression of specific EV markers. Bioactivity assays show increased tube formation and migration in HUVEC treated with hiPSC-EV compared to EV from committed cell populations. hiPSC-EV also significantly increase cell cycle activity of hiPSC-CM. Global miRNA expression profiles, obtained by small RNA-seq analysis, corroborate an EV-miRNA pattern indicative of stem cell to cardiomyocyte specification, confirming that hiPSC-EV are enriched in pluripotency-associated miRNA with higher in vitro pro-angiogenic and pro-proliferative properties. In particular, a stemness maintenance miRNA cluster upregulated in hiPSC-EV targets the PTEN/PI3K/AKT pathway, involved in cell proliferation and survival. Overall, the findings validate hiPSC as cell biofactories for EV production for cardiac regenerative applications.

Keywords: cardiac regeneration; cell biofactory; extracellular vesicles; miRNome; small RNA-seq.


Conflict of interest statement

The authors declare no conflict of interest.

Figures

Figure 1
Figure 1
Schematic representation of the experimental design and EV separation method validation. A) Overview of the cardiomyocyte differentiation and EV isolation processes from the different cell populations—human induced pluripotent stem cells (hiPSC) and their derivatives including cardiac progenitor cells (CPC) and cardiomyocytes at different stages of maturation (immature (CMi) and more mature (CMm) cells). B) Density of EV isolated in 8–9 gradient fractions. C) Validation of the EV separation method by western blot analysis of CD63 and TSG101 on density gradient fractions after ultracentrifugation. 100K—pellet resulting from the first ultracentrifugation. WCL: whole cell lysate. D) Typical size distribution profile of EV samples analyzed by nanoparticle tracking analysis (NTA). Plotted lines correspond to the averaged size distribution profiles from three EV isolations. E) Representative negative staining close‐up and wide‐field transmission electron microscopy (TEM) images of all EV samples. EVs are marked by red arrows. Scale bars: close‐up: 200 nm; wide‐field: 500 nm. F) Representative CD63 immunogold labeling of hiPSC‐EV. CD63‐labeled EVs are marked by red arrows. Scale bar: 200 nm. G) Western blot analysis of common EV markers (CD63, Flotilin‐2, and TSG101) and co‐isolated contaminants (AGO2) for 8–9 pooled gradient fractions. WCL: whole cell lysate. H) EVs yield obtained along hiPSC‐CM differentiation and maturation for both cell lines studied. No significant differences were found between cell lines, for each differentiation stage. In (B) and (H) results are plotted as mean ± SD (n = 3). n.s. (p > 0.05) by one‐way ANOVA with Sidak's multiple comparisons test, with a single pooled variance.
Figure 2
Figure 2
EV are uptaken by endothelial cells and cardiomyocytes. A) Representative immunofluorescence images of the uptake assays performed in HUVEC and hiPSC‐CM. B) Effects of Dynasore treatment on EV uptake. Quantification of the average red channel intensity corresponding to the emission range of PKH26 in HUVEC treated with PKH26‐EV in the absence or presence of increasing concentrations of Dynasore. Data presented as mean ± SD, n = 3, *p < 0.05, **p < 0.01, ns: nonsignificant versus EV‐PKH26 group by one‐way ANOVA with Dunnett's multiple comparisons test, with a single pooled variance. C) Representative immunofluorescence images of the uptake inhibition assay performed in HUVEC and hiPSC‐CM upon addition of 50 × 10−6 m of Dynasore. HUVECs were stained for the transmembrane protein CD31 (green), EV were labeled with PKH26 and nuclei were counterstained with DAPI (blue). Cells were observed under an inverted fluorescence microscope (DMI6000, Leica Microsystems GmbH, Germany). Scale bar: 100 µm.
Figure 3
Figure 3
hiPSC‐EV promote angiogenesis and migration in HUVEC. A) Angiogenic potential of EV samples, evaluated as tube formation at 8 h post‐seeding. The number of nodes (pink dots), master junctions (pink circles), master segments (yellow), meshes (light blue), branches (green), and isolated segments (blue) are shown. Scale bar: 100 µm. B) Tube formation measured as percentage of number of nodes formed in the assay, relative to the untreated control (taken as 100%). Fully supplemented medium was used as positive control, 5 × 10−6 m Suramin Sodium Salt prepared in basal medium as negative control, basal medium as untreated control, and 8–9 fractions of a blank gradient as vehicle control. C) Effect of EV treatment on HUVEC migration evaluated by the wound healing assay. Representative images of cell migration at 0 and 24 h post‐scratch, with and without EV uptake inhibition by Dynasore (50 × 10−6 m). Scale bar: 100 µm. Wound closure at D) 8 h and E) 24 h post‐scratch. F) Wound closure at 24 h, with and without EV‐uptake inhibition, mediated by Dynasore (50 × 10−6 m). Wound closure measured as a percentage of the initial wound area. Fully supplemented medium was used as positive control, basal medium supplemented with 0.5% fetal calf serum minus growth factors, as negative control and 8–9 fractions of a blank gradient as vehicle control. G) HUVEC proliferation in the wound healing assay, assessed by EdU incorporation (red). HUVEC were stained for the transmembrane protein CD31 (green) and nuclei were counterstained with DAPI (blue). Purple nuclei in merged images correspond to proliferating cells. Scale bar: 100 µm. H) Quantification of EdU‐positive cells from five randomly selected fields per well, equivalent to a minimum of 1000 DAPI‐stained nuclei per experiment. No significant differences were observed for any of the samples. In (B), (D), (E), (F), and (H), results are plotted as mean ± SD (n = 3). In (B), (D), (E), and (H), significance was tested against the negative control. *p < 0.05, **p < 0.01, ****p < 0.0001, n.s. (p > 0.05) by one‐way ANOVA with Dunnett's multiple comparisons test, with a single pooled variance. In (F), significance was tested by one‐way ANOVA with Sidak's multiple comparisons test, with a single pooled variance. ****p < 0.0001, n.s. (p > 0.05). CTR+: positive control, CTR−: negative control.
Figure 4
Figure 4
hiPSC‐EV promote hiPSC‐CM short‐term proliferation. A) Schematic of EV bioactivity assays on hiPSC‐CM. hiPSC‐CM were plated at a third of the normal seeding density (≈100 000 cell cm−2) and treated with EV 24 h post‐seeding (0 h). Proliferation was assessed 24 and 48 h after treatment. B,C) Expansion of hiPSC‐CM represented as percentage increase over the untreated control (culture medium without added EV) at 24 and 48 h after treatment, respectively. Eight to nine fractions of a blank gradient were used as vehicle control. D) Immunofluorescence images and E) the quantification of proliferation marker EdU (red), cardiac troponin T (cTnT) (green), and nuclei (blue) in cardiomyocytes. F) Immunofluorescence images and (G) the quantification of mitotic cardiomyocytes assessed by phospho‐Histone H3 (phH3) (red), cTnT (green), and nuclei (blue). Data are mean ± SD [n = 3 in (B) and (C) and n = 4 in (E) and (G)]. Significance was tested against the negative control. *p < 0.05, ****p < 0.0001, n.s. (p > 0.05) by one‐way ANOVA with Dunnett's multiple comparisons test, with a single pooled variance.
Figure 5
Figure 5
EV miRNome reflects the cellular changes that occur during hiPSC‐CM differentiation. A) Pearson's correlation analysis revealed a moderate degree of similarity between the miRNA expression profiles of all EV populations. B) Principal component analysis (PCA) shows a highly significant discrimination of the miRNA expressed between EV from different cell populations. C) Heatmap representing the z‐score normalized global miRNA expression in three biological replicates of hiPSC‐EV, CPC‐EV, CMi‐EV, and CMm‐EV, with a number of reads greater than a mean of 5 in at least one EV population. Dendrograms are based on complete‐linkage hierarchical clustering and Euclidean distances. D) Fuzzy plots representing the dynamic expression of five distinguishable miRNA clusters found in EV along hiPSC‐CM. E) Volcano Plots with pairwise comparisons of significantly differentially expressed miRNAs between EV populations (Log FC ≥ |−1| and p ≤ 0.05). All results correspond to EV from three independent isolations, corresponding to three different batches of conditioned culture media (n = 3).
Figure 6
Figure 6
An EV‐miRNA cluster is differentially expressed throughout hiPSC‐CM differentiation. A) Venn diagram representation of the unique and shared differentially regulated miRNA between CPC‐EV versus hiPSC‐EV (light green), CMi‐EV versus CPC‐EV (yellow), and CMm‐EV versus CMi‐EV (gray). B) Heatmap and dendrograms of z‐score normalized miRNA expression levels illustrating the 15 common differentially expressed miRNA obtained in (A). miRNAs are clustered based on k‐means (clusters 1, 2, and 3). Fold changes (in log scale) are shown on the right side of the plot. C,D) Pathway enrichment analysis for miRNA in cluster 2 of the heatmap shown in (B). C) Top 5 KEGG (Kyoto Encyclopedia of Genes and Genomes) pathways for experimentally validated targets of miRNA obtained with Ingenuity Pathway Analysis. D) Top 5 KEGG pathways for miRNA obtained with DIANA‐miRPath v3.0.
Figure 7
Figure 7
Overexpression of a miRNA stemness cluster induces endothelial cell migration. A) Schematic representation of the transient transfection assays performed on human umbilical vein endothelial cells (HUVEC). B) Wound closure 24 h post‐scratch (48 h post‐transfection). Three of the five miRNA transfected into HUVEC were able to promote wound closure (measured as a percentage of the initial wound area; n = 4). C) Schematic overview of the described interactions of miRs‐200c‐3p, 363‐3p, and 302c‐3p with the PI3K/AKT pathway (Adobe Illustrator). D,E) Gene expression profiles of PTEN, CDKN1A (p21WAF/Cip1), and CCND1 (cyclin D1) at 24 and 48 h after HUVEC transient transfection. Data presented as mean ± SD, n = 4 for (B) and n = 3 for (D) and (E). Significance was tested against the scramble control. *p < 0.05, **p < 0.01, ***p < 0.001, ****p < 0.0001, n.s. (p > 0.05) by one‐way ANOVA with Dunnett's multiple comparisons test, with a single pooled variance.
Figure 8
Figure 8
hiPSC‐EV target the PI3K/AKT pathway. A) Gene expression of PTEN, CDKN1A (p21WAF/Cip1), and CCND1 (cyclin D1) on HUVEC treated with hiPSC‐EV for 24 h. B) Western blot for PTEN and quantification of PTEN expression relative to B‐ACTIN. C) Western blot for total AKT and active phosphorylated forms (P‐AKT Thr308 and P‐AKT Ser473). Relative quantification of P‐AKT was performed against total AKT. Data are mean ± SD, n = 3. Relative ratios were calculated in relation to the untreated control (ECGM‐2 only). Significance tested by a one‐sample t‐test. *p < 0.05.

Similar articles

Cited by

References

    1. Yuana Y., Sturk A., Nieuwland R., Blood Rev. 2013, 27, 31. - PubMed
    1. Mathieu M., Martin‐Jaular L., Lavieu G., Théry C., Nat. Cell Biol. 2019, 21, 9. - PubMed
    1. Van Niel G., D'Angelo G., Raposo G., Nat. Rev. Mol. Cell Biol. 2018, 19, 213. - PubMed
    1. Théry C., Witwer K. W., Aikawa E., Alcaraz M. J., Anderson J. D., Andriantsitohaina R., Antoniou A., Arab T., Archer F., Atkin‐Smith G. K., Ayre D. C., Bach J. M., Bachurski D., Baharvand H., Balaj L., Baldacchino S., Bauer N. N., Baxter A. A., Bebawy M., Beckham C., Bedina Zavec A., Benmoussa A., Berardi A. C., Bergese P., Bielska E., Blenkiron C., Bobis‐Wozowicz S., Boilard E., Boireau W., Bongiovanni A., et al., J. Extracell. Vesicles 2018, 7, 1535750. - PMC - PubMed
    1. Sluijter J. P. G., Davidson S. M., Boulanger C. M., Buzás E. I., de Kleijn D. P. V., Engel F. B., Giricz Z., Hausenloy D. J., Kishore R., Lecour S., Leor J., Madonna R., Perrino C., Prunier F., Sahoo S., Schiffelers R. M., Schulz R., Van Laake L. W., Ytrehus K., Ferdinandy P., Cardiovasc. Res. 2018, 114, 19. - PMC - PubMed

Publication types

MeSH terms