. 2022 May;9(15):e2103526.
doi: 10.1002/advs.202103526. Epub 2022 Mar 24.

Kidney Decellularized Extracellular Matrix Enhanced the Vascularization and Maturation of Human Kidney Organoids

Affiliations

Kidney Decellularized Extracellular Matrix Enhanced the Vascularization and Maturation of Human Kidney Organoids

Jin Won Kim et al. Adv Sci (Weinh). 2022 May.

Abstract

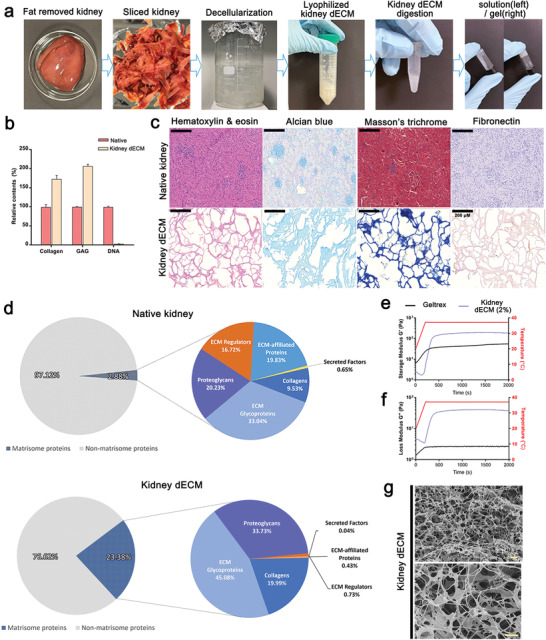
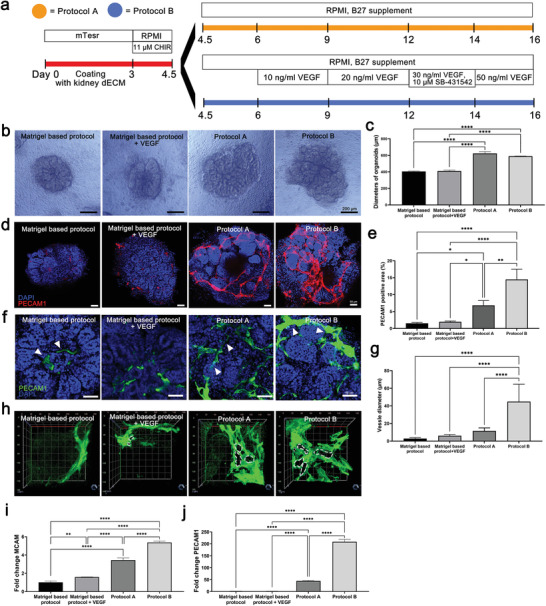
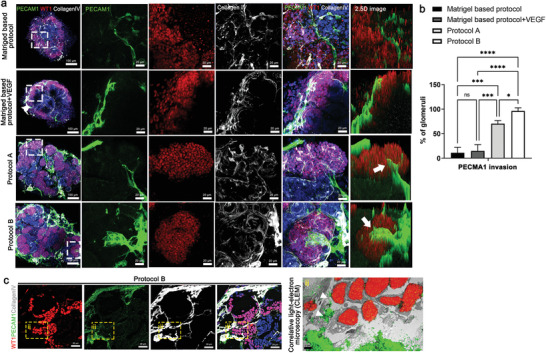
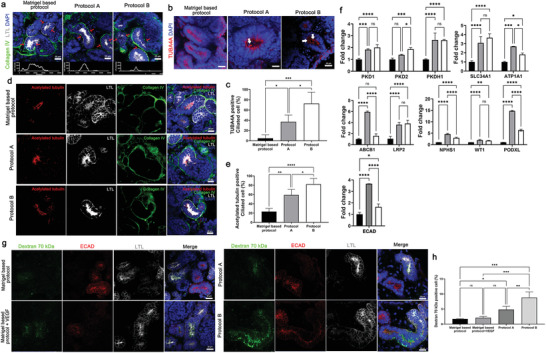
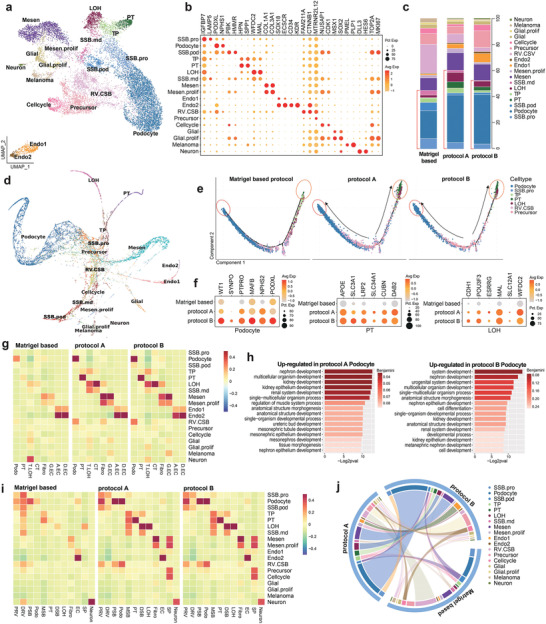
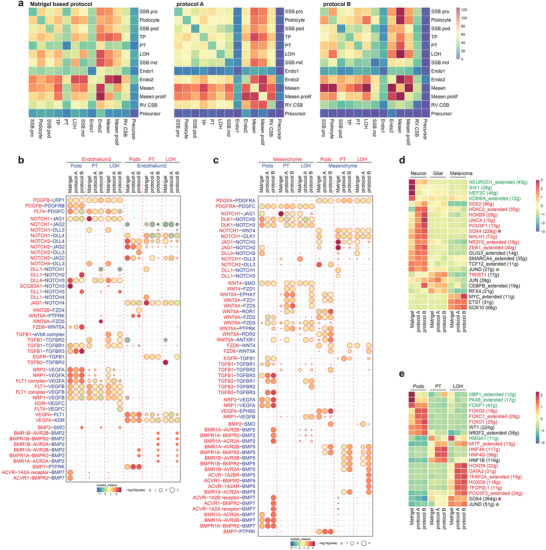
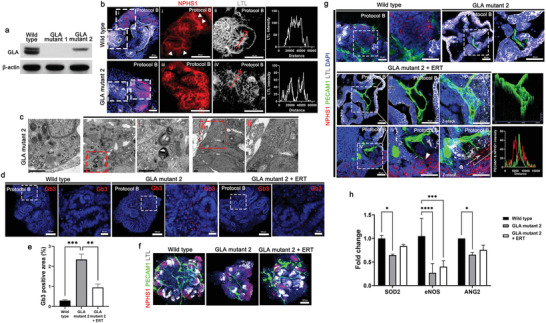
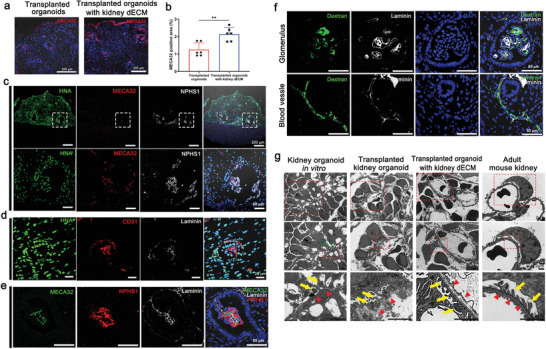
Kidney organoids derived from human pluripotent stem cells (hPSCs) have extensive potential for disease modelling and regenerative medicine. However, the limited vascularization and immaturity of kidney organoids have been still remained to overcome. Extracellular matrix (ECM) can provide mechanical support and a biochemical microenvironment for cell growth and differentiation. Here in vitro methods using a kidney decellularized extracellular matrix (dECM) hydrogel to culture hPSC-derived kidney organoids, which have extensive vascular network and their own endothelial cells, are reported. Single-cell transcriptomics reveal that the vascularized kidney organoids cultured using the kidney dECM have more mature patterns of glomerular development and higher similarity to human kidney than those cultured without the kidney dECM. Differentiation of α-galactosidase A (GLA)-knock-out hPSCs generated using CRISPR/Cas9 into kidney organoids by the culture method using kidney dECM efficiently recapitulate Fabry nephropathy with vasculopathy. Transplantation of kidney organoids with kidney dECM into kidney of mouse accelerates the recruitment of endothelial cells from the host mouse kidney and maintains vascular integrity with the more organized slit diaphragm-like structures than those without kidney dECM. The kidney dECM methodology for inducing extensive vascularization and maturation of kidney organoids can be applied to studies for kidney development, disease modeling, and regenerative medicine.

Keywords: extracellular matrix; kidney; organoid; vascularization.


Conflict of interest statement

The authors declare no conflict of interest.

Figures

Figure 1
Figure 1
Decellularization process of porcine kidney and characterization. a) The gelation steps of decellularizing porcine kidneys. b) Paired column comparison of collagen, glycosaminoglycan (GAG), and DNA before (Native) and after kidney tissue decellularization (kidney dECM) (n = 3). c) Representative images of native kidney and kidney dECM gel stained with hematoxylin & eosin, Alcian blue, Masson's trichrome, and Fibronectin. Scale bar = 200 µm. d) Graph of proteins identified by liquid chromatography–tandem mass spectrometry (LC–MS/MS) in native kidney and kidney dECM. e,f) Storage and loss modulus comparison of kidney dECM pre‐gel and Matrigel. g) Scanning electron microscopy images of the kidney dECM hydrogel at 10 000× (left) and 30 000× magnification (right). Scale bar = 2 µm.
Figure 2
Figure 2
Kidney organoids differentiation using kidney tissue decellularized ECM gel. a) Protocols for kidney organoids differentiation based on kidney dECM hydrogel. b) Representative bright field images of the morphology of kidney organoids cultured by Matrigel‐based protocol, Matrigel‐based protocol+VEGF, protocol A and protocol B. Scale bar = 200 µm. c) Diameters of kidney organoids differentiated by four protocols (n = 10). d,e) Representative confocal images of PECAM1 and quantification of the percentage of PECAM1 positive area. Scale bar = 50 µm (n = 3). f,g) Representative confocal fluorescence images showing PECAM1 and the quantification of the diameter of the kidney organoids vessels. Scale bar = 25 µm (n = 3). h) Representative 3D confocal fluorescence images showing PECAM1. i,j) qRT‐PCR analysis of MCAM and PECAM1 in kidney organoids differentiated by Matrigel‐based protocol, Matrigel‐based protocol + VEGF, protocol A and protocol B kidney organoids (n = 3). Values are mean ± SEM. *p < 0.05, **p < 0.01, ***p < 0.001, ****p < 0.0001, measured by one‐way ANOVA with Tukey's multiple comparisons test.
Figure 3
Figure 3
Enhanced vascularization of kidney organoids cultured on kidney dECM by protocol B. a) Representative images of immunofluorescent staining of WT1 (podocyte), PECAM1 (vascular network), and CollagenIV (basement membrane) in kidney organoids. Invasion of PECAM1+ endothelial cells into WT1+ podocytes clusters (white arrow). Scale bar = 100 µm, 20 µm. b) Quantification of the percentage of PECAM1 invasion into the glomerular‐like structure in the kidney organoid (n = 3). c) Representative images of a correlative light‐ and electron‐microscope (CLEM) study by overlaying a confocal microscopy image stained to reveal PECAM1, WT1, and collagen IV with an electron microscope (EM) image of the same structures in the kidney organoids (panel ii). Scale bar = 20 µm for immunofluorescent staining and scale bar = 2 µm for EM. Values are mean ± SEM. NS, no significance, *p < 0.05, ***p < 0.001, ****p < 0.0001, measured by one‐way ANOVA with Tukey's multiple comparisons test.
Figure 4
Figure 4
Enhanced the maturation of tubular structure of kidney organoids cultured on kidney dECM. a) Representative images of immunofluorescent staining of LTL and collagen IV in kidney organoids. LTL across the line scan indicated by red arrows above each confocal image. Scale bar = 20 µm (n = 2). b) Representative images of immunofluorescent staining of TUBA4A in kidney organoids. White arrows indicated ciliated cells. Scale bar = 20 µm. c) Quantification of the percentage of TUBA4A positive ciliated cell (n = 4). d) Representative confocal fluorescence images showing acetylated tubulin, LTL, and collagen IV in kidney organoids. Scale bar = 20 µm. e) Quantification of the percentage of acetylated tubulin positive ciliated cell (n = 4). f) qRT‐PCR analysis of PKD1, PKD2, and PKHD1 (ciliary genes), SLC34A1 and ATP1A1 (tubular epithelia transporter genes), ABCB1 and LRP2 (drug transporter genes), NPHS1, WT1, and PODXL (podocyte) and ECAD (distal tubule) (n = 3). g) Representative images of kidney organoids incubated fluorescence‐labeled (FITC) dextran 70 kDa and stained E‐cadherin (ECAD, distal tubule) and LTL (proximal tubule). h) Quantification of the percentage of FITC‐dextran 70 kDa positive cell. Scale bar = 20 µm (n = 3). Values are mean ± SEM. NS, no significance, *p < 0.05, **p < 0.01, ***p < 0.001, ****p < 0.0001, measured by one‐way ANOVA and two‐way ANOVA with Tukey's multiple comparisons test.
Figure 5
Figure 5
Single cell RNA‐seq analysis of kidney organoids. a) Uniform manifold approximation and projection (UMAP) embedding of analyzed single‐cell transcriptomes from 12 482 cells from kidney organoid cells annotated by cell type. b) Dot plot shows the expression of cell‐type‐specific genes. c) Each column corresponds to a single dataset. The stacked bar graph shows the cell type composition of each organoid from Matrigel‐based protocol, protocol A, and protocol B. d) The kidney organoid single‐cell transcriptome was reconstructed lineage progression by PAGA‐initialized ForceAtlas2 (via SCANPY). e) Pseudotime plots showing the distribution of each sample. The matured cells (podocyte, PT, and LOH) present strikingly distinct distribution to the end side of the trajectory. f) Dot plot comparing the expression of cell‐type signature and differentiation genes on Podocyte, PT, and LOH between the samples. g) Bar charts show GO enrichment terms of differentially expressed genes from protocol A and B podocytes. h,i) Heatmap of association of human kidney cell types and fetal kidney cell types with cell types in organoid samples, clustered by their expression of top cell‐type differentiating marker genes. j) Circos plot showing the similarity between samples by comparing each single‐cell expression datasets. Abbreviations: NP, nephron progenitor; P.prolif, Podocyte proliferate; TP, tubule progenitor; PT, proximal tubule; LOH, loop of Henle; T.prolif, tubule proliferate; Mesen, mesenchyme; Endo, Endothelium; T.LOH, Thick ascending limb of Loop of Henle; CT, connecting tubule; Fibro, Fibroblast; G.EC, glomerular endothelium; A.EC, ascending casa recta endothelium; D.EC, descending vasa recta endothelium; PRV, proximal renal vesicle; DRV, distal renal vesicle; PSB, proximal S‐shaped body; MSB, medial S‐shaped body; DSB, distal S‐shaped body; SP, stroma progenitor.
Figure 6
Figure 6
Cell communication network in kidney organoid. a) Heatmap showing the potential ligand‐receptor pairs between cell types predicted by CellphoneDB. Bubble plot showing the selected ligand‐receptor interactions with b) Endothelium2 or c) Mesenchyme cells; scaled means indicated by color and p‐value by circle size. Heatmap showing the scaled regulon activity from SCENIC in d) off‐target cell types and e) nephron cell types. The states of the transcription factors were indicated in red (activated in protocol A and B) and green (inactivated in protocol A and B). Abbreviations: SCENIC, single‐cell regulatory network inference and clustering.
Figure 7
Figure 7
Recapitulation of Fabry nephropathy with vasculopathy using GLA‐mutant human kidney organoids differentiated by protocol B. a) Representative western blot for expression of GLA (clones GLA mutant 1 and GLA mutant 2) in kidney organoids. b) Representative image of immunofluorescent staining of NPHS1 and LTL in wild type and GLA‐mutant kidney organoid. LTL across the line scan indicated by red arrows. Scale bar = 50 µm. c) Representative TEM images showing the accumulation of lipid droplet, glycoprotein and zebra bodies. Scale bar = 1 µm. d) Representative images of immunofluorescent staining of Gb3 in wild type and GLA mutant kidney organoids treated human recombinant agalsidase‐α as an enzyme replacement therapy (ERT). Scale bar = 100 µm and 20 µm. e) Quantification of percentage of Gb3 positive area (n = 3). f,g) Representative images of immunofluorescent staining of NPHS1, PECAM1, and LTL in wild type and GLA‐mutant kidney organoids treated with ERT. 2.5D image and line scan (white arrow) obtained from Z‐stack confocal image. White arrowheads indicate the invasion of the PECAM1+ endothelial cells into NPHS1+ podocyte structure. Scale bar = 100 µm for (f) and Scale bar = 50 µm for (g). h) qRT‐PCR analysis of SOD2, eNOS, and ANG2 (n = 3). Values are mean ± SEM. *p < 0.05, **p < 0.01, ***p < 0.001, ****p < 0.0001, measured by one‐way ANOVA and two‐way ANOVA with Tukey's multiple comparisons test.
Figure 8
Figure 8
Accelerated formation of vascular network and maturation of glomerular‐like structures in kidney organoids in vivo when transplanted with kidney dECM. a,b) Representative confocal images of MECA32 in transplanted graft. MECA32‐positive cells were more abundantly observed in kidney organoids transplanted with kidney dECM, indicating the effect of kidney dECM in recruiting endothelial cells from the mouse kidney into the transplanted graft. Scale bar = 200 µm (n = 6). Values are mean ± SEM. **p < 0.01, measured by t‐test. c) Representative confocal images of HNA (Human nuclei antibody), MECA32 and NPHS1 in kidney organoids in vivo when transplanted with kidney dECM. d) Representative confocal images of HNA, CD31, and Laminin in kidney organoids in vivo when transplanted with kidney dECM. e) Representative confocal images of slit diaphragm like structures in kidney organoids transplanted with kidney dECM. Scale bar = 50 µm. f) Representative confocal images of fluorescein isothiocyanate (FITC)‐labeled dextran present inside the vessels and capillaries of glomerular‐like structures in the transplanted kidney organoids. Scale bar = 50 µm. g) Representative transmission electron microscopy (TEM) images of kidney organoids in vitro, transplanted kidney organoids, kidney organoids transplanted with kidney dECM, and adult mouse kidney. Red arrowheads indicated podocyte and tubule maturation structures. Scale bar = 2 µm.

Similar articles

Cited by

References

    1. Freedman B. S., Brooks C. R., Lam A. Q., Fu H., Morizane R., Agrawal V., Saad A. F., Li M. K., Hughes M. R., Vander Werff R., Nat. Commun. 2015, 6, 8715. - PMC - PubMed
    1. Morizane R., Lam A. Q., Freedman B. S., Kishi S., Valerius M. T., Bonventre J. V., Nat. Biotechnol. 2015, 33, 1193. - PMC - PubMed
    1. Taguchi A., Kaku Y., Ohmori T., Sharmin S., Ogawa M., Sasaki H., Nishinakamura R., Cell Stem Cell 2014, 14, 53. - PubMed
    1. Takasato M., Pei X. E., Chiu H. S., Little M. H., Nat. Protoc. 2016, 11, 1681. - PMC - PubMed
    1. Kim Y. K., Refaeli I., Brooks C. R., Jing P., Gulieva R. E., Hughes M. R., Cruz N. M., Liu Y., Churchill A. J., Wang Y., Stem Cells 2017, 35, 2366. - PMC - PubMed

Publication types

Substances

LinkOut - more resources