. 2022 Mar 23;13(1):1559.
doi: 10.1038/s41467-022-29270-z.

Mechanism of action and therapeutic route for a muscular dystrophy caused by a genetic defect in lipid metabolism

Affiliations

Mechanism of action and therapeutic route for a muscular dystrophy caused by a genetic defect in lipid metabolism

Mahtab Tavasoli et al. Nat Commun. .

Abstract

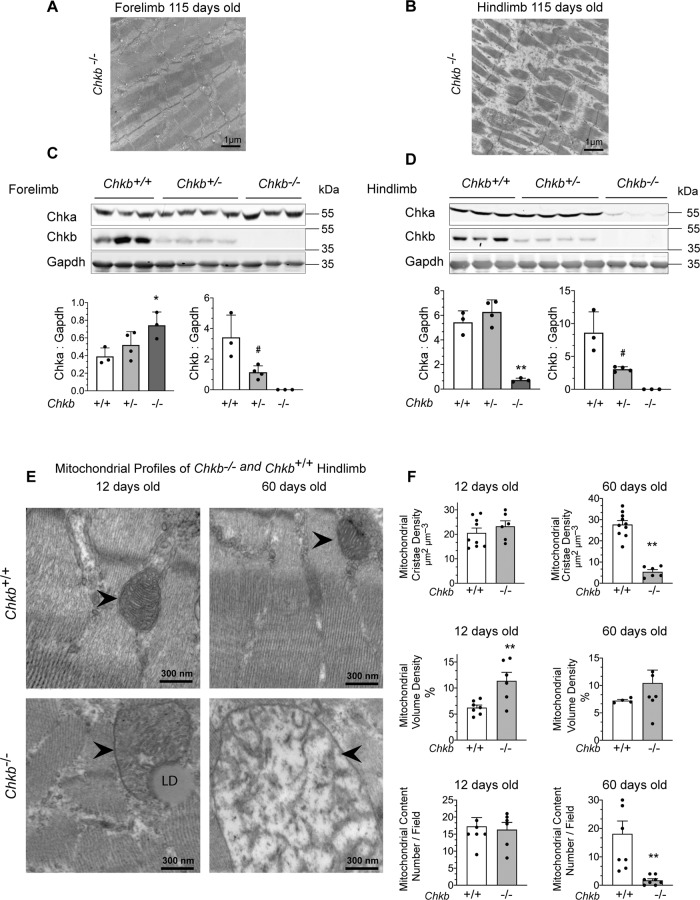
CHKB encodes one of two mammalian choline kinase enzymes that catalyze the first step in the synthesis of the membrane phospholipid phosphatidylcholine. In humans and mice, inactivation of the CHKB gene (Chkb in mice) causes a recessive rostral-to-caudal muscular dystrophy. Using Chkb knockout mice, we reveal that at no stage of the disease is phosphatidylcholine level significantly altered. We observe that in affected muscle a temporal change in lipid metabolism occurs with an initial inability to utilize fatty acids for energy via mitochondrial β-oxidation resulting in shunting of fatty acids into triacyglycerol as the disease progresses. There is a decrease in peroxisome proliferator-activated receptors and target gene expression specific to Chkb-/- affected muscle. Treatment of Chkb-/- myocytes with peroxisome proliferator-activated receptor agonists enables fatty acids to be used for β-oxidation and prevents triacyglyerol accumulation, while simultaneously increasing expression of the compensatory choline kinase alpha (Chka) isoform, preventing muscle cell injury.


Conflict of interest statement

The authors declare no competing interests.

Figures

Fig. 1
Fig. 1. Choline kinase-deficient mice display hallmark muscular dystrophy Phenotypes.
A Body weight was recorded each week at similar times over the entire duration of phenotyping experiment for Chkb+/+, Chkb+/, and Chkb/ mice. B Grip strength measurements were performed at 3 different timepoints and normalized to body weight (BW). C Total distance run during an exhaustion test for all experimental groups at 3 different timepoints. D Loss in muscle force as a result of repeated contractions of EDL muscles by direct stimulation of the nerve for each genotype. E Maximal specific force generated by freshly isolated extensor digitorum longus (EDL) muscle for each genotype. F Serum creatine kinase (CK) level measurements of 6, 12, and 17-week-old Chkb+/+, Chkb+/ and Chkb/ mice. G Muscle weights normalized to body weight of left triceps, EDL, gastrocnemius (Gastroc), quadriceps (Quad), and TA at week 20. All values are expressed as means ± SEM; For A, n = 9 (Chkb+/+), 13 (Chkb+/−) and 8 (Chkb−/−) mice per group. For B, n = 9 (Chkb+/+), 12 (Chkb+/−) and 8 (Chkb−/−) mice per group. For C, n = 9 (Chkb+/+), 13 (Chkb+/−) and 8 (Chkb−/−) mice per group. For D, n = 7 (Chkb+/+), 13 (Chkb+/−) and 7 (Chkb−/−) mice per group. For E, n = 7 (Chkb+/+), 12 (Chkb+/−) and 6 (Chkb−/−) mice per group. For F, n = 8 (Chkb+/+), n = 14 (Chkb+/−) and n = 7 (Chkb/) mice per group. For G, n = 9 (Chkb+/+), n = 12 (Chkb+/−) and n = 6 (Chkb−/−) mice per group. For A, one-way ANOVA with Tukey’s multiple comparison test, p < 0.0001 (week 6 to week 19). For B one-way ANOVA with Tukey’s multiple comparison test, p < 0.0001 (week6, week 12, and week 18). For C, one-way ANOVA with Tukey’s multiple comparison test, p = 0.0002 (week6), p < 0.0001 (week12 and week 18). For D one-way ANOVA with Tukey’s multiple comparison test, p < 0.0001 (1, 10 and 20 nerve stimulations), p = 0.0002 (30 nerve stimulations) and p = 0.0172 (40 nerve stimulations). For E one-way ANOVA with Tukey’s multiple comparison test, p < 0.0001. For F one-way ANOVA with Tukey’s multiple comparison test, p = 0.00016 (week6), p < 0.0001 (week 12) and p = 0.0145 (week17). For G one-way ANOVA with Tukey’s multiple comparison test, p = 0.7151 (for Triceps), p < 0.0001 (for EDL, Gastroc, Quad, and TA). *p < 0.01 vs. all the other groups. Source data are provided as a Source Data file.
Fig. 2
Fig. 2. Chka protein expression is inversely correlated with the rostro-caudal gradient of severity in Chkb-mediated muscular dystrophy.
Transmission electron microscopy (TEM) appearance of A forelimb (triceps) and B hindlimb (quadriceps) of 115-day old Chkb/ mice showing extensive injury in hindlimb not the forelimb. A, B are representative of 3 mice per group with similar appearance. Scale bar = 1 μm. Western blot of C forelimb (triceps) and D hindlimb (quadriceps) samples from three distinct (lanes 1–3) Chkb+/+, four distinct (lanes 4–7) Chkb+/ and three distinct (lanes 8–10) Chkb/ mice probed with anti-Chka, anti-Chkb, and anti-Gapdh antibodies. Bottom: densitometry of the WB data shows the ratio of Chka and Chkb to Gapdh. Chka signal is not significantly different in forelimb and hindlimb samples from Chkb+/ mice compared to the wild type. Chka is upregulated in forelimb muscles and downregulated in hindlimb muscles from Chkb/ mice. Chkb signal is decreased in hindlimb and forelimb muscle samples of Chkb+/− mice and is absent in muscle samples of Chkb/ mice. Values in C and D are means ± SD; For C and D, n = 3 independent Chkb+/+, 4 independent Chkb+/− and 3 independent Chkb−/− mice per group. For C, left, one-way ANOVA with Tukey’s multiple comparison test, p = 0.04335. For C, right, two-sided student’s t-test, p = 0.02842. For D, left, one-way ANOVA with Tukey’s multiple comparison test, p = 0.00011. For D, right, two-sided student’s t-test, p = 0.01553. E Transmission electron microscopy (TEM) appearance of the mitochondrial profile of hindlimbs from 12-day old and 60 days old wild-type (Chkb+/+) and Chkb-deficient (Chkb/) mice. For E, images are representative of 3 mice per group with similar appearance. Scale bar = 300 nm. F At 12 days of age hindlimbs from wild type and Chkb/ mice had the same number of mitochondria per imaged field however, the volume density of the Chkb/ mitochondria was increased and the cristae density was preserved. At 115 days of age, Chkb/ mitochondria were fewer in number, had markedly reduced cristae density, and were much larger in size. The increased size of the mitochondria at this age accounts for the preserved volume density. Values in F are means ± SEM. For F, top, n = 9 (12 days old Chkb+/+), n = 6 (12 days old Chkb/), n = 10 (60 days old Chkb+/+) and n = 6 (60 days old Chkb/) muscle sections from 3 independent mice per genotype for each timepoint. For F, middle, n = 7 (12 days old Chkb+/+), n = 6 (12 days old Chkb/), n = 5 (60 days old Chkb+/+), n = 7 (60 days old Chkb/) muscle sections from 3 independent mice per genotype for each timepoint. For F, bottom, n = 7 (12 days old Chkb+/+), n = 6 (12 days old Chkb/), n = 8 (60 days old Chkb+/+) and n = 8 (60 days old Chkb/) muscle sections from 3 independent mice per genotype for each timepoint. Two-sided student’s t-test. For (F, top), p = 0.39308, p = 0.0000. For F, middle, p = 0.0077, p = 0.427594. For F, bottom, p = 0.78406, p = 0.00273. * and # p < 0.05, **p < 0.01. Source data are provided as a Source Data file.
Fig. 3
Fig. 3. Loss of Chkb activity exerts a major effect on neutral lipid abundance.
Comparison of expression levels of major lipids between the Chkb+/+ and Chkb/ mice. The analysis was performed on A, B, 12-day old hindlimb (quadriceps), and C, D, 30 days old hindlimb (quadriceps) samples. Each point is an individual lipid species (specific fatty acid composition). B, D Summary of fold change and statistical tests performed on major glycerophospholipids. A, C Boxplots bounds (hinges) correspond to the 25th and 75th percentiles of the data with the boxplot center corresponding to the median value. The upper/lower whiskers extend from the hinges to the largest/smallest value no further than 1.5 times the interquartile range away from the hinges. For AD, n = 3 independent Chkb+/+ and 3 independent Chkb/ mice. Pairwise Wilcoxon signed rank test with Bonferroni correction was used to determine the significance of a median pair-wise fold-increase in lipid amounts at an overall significance level of 5%. All statistical tests were two-sided. As the Bonferroni correction is fairly conservative, significant differences are reported at both pre-correction (*) and post-correction (***) significance levels. AcCa, acylcarnitine; TG, triacylglycerol; DG, diacylglycerol; PC, phosphatidylcholine; PE, phosphatidylethanolamine; PG, phosphatidylglycerol; PI, phosphatidylinositol; PS, phosphatidylserine. For (A, B), p = 0.0002 (AcCa), p = 0.0.2500 (DG), p = 0.0625 (TG), p = 0.1748 (PC), p = 0.0000 (PE), p = 0.1250 (PG), p = 0.0070 (CL), p = 0.0078 (PI), p = 1 (PS). For (C, D), p = 1 (AcCa), p = 0.0.0001 (DG), p = 0.0000 (TG), p = 0.5059 (PC), p = 0.0000 (PE), p = 0.6720 (PG), p = 0.2162 (CL), p = 0.1495 (PI), p = 0.0179 (PS). E Transmission electron microscopy (TEM) appearance of the hindlimb muscle samples (quadriceps) of Chkb+/+ and Chkb/ mice at 12 days and 115 days of age. Images are representative of 3 mice per group with similar appearance. LD = Lipid droplets. M = Mitochondria. * = Disrupted sarcomeres. Scale bar = 1.5 μm. F Quadriceps muscle sections of 30 days old Chkb+/+ and Chkb/ mice were fixed and stained with BODIPY-493/503 to visualize LDs (Green). Concanavalin A dye conjugate (CF™ 633) and DAPI were used to stain membrane (Red) and nucleus (Blue) respectively. Images are representative of 3 mice per group with similar results. Scale bar = 40 μm. Source data are provided as a Source Data file.
Fig. 4
Fig. 4. Chkb regulates the gene expression of the members of the Ppar family as well as Ppar target genes.
A Relative gene expression of the Ppar family members. B Western blot of hindlimb (quadriceps) samples from three distinct (lanes 1–3) Chkb+/+, four distinct (lanes 4–7) Chkb+/ and three distinct (lanes 8–10) Chkb/ mice probed with anti-Para, anti- Pparb, anti-Pparg, anti-Cpt1b, and anti-Gapdh antibodies. Bottom: densitometry of the western blot data shows the ratio of Ppara, Pparb, Pparg, and Cpt1b to Gapdh. Values are means ± SD. For A, n = 3 (Chkb+/+), n = 3 (Chkb+/−) and n = 3 (Chkb−/−) mice per group. For B, n = 3 (Chkb+/+), n = 4 (Chkb+/−) and n = 3 (Chkb−/−) mice per group. For A one-way ANOVA with Tukey’s multiple comparison test, p < 0.0001 (Ppara), p < 0.0001 (Pparb), p = 0.0087 (Pparg). *p < 0.05, **p < 0.01. For (B) one-way ANOVA with Tukey’s multiple comparison test, p = 0.0166 (Ppara), p = 0.0014 (Pparb), p = 0.0010 (Pparg), p = 0.00018 (Cpt1b). *P < 0.05, **p < 0.01. C Fold-Change (2^ (- Delta Delta CT)) is the normalized gene expression (2^(- Delta CT)) in the Chkb deficient hindlimb sample divided the normalized gene expression (2^ (- Delta CT)) in the control sample. Fold-change values greater than one indicates a positive- or an up-regulation. Fold-change values less than one indicate a negative or down-regulation, and the fold-regulation is the negative inverse of the fold-change. The p values are calculated based on a two-sided student’s t-test of the replicate 2^ (- Delta CT) values for each gene in the Chkb+/+ group and Chkb/ groups. *p < 0.05, **p < 0.01. n = 3 independent samples per group. D The clustergram of the Ppar family, Rxr family and Ppar coactivators across three genotypes. E Fold-Change (2^ (- Delta Delta CT)) is the normalized gene expression (2^(- Delta CT)) in the Chkb deficient hindlimb sample divided the normalized gene expression (2^ (- Delta CT)) in the control sample. Fold-change values greater than one indicates a positive- or an up-regulation. Fold-change values less than one indicate a negative or down-regulation, and the fold-regulation is the negative inverse of the fold-change. The p values are calculated based on two-sided student’s t-test of the replicate 2^ (- Delta CT) values for each gene in the Chkb+/+ group and Chkb/ groups. *p < 0.05, **p < 0.01. n = 3 independent samples per group. F The clustergram of the Ppar family, Rxr family and Ppar coactivators across three genotypes. Average arithmetic means of the expression of 4 housekeeping genes (Actb, B2m, Gusb and Hsp90ab1) were used to normalize the expression of all the studied genes. Source data are provided as a Source Data file.
Fig. 5
Fig. 5. Chkb deficiency results in decreased fatty acid usage and increased lipid droplet accumulation in differentiated myocytes in culture.
A Representative image of isolated skeletal myoblasts from Chkb+/+ and Chkb/ mice, cultured on Matrigel® coated culture flasks. At day 0, when the cells reached 80% confluency, the medium was replaced by differentiation medium and maintained in differentiation media for up to 8 days. B Western blot of differentiated Chkb+/+ and Chkb/ myocytes probed with anti-Chka, anti-Chkb, and anti-Gapdh antibodies. For A and B, Each experiment was repeated independently 3 times with similar results. C RT-qPCR analysis of gene expression in isolated myocytes from Chkb+/+ and Chkb/ mice at day 5 of differentiation. Values are means ± SEM; n = 3 independent experiments. Two-sided student’s t-test, p = 0.0200 (Chka), p = 0.0095 (Icam1), p = 0.01944 (Tgfb1). *p < 0.05, **p < 0.01. D Formaldehyde fixed and immunostained myotubes were categorized into three groups (1 to 3 nuclei, 4 to 10 nuclei, and >10 nuclei per myotube). The number of multinuclear myotubes in the two groups and the distribution of nuclei were calculated to compare differentiation in primary Chkb+/+ and Chkb/ myocytes. For D values are means ± SEM. n = 5 random images from 3 independent experiments for each group. Two-sided student’s t-test did not result in p values less than 0.05. Representative traces of oxygen consumption rates (OCRs) of primary Chkb+/+ and Chkb/ myocytes at day 4 (E, F) and day 8 (G, H) of differentiation driven with glucose/glutamine/pyruvate or palmitate as stated. Bovine serum albumin (BSA) alone was used as control for palmitate-BSA complex driven OCRs. Oligomycin(O), FCCP(F), rotenone (R) and antimycin A (AA) were sequentially injected to assess mitochondrial respiratory states. Data are mean ± SD. For E, n = 5 (Chkb+/+) and n = 5 (Chkb/) wells per group. For (F), n = 5 (BSA Chkb+/+), n = 5 (BSA Chkb/), n = 5 (Palmitate-BSA Chkb+/+), n = 5 (Palmitate-BSA Chkb/). For G, n = 10 (Chkb+/+) and n = 8 (Chkb/) wells per group. For (H), n = 4 (BSA Chkb+/+), n = 4 (BSA Chkb/), n = 4 (Palmitate-BSA Chkb+/+), n = 4 (Palmitate-BSA Chkb/). For EH Two-sided student’s t-test. For E, during maximal respiration, p = 0.0062, p = 0.0021, p = 0.00187. For F, during maximal respiration, p = 0.0857, p = 0.0421, p = 0.0526. For G, during maximal respiration, p = 0.1242, p = 0.1139, p = 0.0713. For H, during maximal respiration, p = 0.01231, p = 0.0072, p = 0.0038. *p < 0.05. I Isolated primary myocytes from Chkb+/+ and Chkb/ mice were fixed 5 days after differentiation and stained with BODIPY-493/503 to visualize LDs (green). DAPI was used to stain nucleus (blue). J The corrected total cell fluorescence intensity of lipid droplets was significantly enhanced in Chkb/ myotubes. Box plots in J show median, quartiles (boxes), and range (whiskers). For J, n = 16 (Chkb+/+) and n = 15 (Chkb/) myotubes. For J Two-sided student’s t-test. For J, p = 0.0463. *p < 0.05. I and J are representative of 3 independent experiments with similar results. Source data are provided as a Source Data file.
Fig. 6
Fig. 6. Ppar activation rescues defective fatty acid utilization and normalizes the choline and phosphocholine levels in differentiated Chkb−/− myocytes in culture.
A Representative kinetic graph of the fatty acid oxidation of primary Chkb−/− myocytes at day 7 of differentiation. The cells were treated with or without ciprofibrate (50 μM), bezafibrate (500 μM) or fenofibrate (25 μM) in the medium 72 h prior to measurement. Values are means ± SEM; n = 4 for each group. Each experiment was repeated independently 3 times with similar results. Quantification of basal respiration and maximal respiration which quantifies maximal electron transport activity induced by the chemical uncoupler FCCP. Values are means ± SEM; For B, n = 12 (Chkb+/+), n = 12 (Chkb−/−), n = 12 (Chkb−/− Bezafibrate), n = 12 (Chkb−/− Fenofibrate), n = 12 (Chkb−/− Cipofibrate) wells per group. One-way ANOVA with Tukey’s multiple comparison test, p < 0.0001. ##p < 0.01 vs Chkb+/+ group. For C n= 9 (Chkb+/+), n = 9 (Chkb−/−), n = 12 (Chkb−/− Bezafibrate), n = 12 (Chkb−/− Fenofibrate) and n = 12 (Chkb−/− Cipofibrate). One-way ANOVA with Tukey’s multiple comparison test, p < 0.0001. *p < 0.05, **p < 0.01, #p < 0.05 vs Chkb+/+ group, ##p < 0.01 vs Chkb+/+ group. D Representative kinetic graph of the fatty acid oxidation of primary Chkb−/− myocytes at day 7 of differentiation. The cells were treated with or without specific pparb/d agonist GW501516 (2.5 μM) in the medium 72 h prior to measurement. Values are means ± SEM; For D, n = 4 (Chkb+/+), n = 5 (Chkb−/−) and n = 4 (Chkb−/− GW501516) wells per group. Each experiment was repeated independently 3 times with similar results. E, F Quantification of basal respiration and maximal respiration which quantifies maximal electron transport activity induced by the chemical uncoupler FCCP. Values are means ± SEM; For E, n = 12 (Chkb+/+), n = 15 (Chkb−/−), n = 12 (Chkb−/− GW501516). One-way ANOVA with Tukey’s multiple comparison test, p < 0.0001. **p < 0.01, ##p < 0.05 vs Chkb+/+ group. RT-qPCR analysis of Chka gene expression in differentiated Chkb+/+, Chkb−/− and Chkb−/− myocytes treated with or without Ciprofibrate 50 (μM) (G), GW501516 (2.5 μM) (H) or bezafibrate (500 μM) (I) in the medium for 48 h on day 4 of differentiation with or without choline (1 mM) supplementation. For GI, n = 3 independent samples per group. One-way ANOVA with Tukey’s multiple comparison test, p < 0.0001. **P < 0.01. JL Targeted metabolomic profiling of Chkb+/+, Chkb−/− and Chkb−/− myocytes treated with bezafibrate (500 μM) for 48 h on day 4 of differentiation with or without choline (1 mM) supplementation. Ppar activation increases phosphocholine (p-Choline) level (K) and normalizes acylcarnitine (AcCa) level (L) in differentiated Chkb−/− myocytes. Values are means ± SEM. For J and K, n = 6 samples for each group. One-way ANOVA with Tukey’s multiple comparison test. p < 0. 0001. Each experiment was repeated independently 3 times with similar results. For L, n = 15 AcCa species from 3 independent samples for each group. One-way ANOVA with Tukey’s multiple comparison test. P < 0. 0001. Each experiment was repeated independently 3 times with similar results. *p < 0.05 and **p < 0.01. Source data are provided as a Source Data file.
Fig. 7
Fig. 7. Ppar activation normalizes lipid droplet accumulation and decrease injury in differentiated Chkb−/− myocytes in culture.
A To study the effect of Ppar agonist treatments on exogenous fatty acid utilization and storage, 4 days after differentiation, myocytes were treated with or without bezafibrate (500 μM) or GW501516 (2.5 μM) in the medium for 48 h. On day 6 of differentiation the medium with or without drugs was supplemented with Oleate-BSA (400 μM) overnight. On day 7 of differentiation cells were labeled with mitotracker® Red CMXRos (50 nM) for 30 min, washed with PBS, fixed and stained with BODIPY-493/503 to visualize LDs (Green). DAPI was used to stain nucleus (Blue). The images are representative of 3 independent experiments with similar results. Scale bar = 50 μm. B Summary of fold change and statistical tests performed on DG and TG. n = 3 independent samples per group. Pairwise Wilcoxon signed rank test with Bonferroni correction was used to determine the significance of a median pair-wise fold-increase in lipid amounts at an overall significance level of 5%. All statistical tests were two-sided. As the Bonferroni correction is fairly conservative, significant differences are reported at both pre-correction (*) and post-correction (***) significance levels. TG, triacylglycerol; DG, diacylglycerol. p = 0.0069 (DG) and p = 0.0007(TG). C RT-qPCR analysis of Icam1 gene expression in differentiated Chkb++ myocyte and Chkb/ myocytes treated with ciprofibrate (50 μM), bezafibrate (500 μM) or GW501516 (2.5 μM) in the presence of 1 mM choline for 48 h on day 4 of differentiation. Values are means ± SD; n = 3 independent experiments. One-way ANOVA with Tukey’s multiple comparison test; p < 0.0001. #p < 0.01 (Chkb++) vs all the other groups. **p < 0.01. Source data are provided as a Source Data file.
Fig. 8
Fig. 8. Defective fatty acid utilization and lipid metabolism in Chkb−/− hindlimb muscle.
In muscles from Chkb+/+ mice there is a balance between storage of fatty acid as triacylglycerol (TG) and usage of fatty acids either as an energy source by mitochondria β-oxidation or membrane phospholipid synthesis. In hindlimb muscles from Chkb/ mice, an inability to consume DG for PC synthesis results in an imbalance between storage and usage of fatty acids. Although the cells are able to increase PC uptake from plasma to compensate for defective PC synthesis, this genetic defect in PC synthesis drives large fluctuations in lipid metabolism. At an early stage of Chkb mediated muscular dystrophy (Phase 1), there is a 12- to 15-fold increase in the levels of the mitochondrial specific lipids CL and AcCa; the large increase in CL reflects the increase in mitochondrial size at this stage of the disease. The increase in AcCa level is likely due to the inability to consume DG for PC synthesis, resulting in an accumulation of its precursor-fatty acid which the cell attempts to consume via mitochondria β-oxidation, however there is a concomitant decrease in Ppar mediated expression of genes required for fatty acid conversion to AcCa for its import into mitochondria and consumption by β-oxidation. As the disease progresses (Phase 2), CL level returns to wild type (probably as a result of damaged mitochondrial inner membrane), and a 12-fold increase in the storage lipid TG occurs due to an inability consume AcCa and the shunting of fatty acids into storage lipid droplets.

References

    1. Ishidate K. Choline/ethanolamine kinase from mammalian tissues. Biochim Biophys. Acta. 1997;1348:70–78. - PubMed
    1. Aoyama C, Liao H, Ishidate K. Structure and function of choline kinase isoforms in mammalian cells. Prog. Lipid Res. 2004;43:266–281. - PubMed
    1. Wu G, Aoyama C, Young SG, Vance DE. Early embryonic lethality caused by disruption of the gene for choline kinase alpha, the first enzyme in phosphatidylcholine biosynthesis. J. Biol. Chem. 2008;283:1456–1462. - PMC - PubMed
    1. Bansal D, et al. Defective membrane repair in dysferlin-deficient muscular dystrophy. Nature. 2003;423:168–172. - PubMed
    1. Sher RB, et al. A rostrocaudal muscular dystrophy caused by a defect in choline kinase beta, the first enzyme in phosphatidylcholine biosynthesis. J. Biol. Chem. 2006;281:4938–4948. - PubMed

Publication types

Grants and funding