. 2022 Mar 23;12(1):5036.
doi: 10.1038/s41598-022-08844-3.

Proteasomal turnover of the RhoGAP tumor suppressor DLC1 is regulated by HECTD1 and USP7

Affiliations

Proteasomal turnover of the RhoGAP tumor suppressor DLC1 is regulated by HECTD1 and USP7

Yannick Frey et al. Sci Rep. .

Abstract

The Rho GTPase activating protein Deleted in Liver Cancer 1 (DLC1) is frequently downregulated through genetic and epigenetic mechanisms in various malignancies, leading to aberrant Rho GTPase signaling and thus facilitating cancer progression. Here we show that in breast cancer cells, dysregulation of DLC1 expression occurs at the protein level through rapid degradation via the ubiquitin-proteasome system. Using mass spectrometry, we identify two novel DLC1 interaction partners, the ubiquitin-ligase HECTD1 and the deubiquitinating enzyme ubiquitin-specific-processing protease 7 (USP7). While DLC1 protein expression was rapidly downregulated upon pharmacological inhibition of USP7, siRNA-mediated knockdown of HECTD1 increased DLC1 protein levels and impaired its degradation. Immunofluorescence microscopy analyses revealed that the modulation of HECTD1 levels and USP7 activity altered DLC1 abundance at focal adhesions, its primary site of action. Thus, we propose opposing regulatory mechanisms of DLC1 protein homeostasis by USP7 and HECTD1, which could open up strategies to counteract downregulation and restore DLC1 expression in cancer.


Conflict of interest statement

The authors declare no competing interests.

Figures

Figure 1
Figure 1
DLC1 undergoes rapid proteasomal degradation in breast cancer cells. (A) Lysates of the indicated breast cancer cell lines from different subgroups (luminal A (LA), luminal B (LB), HER2 positive (HER2 +), triple negative A (TNA), triple negative B (TNB)) were analyzed by immunoblotting with the indicated antibodies. (B) Cells were treated with MG-132 (10 µM) or bortezomib (BTZ, 100 ng/ml) as indicated and the lysates were analyzed by immunoblotting with the indicated antibodies. Control sample was treated with DMSO for 6 h. Western blots from three independent experiments were analyzed with ImageJ, the fold change in DLC1 expression was determined by normalizing the DLC1/α-tubulin ratio to that of control sample and is presented as mean ± s.d. Cropped blots shown from different cell lines are derived from separate blots. (C) Cells were treated with PR-619 (20 µM) as indicated and the lysates were analyzed by immunoblotting with the indicated antibodies. The control sample was treated with DMSO for 6 h. Western blots from three independent experiments were analyzed with ImageJ, the fold change in DLC1 expression was determined by normalizing the DLC1/GAPDH ratio to that of control sample and is presented as mean ± s.d. Cropped blots shown from different cell lines are derived from separate blots. (D) MCF7 cells were treated with cycloheximide (CHX, 60 µg/ml) and lysates were analyzed by immunoblotting with the indicated antibodies. Western blots from three independent experiments were analyzed with ImageJ, the fold change in protein expression was determined by normalizing the signal to GAPDH and to the control sample and is presented as mean ± s.d. (A, B, C, D) All western blots shown are representative of three independent experiments. Full-length western blots are provided as Supplementary Information.
Figure 2
Figure 2
HECTD1 and USP7 are novel regulators of DLC1 stability. (A, B, C) HEK293T cells were transiently transfected with vectors encoding the indicated constructs or FLAG empty vector (−). (A) The next day, cells were lysed and immunoprecipitation with an anti-FLAG antibody was performed. Cell lysates (WCL) and precipitates were analyzed by immunoblotting using the indicated antibodies. Cropped blots showing co-immunoprecipitation signals are derived from blots with different exposure compared to WCL. (B, C) The next day, cells were lysed and immunoprecipitation with an anti-GFP-nanobody was performed. Cell lysates (WCL) and precipitates were analyzed by immunoblotting using the indicated antibodies. Cropped blots showing co-immunoprecipitation signals are derived from blots with different exposure compared to WCL. (D) MCF7 cells were treated with P5091 (20 µM) or HBX 41108 (10 µM) as indicated and lysates were analyzed by immunoblotting with the indicated antibodies. The control sample was treated with DMSO for 6 h. Western blots from three independent experiments were analyzed with ImageJ, the fold change in DLC1 expression was determined by normalizing the DLC1/GAPDH ratio to that of control sample and is presented as mean ± s.d. (E) Cells were transfected with control siRNA or two independent siRNAs targeting HECTD1. 72 h post transfection cells were lysed and lysates were analyzed by immunoblotting with the indicated antibodies. Cropped blots shown from different cell lines are derived from separate blots. Western blots from three independent experiments were analyzed with ImageJ, the fold change in DLC1 expression was determined by normalizing the DLC1/GAPDH ratio to that of control sample and is presented as mean ± s.d. (F) MCF7 cells were transfected with control siRNA or two siRNAs targeting HECTD1. 72 h post transfection cells were treated with cycloheximide (CHX, 60 µg/ml) as indicated and lysates were analyzed by immunoblotting with the indicated antibodies. (G) Quantification of protein levels from (F) by ImageJ. n = 4, error bars represent mean ± s.d. (A, B, C, D, E, F) Full-length western blots are provided as Supplementary Information.
Figure 3
Figure 3
HECTD1 and USP7 regulate DLC1 ubiquitination. (A) HEK293T cells were transiently transfected with vectors encoding the indicated constructs. The next day, cells were treated with the proteasome inhibitor MG-132 (10 µM) before lysis. Lysates were subjected to pulldown with Ni–NTA-agarose. Pulldowns and lysates were analyzed by immunoblotting with the indicated antibodies. (B) MCF7 cells were transiently transfected with vectors encoding the indicated constructs. The next day, cells were treated with MG-132 (10 µM), P5091 (20 µM) as indicated or DMSO as a control for 6 h before lysis. Lysates were subjected to pulldown with Ni–NTA-agarose. Pulldowns and lysates were analyzed by immunoblotting with the indicated antibodies. (A, B) Western blots from three independent experiments were analyzed with ImageJ, the fold change in ubiquitinated GFP-DLC1 species was determined by normalizing their signal intensity to that of control sample, and is presented as mean ± s.d. Full-length western blots are provided as Supplementary Information.
Figure 4
Figure 4
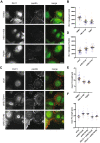
HECTD1 and USP7 regulate DLC1 levels at focal adhesions. (A) MCF7 cells were transfected with the indicated siRNAs, seeded on collagen-coated glass coverslips and fixed 72 h later. (C) MCF7 cells were seeded on collagen-coated glass coverslips. The next day, cells were treated with P5091 (20 µM), HBX 41108 (10 µM) or DMSO as a control for 6 h before fixation. (A,C) Fixed cells were stained with DLC1- and paxillin-specific primary antibodies, followed by AlexaFluor488 (green)-coupled and AlexaFluor546 (red)-coupled secondary antibodies, respectively. Images show a single basal section, scale bar: 20 µm. (B, D) The mean intensity of the DLC1 signal at focal adhesions over the whole image was quantified using ImageJ. N = 36 images, n = 3. Statistical comparison of means by RM-ANOVA with Dunnett’s multiple comparison test: (B) DMSO vs. HBX41108: p = 0.0252; DMSO vs. P5091: p = 0.0178. (D) siCtrl vs. siHECTD1#1: p = 0.0171; siCtrl vs. siHECTD1#2: p = 0.0029. (E) Mean focal adhesion length per cell in samples from (A) was analyzed using ImageJ. N = 36, 31, 30; n = 3. Statistical comparison of means by RM-ANOVA with Dunnett’s multiple comparison test: DMSO vs. HBX 41108: p = 0.0064; DMSO vs. P5091: p = 0.0036. (F) MCF7 cells were transfected with the indicated siRNAs. After 2 days, cells were seeded on collagen-coated glass coverslips and fixed 16 h later. Cells were stained with paxillin-specific primary antibody followed by AlexaFluor488-coupled secondary antibody. Mean focal adhesion length per cell was analyzed using ImageJ. N = 40, 36, 29, 35, 30; n = 3. Statistical comparison of means by 1-way ANOVA with Bonferroni’s multiple comparison test: siCtrl vs siHECTD1#1: p = 0.0017; siCtrl vs. siHECTD1#2: p = 0.002; siHECTD1#1 vs. siDLC1 + siHECTD1#1: p = 0.0007; siHECTD1#2 vs. siDLC1 + siHECTD1#2: p = 0.0056.

Similar articles

Cited by

References

    1. Bos JL, Rehmann H, Wittinghofer A. GEFs and GAPs: critical elements in the control of small G proteins. Cell. 2007;129:865–877. - PubMed
    1. Rossman KL, Der CJ, Sondek J. GEF means go: turning on Rho GTPases with guanine nucleotide-exchange factors. Nat. Rev. Mol. Cell Biol. 2005;6:167–180. - PubMed
    1. Porter AP, Papaioannou A, Malliri A. Deregulation of Rho GTPases in cancer. Small GTPases. 2016;7:123–138. - PMC - PubMed
    1. Hodge RG, Ridley AJ. Regulating Rho GTPases and their regulators. Nat. Rev. Mol. Cell Biol. 2016;17:496–510. - PubMed
    1. Wang D, Qian X, Rajaram M, Durkin ME, Lowy DR. DLC1 is the principal biologically-relevant down-regulated DLC family member in several cancers. Oncotarget. 2016;7:45144–45157. - PMC - PubMed

Publication types