. 2022 Mar 23;12(1):4943.
doi: 10.1038/s41598-022-08946-y.

The monoacylglycerol acyltransferase pathway contributes to triacylglycerol synthesis in HepG2 cells

Affiliations

The monoacylglycerol acyltransferase pathway contributes to triacylglycerol synthesis in HepG2 cells

Pamela J McFie et al. Sci Rep. .

Abstract

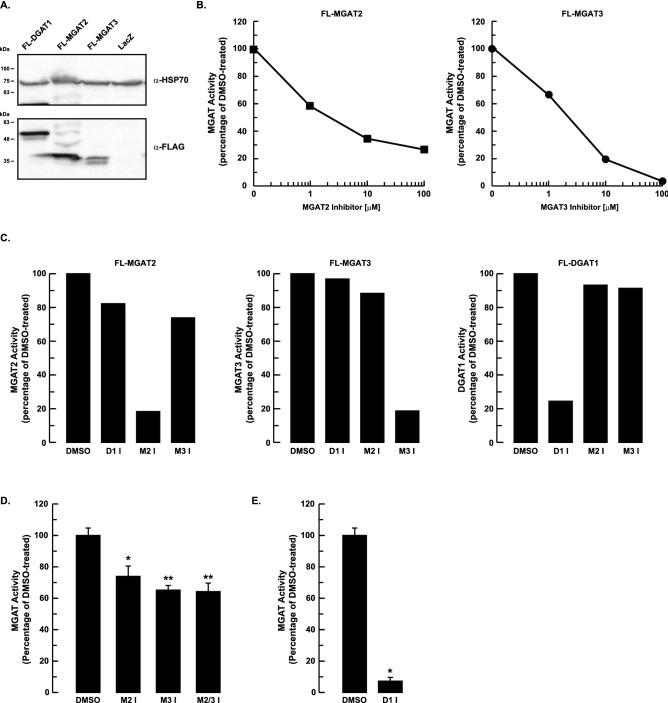
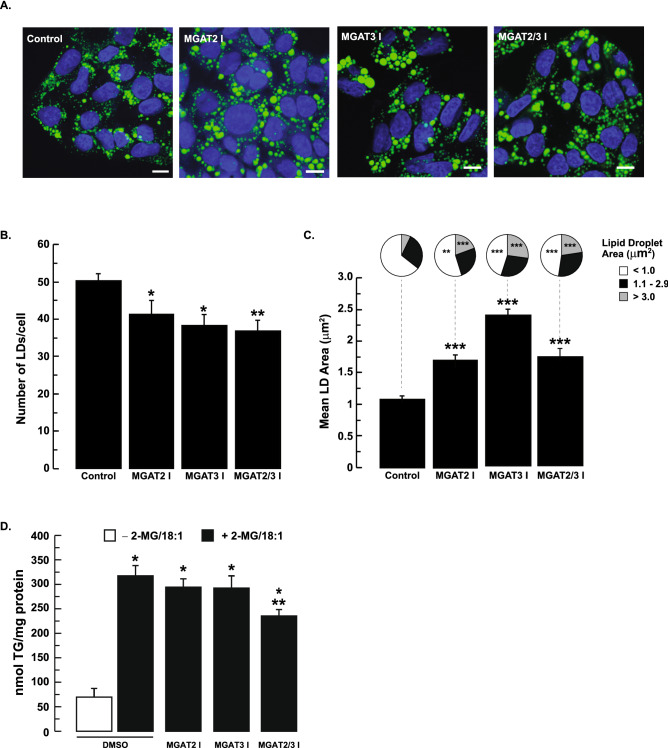
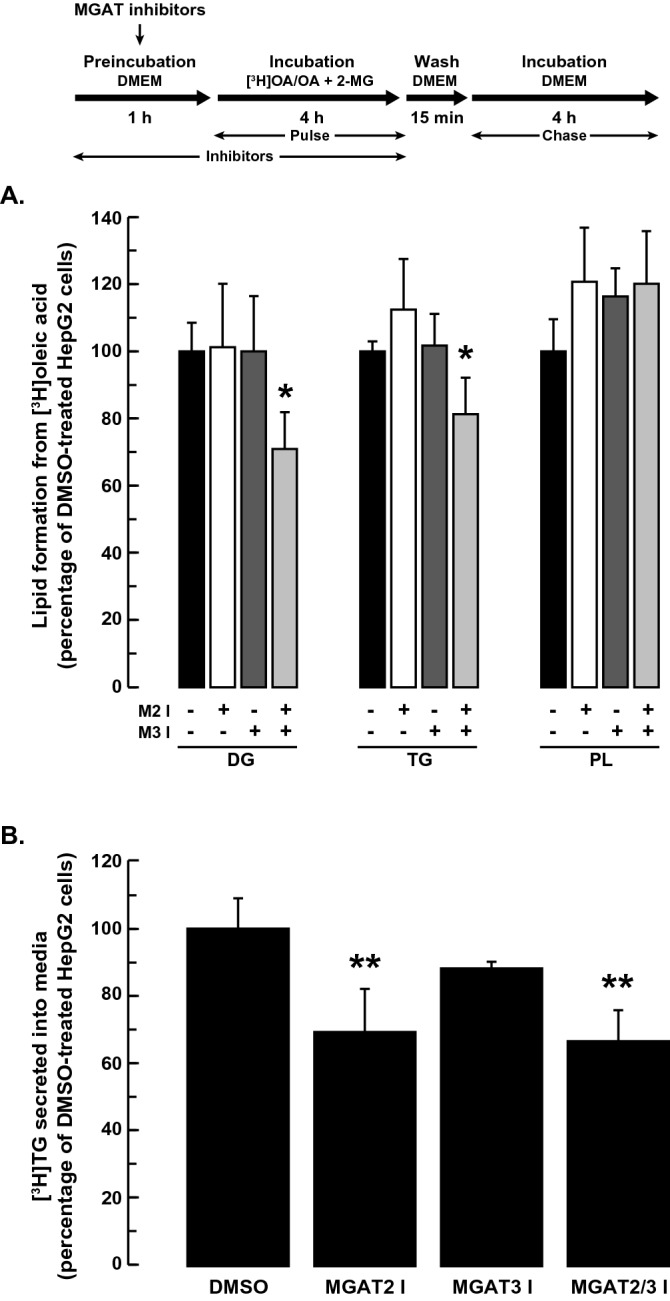
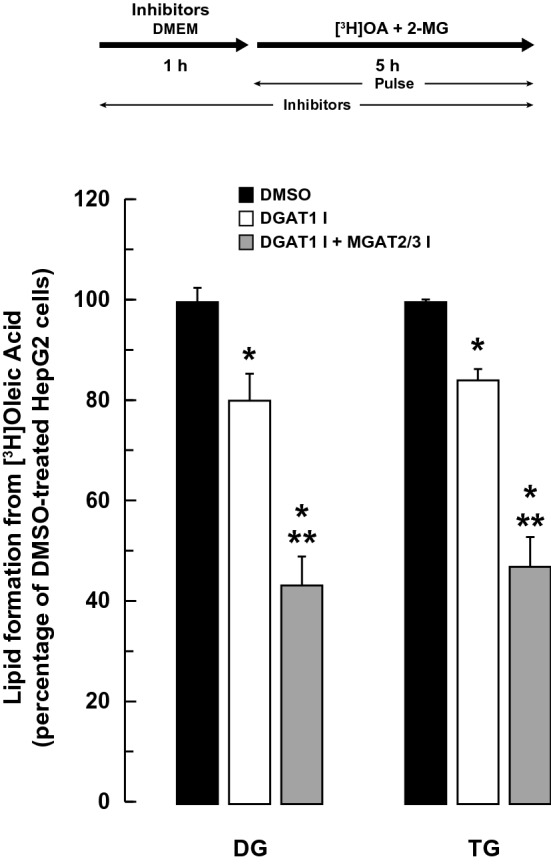
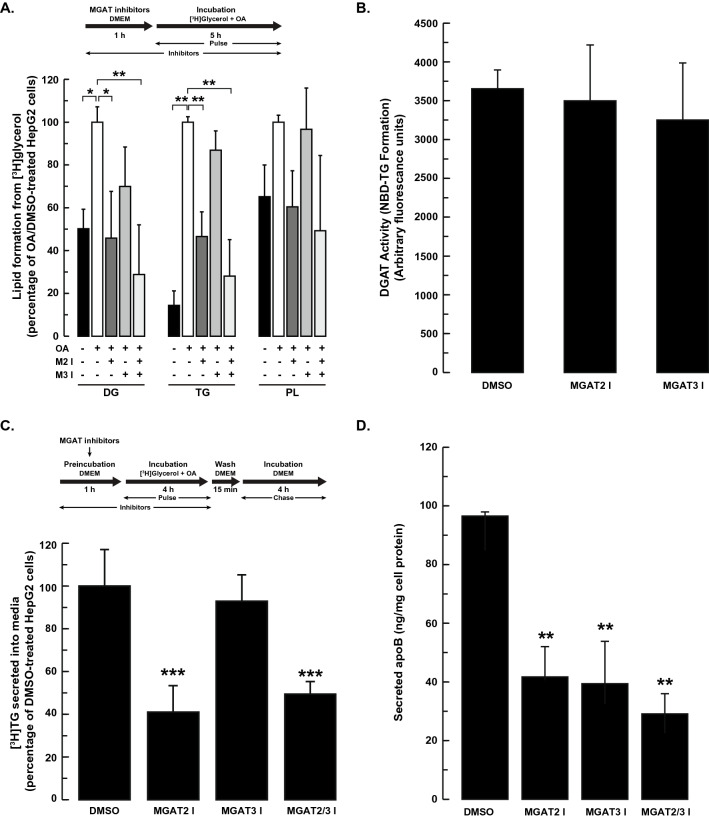
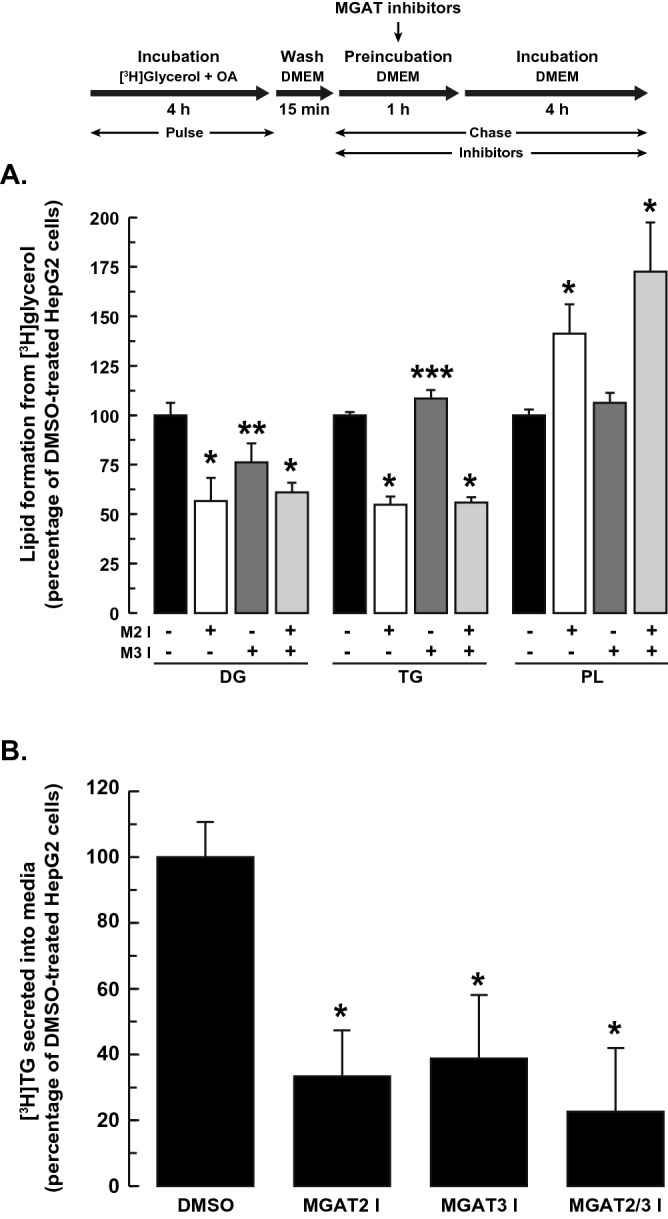
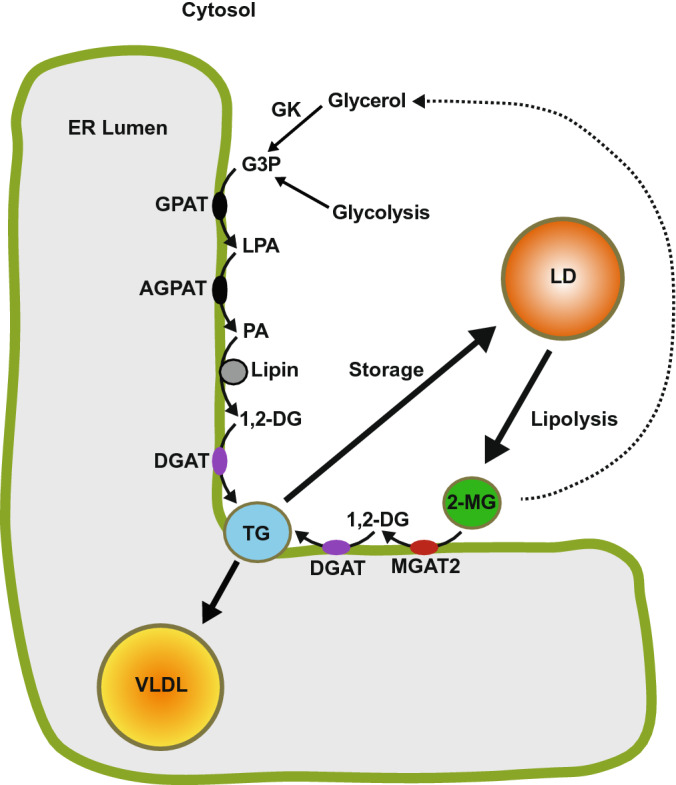
The monoacylglycerol acyltransferase (MGAT) pathway has a well-established role in the small intestine where it facilitates the absorption of dietary fat. In enterocytes, MGAT participates in the resynthesis of triacylglycerol using substrates (monoacylglycerol and fatty acids) generated in the gut lumen from the breakdown of triacylglycerol consumed in the diet. MGAT activity is also present in the liver, but its role in triacylglycerol metabolism in this tissue remains unclear. The predominant MGAT isoforms present in human liver appear to be MGAT2 and MGAT3. The objective of this study was to use selective small molecule inhibitors of MGAT2 and MGAT3 to determine the contributions of these enzymes to triacylglycerol production in liver cells. We found that pharmacological inhibition of either enzyme had no effect on TG mass in HepG2 cells but did alter lipid droplet size and number. Inhibition of MGAT2 did result in decreased DG and TG synthesis and TG secretion. Interestingly, MGAT2 preferentially utilized 2-monoacylglycerol derived from free glycerol and not from exogenously added 2-monoacylglycerol. In contrast, inhibition of MGAT3 had very little effect on TG metabolism in HepG2 cells. Additionally, we demonstrated that the MGAT activity of DGAT1 only makes a minor contribution to TG synthesis in intact HepG2 cells. Our data demonstrated that the MGAT pathway has a role in hepatic lipid metabolism with MGAT2, more so than MGAT3, contributing to TG synthesis and secretion.


Conflict of interest statement

The authors declare no competing interests.

Figures

Figure 1
Figure 1
Pharmacological inhibition of MGAT2, MGAT3 and DGAT1. (A) Overexpression of FL-MGAT2, FL-MGAT3 and FL-DGAT1 in HEK-293T cells. Crude mitochondrial membrane fractions isolated from HEK-293T cells expressing FL-MGAT2, FL-MGAT3 or FL-DGAT1 were separated by SDS-PAGE and immunoblotted with anti-FLAG (α-FLAG) and anti-mitochondrial HSP70 (α-HSP70) antibodies. An uncropped image is shown in Supplementary Fig. 1. (B) The samples described in (A) were preincubated for 30 min with either the MGAT2 or MGAT3 inhibitors at the indicated concentrations. MGAT activity was determined and compared to control (DMSO-treated) samples. (C) Crude mitochondrial membrane fractions from HEK-293T cells expressing FL-MGAT2, FL-MGAT3 or FL-DGAT1 were preincubated for 30 min with either 25 µM MGAT2, 50 µM MGAT3 or 5 µM DGAT1 inhibitors. MGAT activity was determined and compared to control (DMSO-treated) samples. (D) Crude mitochondrial membrane fractions from HepG2 cells were pre-incubated with the MGAT inhibitors (10 µM) as described in Fig. 1C, separately or together. MGAT activity was determined and was normalized to control (DMSO-treated) cells. *p < 0.01 and **p < 0.001 versus DMSO-treated cells. (E) Inhibition of DGAT1 reduces MGAT activity in HepG2 cells. Crude mitochondrial membranes from HepG2 cells were pre-incubated with the DGAT1 inhibitor (2 µM final concentration) for 1 h. MGAT activity was determined and was normalized to control (DMSO-treated) samples. *p < 0.0001 versus DMSO-treated cells (unpaired two-tailed Student’s t test). D1 I, DGAT1 inhibitor; M2 I, MGAT2 inhibitor; M3 I, MGAT3 inhibitor; M2/3 I, MGAT2 and MGAT3 inhibitors.
Figure 2
Figure 2
Inhibition of MGAT2 or MGAT3 alters lipid droplet morphology. (A) HepG2 cells were pre-incubated with 50 µM MGAT2 inhibitor or 100 µM MGAT3 inhibitor or both together for 2 h. Cells were then incubated with 0.5 mM oleic acid and 0.2 mM 2-MG for 12 h in the presence of the MGAT inhibitors. Cells were fixed and stained with Bodipy 493/503 and DAPI to visualize lipid droplets and nuclei, respectively. Scale bars, 10 µm. Lipid droplet number (B) and area (C) were quantified using ImageJ (National Institutes of Health, rsb.info.nih.gov/ij). Mean lipid droplet area per cell and lipid droplet number were calculated from 20 to 29 cells. Data are shown as means ± standard error. Size distribution of individual lipid droplets are shown as pie charts. Means were compared by ANOVA followed by Bonferroni Multiple Comparisons Test. *p < 0.05 versus DMSO-treated cells; **p < 0.01 versus DMSO-treated cells; ***p < 0.001 untreated versus DMSO-treated cells. (D) Intracellular TG levels in HepG2 cells are modestly reduced only when both MGAT2 and MGAT3 are inhibited. HepG2 cells were pre-incubated with the MGAT inhibitors or DMSO for 1 h. This was followed by incubating HepG2 cells with 0.2 mM 2-MG and 0.25 mM oleic acid (OA) in the presence of the MGAT inhibitors for 12 h. Cell extracts were prepared, and an aliquot was used for TG determination. *p < 0.001 versus DMSO-treated cells (without 2-MG/OA); **p < 0.001 versus DMSO-treated cells (with 2-MG/OA).
Figure 3
Figure 3
Effect of MGAT inhibition on lipid production from exogenous 2-MG and oleic acid. HepG2 cells were pre-incubated with or without the MGAT2 inhibitor (25 µM), MGAT3 inhibitor (50 µM) or both inhibitors together. After 1 h, 5 µCi [3H]OA, cold OA (0.25 mM final concentration) and 2-MG (0.2 mM final concentration) were added to the culture media and cells were incubated for a further 4 h. Cells were then washed and incubated an additional 4 h in DMEM. The incorporation of radioactivity into (A) TG, DG and PL in cells and (B) TG in media, was then determined. Values for DMSO-treated controls: DG (18.1 × 103 dpm/mg cell protein), TG (332 × 103 dpm/mg cell protein), PL (137 × 103 dpm/mg cell protein), secreted TG (3.3 × 103 dpm/mg cell protein). *p < 0.05 versus DMSO-treated cells; **p < 0.001 versus DMSO-treated cells.
Figure 4
Figure 4
Effect of DGAT1 inhibition on lipid production from exogenous 2-MG and oleic acid. HepG2 cells were pre-incubated with or without the DGAT1 inhibitor (5 µM) or the DGAT1, MGAT2 (25 µM) and MGAT3 (50 µM) inhibitors together. After 1 h, 5 µCi [3H]OA, cold OA (0.25 mM final concentration) and 2-MG (0.2 mM final concentration) were added to the culture media and cells were incubated for a further 5 h. The incorporation of radioactivity into TG and DG in cells was then determined. Values for DMSO-treated controls: DG (22.3 × 103 dpm/mg cell protein), TG (421 × 103 dpm/mg cell protein). *p < 0.001 versus DMSO-treated cells; **p < 0.001 DGAT1 inhibitor versus DGAT1, MGAT2 and MGAT3 inhibitors together.
Figure 5
Figure 5
Inhibition of MGAT2, but not MGAT3, reduced DG and TG synthesis and TG secretion. (A) HepG2 cells were pre-incubated for 1 h with or without the MGAT2, MGAT3 or both inhibitors. Cells were then incubated with 5 µCi [3H]glycerol and 0.25 mM OA. After 5 h, cells were harvested and the incorporation of radioactivity into TG, DG and phospholipids was determined. (B) HepG2 cells were incubated with the MGAT2 (25 µM) or MGAT3 (50 µM) inhibitors for 5 h. Cells were harvested and DGAT activity in crude mitochondrial fractions was determined. Data are the mean ± standard deviation of two experiments performed in duplicate. (C) HepG2 cells were incubated with DMEM in the presence or absence of the MGAT2 or MGAT3 inhibitors (separately and together). After 1 h, cells were incubated with 5 µCi [3H]glycerol and 0.25 mM oleic acid for 4 h. Cells were then washed and incubated an additional 4 h in DMEM. The amount of [3H]TG secreted into the media was determined. Data are the mean ± standard deviation of two experiments performed in duplicate. Values for DMSO-treated controls: DG (1.9 × 103 dpm/mg cell protein), TG (11.2 × 103 dpm/mg cell protein), PL (30.2 × 103 dpm/mg cell protein), secreted TG (0.89 × 103 dpm/mg cell protein). (D) Effect of MGAT inhibition on apoB secretion. ApoB in the culture media was quantified by ELISA after incubation of HepG2 cells with 0.25 mM OA for 6 h in the presence of the MGAT inhibitors, as described in A. Data are the mean ± standard deviation of three independent experiments. *p < 0.01; **p < 0.001, ***p < 0.05.
Figure 6
Figure 6
MGAT2 contributes to TG re-esterification. HepG2 cells were incubated with DMEM containing 5 µCi [3H]glycerol and 0.25 mM oleic acid for 4 h. The radioactivity was washed away, and cells were then incubated with the MGAT inhibitors, separately or together. After 1 h, the media was replaced with fresh DMEM (containing MGAT inhibitors) and incubated for another 4 h. The incorporation of radioactivity into (A) intracellular lipids (TG, DG and PL) and (B) secreted TG was then determined. Values for DMSO-treated controls: DG (3.6 × 103 dpm/mg cell protein), TG (82.0 × 103 dpm/mg cell protein), PL (57.2 × 103 dpm/mg cell protein), secreted TG (0.90 × 103 dpm/mg cell protein). *p < 0.001 versus DMSO-treated cells; **p < 0.01 versus DMSO-treated cells; ***p < 0.05 versus DMSO-treated cells.
Figure 7
Figure 7
MGAT2 has a role in the lipolysis/re-esterification of stored TG in hepatocytes. TG synthesis at the endoplasmic reticulum begins with glycerol 3-phosphate (G3P) from glycolysis or by the phosphorylation of glycerol by glycerol kinase (GK). G3P undergoes two successive acylation reactions first producing 1-acylglycerol 3-phosphate (LPA) and then phosphatidate (PA) which is dephosphorylated to 1,2-diacylglycerol (1,2-DG). DGAT catalyzes a third esterification reaction producing TG that is stored in cytosolic lipid droplets (LDs) and can subsequently be used for VLDL assembly. VLDL acquire their TG via the lipolysis/reesterification of preformed TG stored in LDs. Lipases hydrolyze LD TG generating 2-monoacylglycerol (2-MG). Monoacylglycerol acyltransferase-2 (MGAT2) uses this 2-MG as a substrate producing 1,2-DG and subsequently TG, which is utilized for VLDL assembly at the ER. Some glycerol is also likely generated from the complete hydrolysis of TG, which can re-enter the glycerol 3-phosphate pathway. GPAT, glycerol 3-phosphate acyltransferase; AGPAT, 1-acylglycerophosphate acyltransferase.

Similar articles

Cited by

References

    1. Kawano Y, Cohen DE. Mechanisms of hepatic triglyceride accumulation in non-alcoholic fatty liver disease. J. Gastroenterol. 2013;48:434–441. doi: 10.1007/s00535-013-0758-5. - DOI - PMC - PubMed
    1. Guan H-P, Goldstein JL, Brown MS, Liang G. Accelerated fatty acid oxidation in muscle averts fasting-induced hepatic steatosis in SJL/J mice. J. Biol. Chem. 2009;284:24644–24652. doi: 10.1074/jbc.M109.034397. - DOI - PMC - PubMed
    1. Enjoji, M., Kohjima, M. & Nakamuta, M. in The Liver in Systemic Diseases (ed Hiromasa Ohira) 105–122 (Springer Japan, 2016).
    1. Younossi ZM, et al. Global epidemiology of nonalcoholic fatty liver disease—Meta-analytic assessment of prevalence, incidence, and outcomes. Hepatology. 2016;64:73–84. doi: 10.1002/hep.28431. - DOI - PubMed
    1. Brindley, D. N. in Biochemistry of Lipids, Lipoproteins and Membranes (eds D E Vance & J E Vance) 171–203 (Elsevier, 1991).

Publication types