. 2022 Mar 24:11:e74877.
doi: 10.7554/eLife.74877.

Drug targeting Nsp1-ribosomal complex shows antiviral activity against SARS-CoV-2

Affiliations

Drug targeting Nsp1-ribosomal complex shows antiviral activity against SARS-CoV-2

Mohammad Afsar et al. Elife. .

Abstract

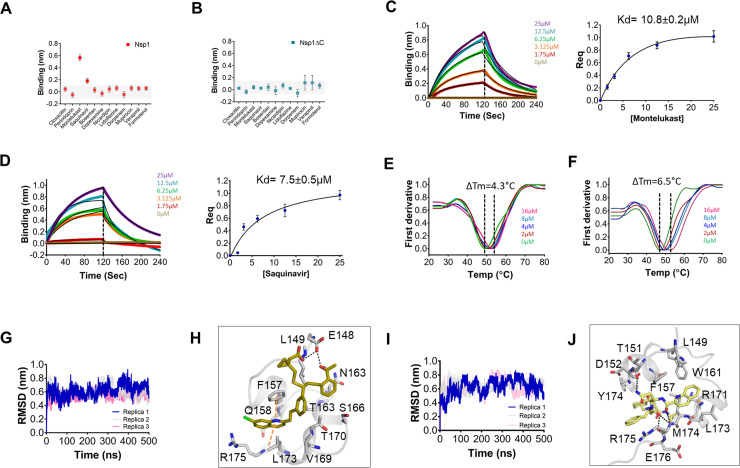
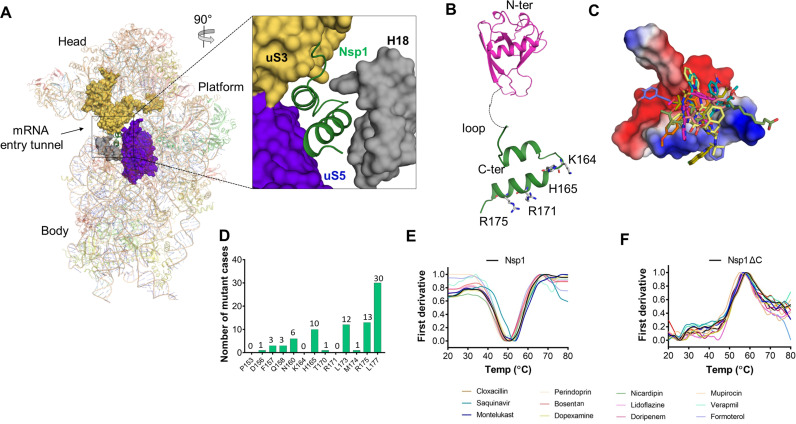
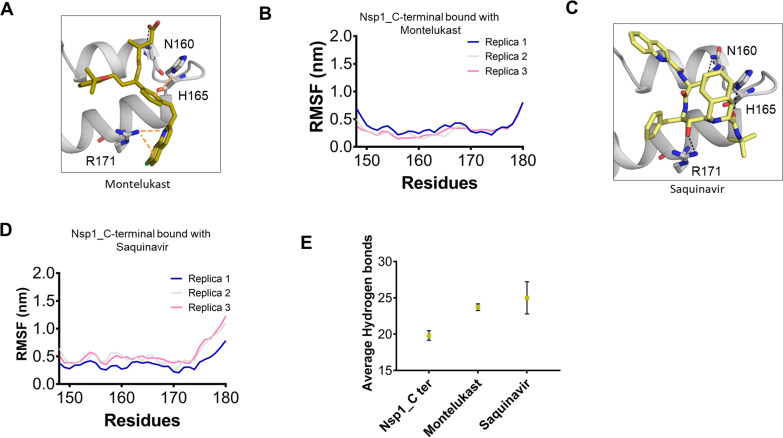
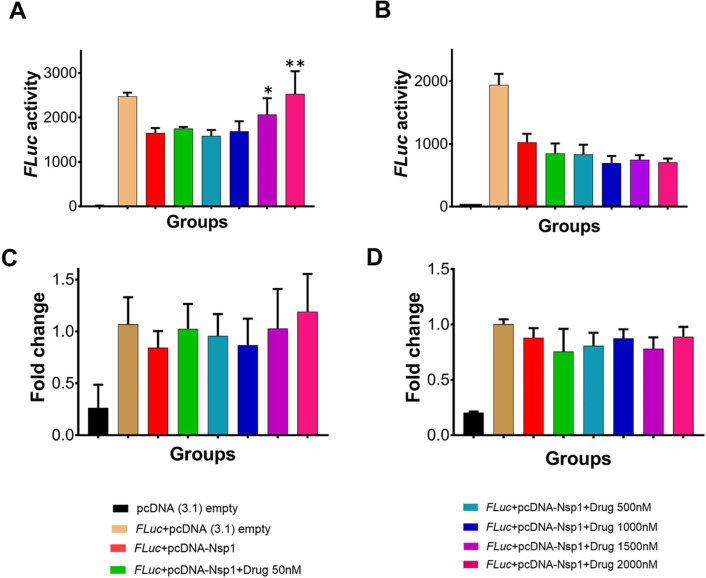
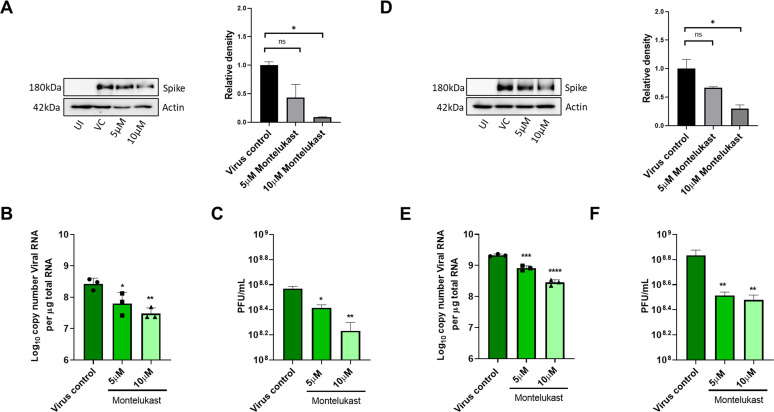
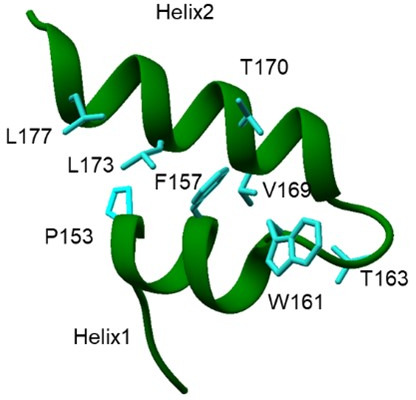
The SARS-CoV-2 non-structural protein 1 (Nsp1) contains an N-terminal domain and C-terminal helices connected by a short linker region. The C-terminal helices of Nsp1 (Nsp1-C-ter) from SARS-CoV-2 bind in the mRNA entry channel of the 40S ribosomal subunit and blocks mRNA entry, thereby shutting down host protein synthesis. Nsp1 suppresses host immune function and is vital for viral replication. Hence, Nsp1 appears to be an attractive target for therapeutics. In this study, we have in silico screened Food and Drug Administration (FDA)-approved drugs against Nsp1-C-ter. Among the top hits obtained, montelukast sodium hydrate binds to Nsp1 with a binding affinity (KD) of 10.8 ± 0.2 µM in vitro. It forms a stable complex with Nsp1-C-ter in simulation runs with -95.8 ± 13.3 kJ/mol binding energy. Montelukast sodium hydrate also rescues the inhibitory effect of Nsp1 in host protein synthesis, as demonstrated by the expression of firefly luciferase reporter gene in cells. Importantly, it shows antiviral activity against SARS-CoV-2 with reduced viral replication in HEK cells expressing ACE2 and Vero-E6 cells. We, therefore, propose montelukast sodium hydrate can be used as a lead molecule to design potent inhibitors to help combat SARS-CoV-2 infection.

Keywords: Nsp1; SARS-CoV-2; medicine; ribosome; translation; viruses.


Conflict of interest statement

MA, RN, MA, DD, HR, SN, SE, ST, TH No competing interests declared

Figures

Figure 1.
Figure 1.. Screening and binding kinetics and molecular simulation dynamics runs of drugs against C-terminal helices of Nsp1 (Nsp1-C-ter).
(A and B) Bio-layer interferometry (BLI) analysis for the initial screening of binding of the drugs with the (A) non-structural protein 1 (Nsp1) and (B) C-terminal helices truncated Nsp1 (Nsp1∆C) proteins. (C and D) The kinetic behaviors of (C) montelukast and (D) saquinavir monitored using BLI by incubating increasing concentration of the drug molecule (0–25 µM) on the protein-bound sensors. Montelukast shows a binding constant (KD) of 10.8 ± 0.8 µM, while saquinavir binds with Nsp1-C-ter with a KD value of 7.5 ± 0.5 µM. (Error bars represent standard deviation of three replicates in (C) and (D). (E and F) Nanoscale differential scanning fluorometry (NanoDSF) experiments to evaluate the change in the melting temperature of the Nsp1 by incubating increasing concentration of (E) montelukast and (F) saquinavir. (The experiments were performed in three replicates.)) (G) Simulation runs with montelukast show stable root mean square deviation (RMSD) values for all replica throughout all molecular dynamic simulation trajectories for 500 ns. (H) The analysis of binding mode of montelukast at the end of 500 ns shows stable binding with C-terminal helices. The residues E148 and L149 form H-bonds with montelukast, while F157 and L173 forms base stacking interactions. (I) Simulation runs with saquinavir show stable pattern in RMSD values throughout in all molecular dynamic simulation trajectories for 500ns. (J) The analysis of binding mode of saquinavir at the end of 500 ns shows stable binding with the C-terminal helices. The residues T151, M174, and R175 form H-bonds with saquinavir, while R171 forms base stacking interactions.
Figure 1—figure supplement 1.
Figure 1—figure supplement 1.. Screening of Food and Drug Administration (FDA)-approved drugs against Nsp1 from SARS-CoV-2 and nanoscale differential scanning fluorometry (NanoDSF) experiments to evaluate the binding of top hits with the non-structural protein 1 (Nsp1) and C-terminal helices truncated Nsp1 (Nsp1∆C).
(A) The cryo-electron microscopy (cryo-EM) structure of the Nsp1-bound 40S ribosome (PDB:6ZOJ) shows the bound C-terminal helices of Nsp1 into the mRNA entry tunnel. The positively charged amino acids forms extensive interaction with h18 of 18S rRNA and the other side of the C-terminal helices interacts with uS3 and uS5. (B) The structure of Nsp1 shows the presence of N-terminal structured region (PDB ID:7K7P) and C-terminal helices connected by a loop. (C) Molecular screening of FDA-approved compounds led to identification of top hits. The docking mode of top hits (drugs) with Nsp1-C-ter is shown. (D) The residues in Nsp1-C-ter involved in binding of selected drugs shows reduced mutational frequency. The analysis was performed on the worldwide deposited sequences of SARS-CoV-2 genome in GISAID database. The GISAID contains 4,440,705 genome sequences and we analyzed single nucleotide variants (SNV) for residues involved in drug binding. This analysis is performed with the help of GESS database (Fang et al., 2021). (E and F) The change in the melting temperature of (E) Nsp1 and (F) Nsp1∆C protein was monitored in the presence of the selected molecules. The melting curve for apo-proteins are shown in black color. Montelukast and saquinavir induce change in the melting temperature of Nsp1 while none of the molecules show any difference in the melting temperature of Nsp1∆C protein.
Figure 1—figure supplement 2.
Figure 1—figure supplement 2.. Structural dynamics of drug-bound complexes of C-terminal helices of Nsp1 (Nsp1-C-ter).
(A) Molecular docking conformation of montelukast with Nsp1-C-ter. (B) The root mean square fluctuation (RMSF) plot of montelukast- bound residues of Nsp1-C-ter during the different replica runs. (C) Molecular docking conformation of saquinavir with Nsp1-C-ter. (D) The RMSF plot of saquinavir- bound residues of Nsp1-C-ter during the different replica runs. (E) Average hydrogen bonds throughout the different replica of the simulation runs of Nsp1 and drugs-bound complexes.
Figure 2.
Figure 2.. Translational rescue experiments in the presence of montelukast and saquinavir.
(A) Luciferase-based reporter assay shows translational rescue of luciferase in the presence of montelukast. (B) Luciferase-based reporter assay shows that saquinavir could not rescue the luciferase expression. Error bars represent standard deviation of three replicates in (A) and (B). (C and D) The real-time PCR to quantitate the fold change of FLuc gene in comparison to GAPDH in the presence of different concentration of the drug molecules. (A) montelukast (B) saquinavir. The panel below provides the details of experimental conditions. Error bars represent standard deviation of three replicates in (A) and (B). The significance of the data was monitored by applying the unpaired t-test through assuming Gaussian distribution parametric test by defining the statistical significance. **p < 0.01; ***p < 0.001; ****p < 0.0001. The error bars represent the standard deviation.
Figure 3.
Figure 3.. Montelukast shows antiviral activity against SARS-CoV-2.
(A) HEK ACE2 cells were pre-treated with 5 or 10 µM montelukast and infected with 0.1 MOI SARS-CoV-2 for 48 hr. Virus spike protein expression by western blot analysis, with corresponding relative density of bands are shown. (B) Viral RNA copy number from infected cells was quantified by qRT PCR and (C) infectious virus titer from cell culture supernatants by plaque assay, respectively. Vero E6 cells were pre-treated with 5 or 10 µM montelukast and infected with 0.001 MOI SARS-CoV-2 for 48 hr. (D) Virus spike protein expression by western blot analysis, with corresponding relative density of bands. (E) Viral RNA copy number from infected cells was quantified by qRT PCR and (F) infectious virus titer from cell culture supernatants by plaque assay. *p < 0.05; **p < 0.01; ***p < 0.001; ****p < 0.0001; ns-not significant, using one-way ANOVA with Dunnett’s multiple comparison test. Error bars represent standard deviation.
Figure 3—figure supplement 1.
Figure 3—figure supplement 1.. Cytotoxicity assay.
Cells were treated in triplicates with increasing concentrations of montelukast or saquinavir as indicated, and cytotoxicity of the drugs was tested 48 hr later by Alamar Blue assay. Data shows percentage toxicity of drugs compared to cell control in (A) HEK293T-ACE2and (B) Vero E6 cells. **p < 0.01; ***p < 0.001; ****p < 0.0001; ns - not significant, using one-way ANOVA with Dunnett’s multiple comparison test. Error bars r epresent standard deviation.
Figure 3—figure supplement 2.
Figure 3—figure supplement 2.. Saquinavir did not show significant antiviral activity against SARS-CoV-2.
(A) HEK ACE2 cells were pre-treated with 5 or 10 µM saquinavir and infected with 0.1 MOI SARS-CoV-2 for 48 hr. Virus spike protein expression by western blot analysis, with corresponding relative density of bands are shown in (A). (B and C) Viral RNA copy number from infected cells was quantified by qRT PCR, and infectious virus titer from cell culture supernatants by plaque assay, shown in (B) and (C) respectively. (D) Vero E6 cells were pre-treated with 5 or 10 µM saquinavir and infected with 0.001 MOI SARS-CoV-2 for 48 hr. Virus spike protein expression by western blot analysis, with relative density of bands. (E and F) Viral RNA copy number from infected cells was quantified by qRT PCR and infectious virus titer from cell culture supernatants by plaque assay. **p < 0.01; ***p < 0.001; ****p < 0.0001; ns - not significant, using one-way ANOVA with Dunnett’s multiple comparison test. Error bars represent standard deviation.
Author response image 1.
Author response image 1.. Secondary structure prediction of C terminal region of Nsp1 shows the adaptation of α-helical conformation.
This region forms two helices which are connected by loop region.
Author response image 2.
Author response image 2.. Hydrophobic amino acids in C terminal helices of Nsp1 shows the presence of hydrophobic interactions between the two helices.

References

    1. Abu-Saleh A, Awad IE, Yadav A, Poirier RA. Discovery of potent inhibitors for SARS-CoV-2’s main protease by ligand-based/structure-based virtual screening, MD simulations, and binding energy calculations. Physical Chemistry Chemical Physics. 2020;22:23099–23106. doi: 10.1039/d0cp04326e. - DOI - PubMed
    1. Case JB, Bailey AL, Kim AS, Chen RE, Diamond MS. Growth, detection, quantification, and inactivation of SARS-CoV-2. Virology. 2020;548:39–48. doi: 10.1016/j.virol.2020.05.015. - DOI - PMC - PubMed
    1. Fang S, Li K, Shen J, Liu S, Liu J, Yang L, Hu CD, Wan J. GESS: a database of global evaluation of SARS-CoV-2/hCoV-19 sequences. Nucleic Acids Research. 2021;49:706–714. doi: 10.1093/nar/gkaa808. - DOI - PMC - PubMed
    1. Finkel Y, Mizrahi O, Nachshon A, Weingarten-Gabbay S, Morgenstern D, Yahalom-Ronen Y, Tamir H, Achdout H, Stein D, Israeli O, Beth-Din A, Melamed S, Weiss S, Israely T, Paran N, Schwartz M, Stern-Ginossar N. The coding capacity of SARS-CoV-2. Nature. 2021;589:125–130. doi: 10.1038/s41586-020-2739-1. - DOI - PubMed
    1. Gordon DE, Jang GM, Bouhaddou M, Xu J, Obernier K, White KM, O’Meara MJ, Rezelj VV, Guo JZ, Swaney DL, Tummino TA, Hüttenhain R, Kaake RM, Richards AL, Tutuncuoglu B, Foussard H, Batra J, Haas K, Modak M, Kim M, Haas P, Polacco BJ, Braberg H, Fabius JM, Eckhardt M, Soucheray M, Bennett MJ, Cakir M, McGregor MJ, Li Q, Meyer B, Roesch F, Vallet T, Mac Kain A, Miorin L, Moreno E, Naing ZZC, Zhou Y, Peng S, Shi Y, Zhang Z, Shen W, Kirby IT, Melnyk JE, Chorba JS, Lou K, Dai SA, Barrio-Hernandez I, Memon D, Hernandez-Armenta C, Lyu J, Mathy CJP, Perica T, Pilla KB, Ganesan SJ, Saltzberg DJ, Rakesh R, Liu X, Rosenthal SB, Calviello L, Venkataramanan S, Liboy-Lugo J, Lin Y, Huang XP, Liu Y, Wankowicz SA, Bohn M, Safari M, Ugur FS, Koh C, Savar NS, Tran QD, Shengjuler D, Fletcher SJ, O’Neal MC, Cai Y, Chang JCJ, Broadhurst DJ, Klippsten S, Sharp PP, Wenzell NA, Kuzuoglu-Ozturk D, Wang HY, Trenker R, Young JM, Cavero DA, Hiatt J, Roth TL, Rathore U, Subramanian A, Noack J, Hubert M, Stroud RM, Frankel AD, Rosenberg OS, Verba KA, Agard DA, Ott M, Emerman M, Jura N, von Zastrow M, Verdin E, Ashworth A, Schwartz O, d’Enfert C, Mukherjee S, Jacobson M, Malik HS, Fujimori DG, Ideker T, Craik CS, Floor SN, Fraser JS, Gross JD, Sali A, Roth BL, Ruggero D, Taunton J, Kortemme T, Beltrao P, Vignuzzi M, García-Sastre A, Shokat KM, Shoichet BK, Krogan NJ. A SARS-CoV-2 protein interaction map reveals targets for drug repurposing. Nature. 2020;583:459–468. doi: 10.1038/s41586-020-2286-9. - DOI - PMC - PubMed

Publication types