

An Integrated Multiple Electrochemical miRNA Sensing System Embedded into a Microfluidic Chip
- PMID: 35323415
- PMCID: PMC8946844
- DOI: 10.3390/bios12030145
An Integrated Multiple Electrochemical miRNA Sensing System Embedded into a Microfluidic Chip
Abstract
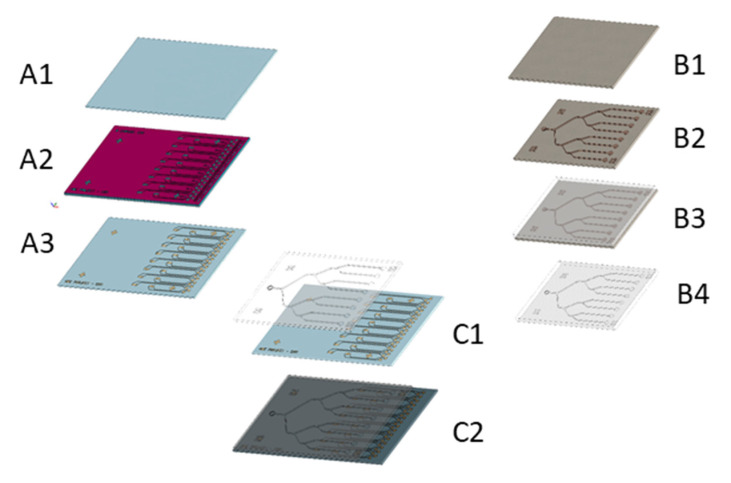
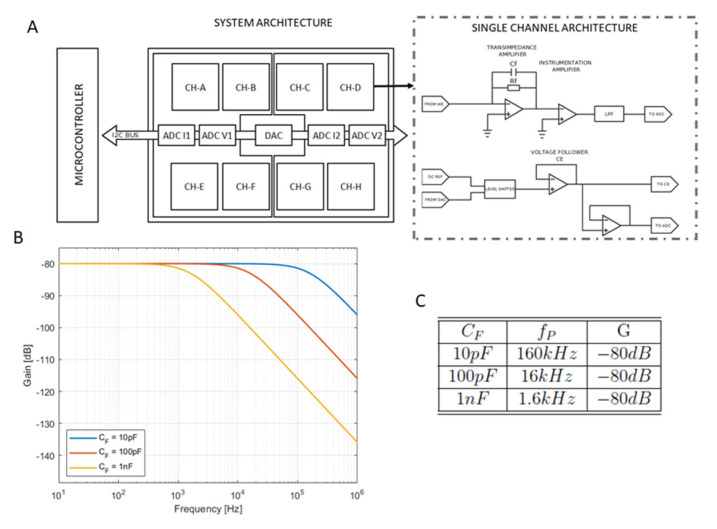
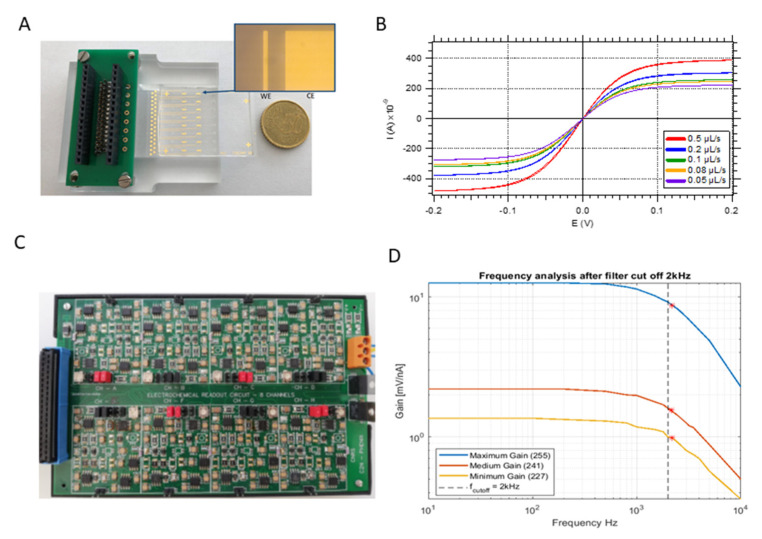
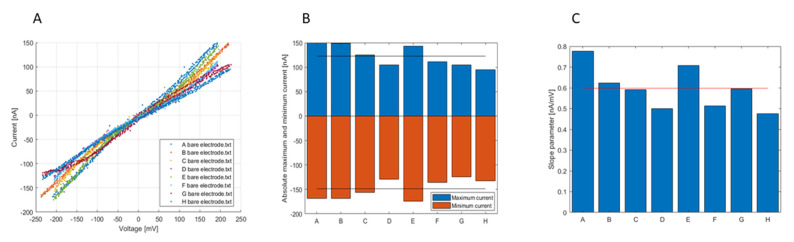
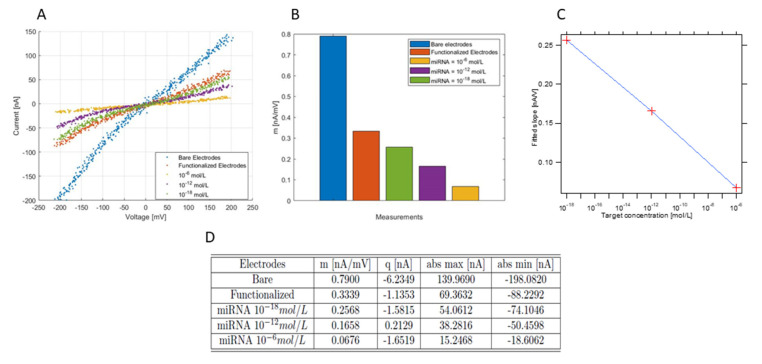
In this article, we present the design, fabrication and characterization of a microfluidic device and a dedicated electronic system to perform 8 multiplexed electrochemical measurements of synthetic miRNA strands, as well as the biochemical protocols developed for the functionalization of the electrodes and the quantification experiments. The outcomes of this work highlight that the parallelization of eight microchannels containing 2-electrode cells driven by the dedicated electronics offers a solution as robust as a conventional 3-electrode cell and commercially available potentiostats. In addition, this solution presents the advantage of simultaneously reduce the microfabrication complexity, as well as offering an integrated; multiplexed and portable system for the quantification of miRNA. The results presented demonstrate that the system shows a linear response on concentrations down to 10-18 mol/L of perfect matched reporter and capture sequences of synthetic miRNA.
Keywords: cyclic voltammetry; electrochemical detection; microRNA; microfabrication; microfluidics; readout electronics.
Conflict of interest statement
The authors declare no conflict of interest.
Figures
Similar articles
-
Microfluidic-Based Electrochemical Immunosensing of Ferritin.Biosensors (Basel). 2020 Aug 5;10(8):91. doi: 10.3390/bios10080091. Biosensors (Basel). 2020. PMID: 32764518 Free PMC article.
-
Fully Printed Wearable Microfluidic Devices for High-Throughput Sweat Sampling and Multiplexed Electrochemical Analysis.ACS Sens. 2021 Mar 26;6(3):1174-1186. doi: 10.1021/acssensors.0c02446. Epub 2021 Jan 31. ACS Sens. 2021. PMID: 33517662
-
Low-cost and rapid prototyping of integrated electrochemical microfluidic platforms using consumer-grade off-the-shelf tools and materials.Lab Chip. 2022 May 3;22(9):1779-1792. doi: 10.1039/d1lc01100f. Lab Chip. 2022. PMID: 35293400
-
Micro- and nano-devices for electrochemical sensing.Mikrochim Acta. 2022 Nov 22;189(12):459. doi: 10.1007/s00604-022-05548-3. Mikrochim Acta. 2022. PMID: 36416992 Free PMC article. Review.
-
Rapid Manufacturing of Multilayered Microfluidic Devices for Organ on a Chip Applications.Sensors (Basel). 2021 Feb 16;21(4):1382. doi: 10.3390/s21041382. Sensors (Basel). 2021. PMID: 33669434 Free PMC article. Review.
Cited by
-
Navigating Challenges and Opportunities in Multi-Omics Integration for Personalized Healthcare.Biomedicines. 2024 Jul 5;12(7):1496. doi: 10.3390/biomedicines12071496. Biomedicines. 2024. PMID: 39062068 Free PMC article. Review.
-
Detecting mir-155-3p through a Molecular Beacon Bead-Based Assay.Molecules. 2024 Jul 3;29(13):3182. doi: 10.3390/molecules29133182. Molecules. 2024. PMID: 38999134 Free PMC article.
References
-
- Islam M.N., Masud M.K., Haque M.H., Hossain M.S.A., Yamauchi Y., Nguyen N.-T., Shiddiky M.J.A. RNA Biomarkers: Diagnostic and Prognostic Potentials and Recent Developments of Electrochemical Biosensors. Small Methods. 2017;1:1700131. doi: 10.1002/smtd.201700131. - DOI
MeSH terms
Substances
Grants and funding
LinkOut - more resources
Full Text Sources
