

Portable FRET-Based Biosensor Device for On-Site Lead Detection
- PMID: 35323427
- PMCID: PMC8946079
- DOI: 10.3390/bios12030157
Portable FRET-Based Biosensor Device for On-Site Lead Detection
Abstract
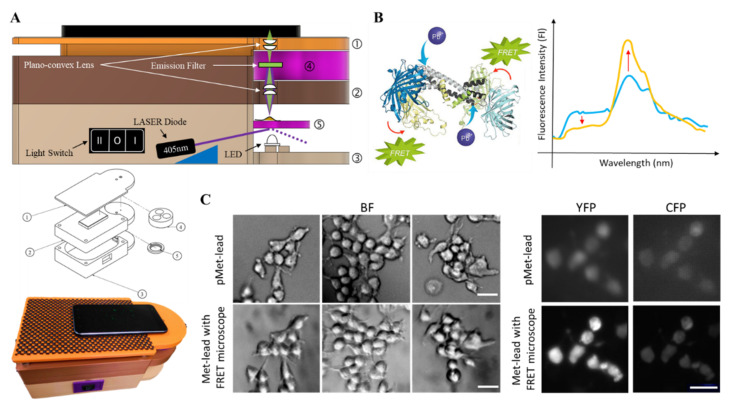
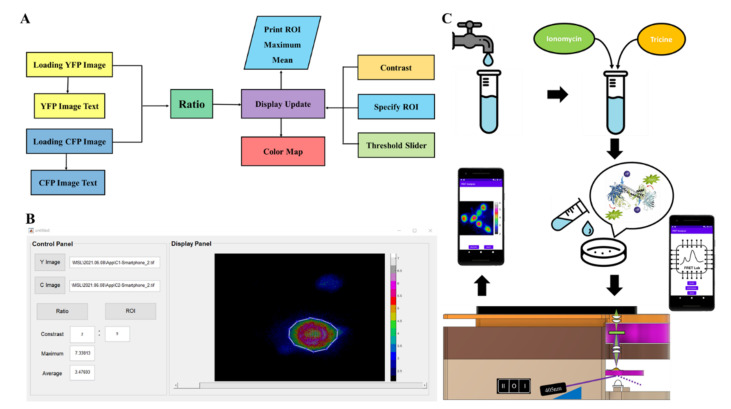
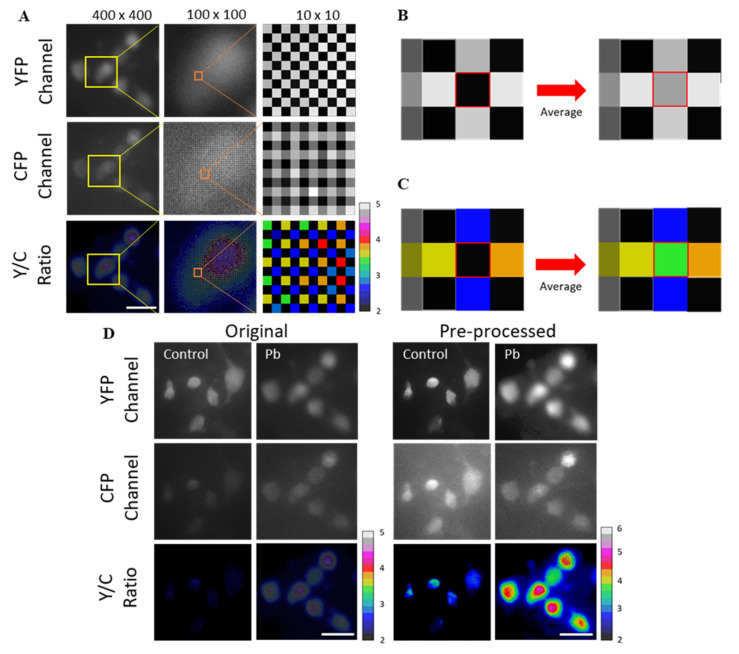
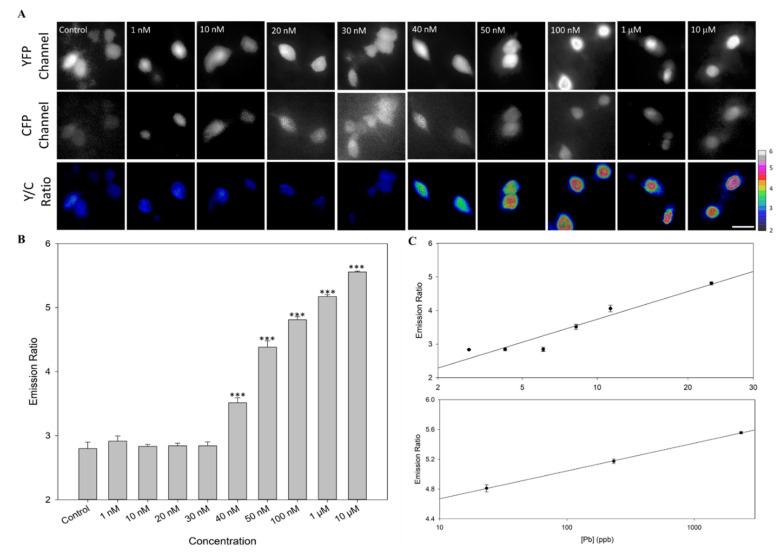
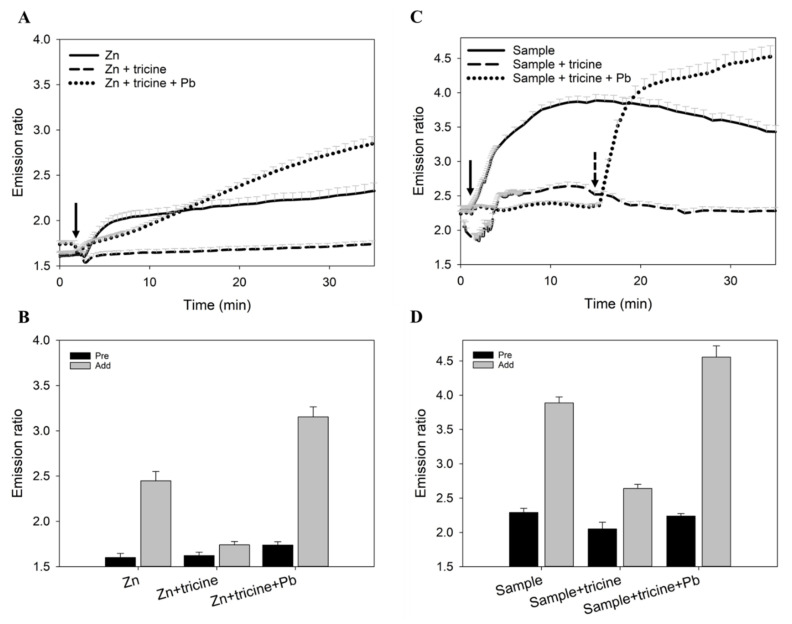
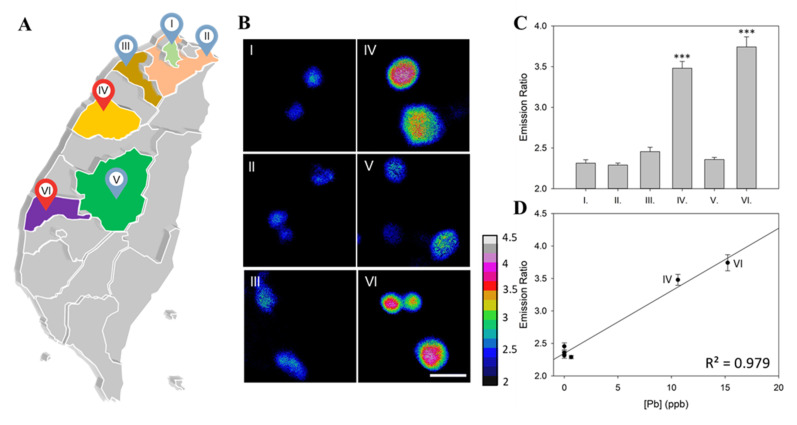
Most methods for measuring environmental lead (Pb) content are time consuming, expensive, hazardous, and restricted to specific analytical systems. To provide a facile, safe tool to detect Pb, we created pMet-lead, a portable fluorescence resonance energy transfer (FRET)-based Pb-biosensor. The pMet-lead device comprises a 3D-printed frame housing a 405-nm laser diode-an excitation source for fluorescence emission images (YFP and CFP)-accompanied by optical filters, a customized sample holder with a Met-lead 1.44 M1 (the most recent version)-embedded biochip, and an optical lens aligned for smartphone compatibility. Measuring the emission ratios (Y/C) of the FRET components enabled Pb detection with a dynamic range of nearly 2 (1.96), a pMet-lead/Pb dissociation constant (Kd) 45.62 nM, and a limit of detection 24 nM (0.474 μg/dL, 4.74 ppb). To mitigate earlier problems with a lack of selectivity for Pb vs. zinc, we preincubated samples with tricine, a low-affinity zinc chelator. We validated the pMet-lead measurements of the characterized laboratory samples and unknown samples from six regions in Taiwan by inductively coupled plasma mass spectrometry (ICP-MS). Notably, two unknown samples had Y/C ratios significantly higher than that of the control (3.48 ± 0.08 and 3.74 ± 0.12 vs. 2.79 ± 0.02), along with Pb concentrations (10.6 ppb and 15.24 ppb) above the WHO-permitted level of 10 ppb in tap water, while the remaining four unknowns showed no detectable Pb upon ICP-MS. These results demonstrate that pMet-lead provides a rapid, sensitive means for on-site Pb detection in water from the environment and in living/drinking supply systems to prevent potential Pb poisoning.
Keywords: FRET; Met-lead; groundwater lead; lead biosensors; portable Pb sensor; smartphone-based device; tap water lead.
Conflict of interest statement
The authors declare no conflict of interest.
Figures
Similar articles
-
Development and optimization of heavy metal lead biosensors in biomedical and environmental applications.J Chin Med Assoc. 2021 Aug 1;84(8):745-753. doi: 10.1097/JCMA.0000000000000574. J Chin Med Assoc. 2021. PMID: 34225337 Review.
-
High-performance FRET biosensors for single-cell and in vivo lead detection.Biosens Bioelectron. 2020 Nov 15;168:112571. doi: 10.1016/j.bios.2020.112571. Epub 2020 Aug 31. Biosens Bioelectron. 2020. PMID: 32892119
-
Versatile Cell and Animal Models for Advanced Investigation of Lead Poisoning.Biosensors (Basel). 2021 Oct 4;11(10):371. doi: 10.3390/bios11100371. Biosensors (Basel). 2021. PMID: 34677327 Free PMC article.
-
Flow cytometric measurement of fluorescence (Förster) resonance energy transfer from cyan fluorescent protein to yellow fluorescent protein using single-laser excitation at 458 nm.Cytometry A. 2003 May;53(1):39-54. doi: 10.1002/cyto.a.10037. Cytometry A. 2003. PMID: 12701131
-
A practical method for monitoring FRET-based biosensors in living animals using two-photon microscopy.Am J Physiol Cell Physiol. 2015 Dec 1;309(11):C724-35. doi: 10.1152/ajpcell.00182.2015. Epub 2015 Sep 2. Am J Physiol Cell Physiol. 2015. PMID: 26333599 Free PMC article. Review.
Cited by
-
Developments in FRET- and BRET-Based Biosensors.Micromachines (Basel). 2022 Oct 20;13(10):1789. doi: 10.3390/mi13101789. Micromachines (Basel). 2022. PMID: 36296141 Free PMC article. Review.
-
Solving Color Reproducibility between Digital Devices: A Robust Approach of Smartphones Color Management for Chemical (Bio)Sensors.Biosensors (Basel). 2022 May 17;12(5):341. doi: 10.3390/bios12050341. Biosensors (Basel). 2022. PMID: 35624642 Free PMC article.
-
Accurate and Convenient Lung Cancer Diagnosis through Detection of Extracellular Vesicle Membrane Proteins via Förster Resonance Energy Transfer.Nano Lett. 2023 Sep 13;23(17):8115-8125. doi: 10.1021/acs.nanolett.3c02193. Epub 2023 Aug 29. Nano Lett. 2023. PMID: 37643406 Free PMC article.
-
Sensors for Environmental Monitoring and Food Safety.Biosensors (Basel). 2022 May 26;12(6):366. doi: 10.3390/bios12060366. Biosensors (Basel). 2022. PMID: 35735513 Free PMC article.
-
Heavy Metal-Gut Microbiota Interactions: Probiotics Modulation and Biosensors Detection.Biosensors (Basel). 2025 Mar 14;15(3):188. doi: 10.3390/bios15030188. Biosensors (Basel). 2025. PMID: 40136985 Free PMC article. Review.
References
-
- Rees N., Fuller R. The Toxic Truth: Children’s Exposure to Lead Pollution Undermines a Generation of Future Potential. UNICEF; Hong Kong, China: 2020.
-
- Jarvis P., Fawell J. Lead in drinking water—An ongoing public health concern? Curr. Opin. Environ. Sci. Health. 2021;20:100239. doi: 10.1016/j.coesh.2021.100239. - DOI
MeSH terms
Substances
Grants and funding
LinkOut - more resources
Full Text Sources
Miscellaneous
