. 2022 Feb 28;13(3):240.
doi: 10.3390/insects13030240.

Mass Trapping Drosophila suzukii, What Would It Take? A Two-Year Field Study on Trap Interference

Affiliations

Mass Trapping Drosophila suzukii, What Would It Take? A Two-Year Field Study on Trap Interference

Rik Clymans et al. Insects. .

Abstract

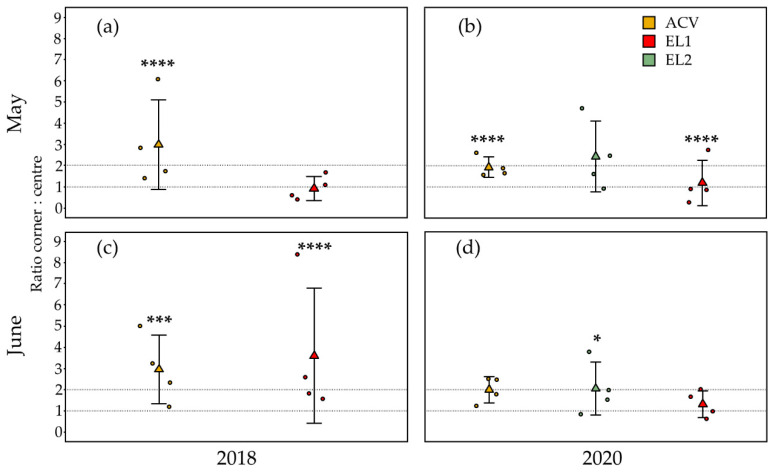
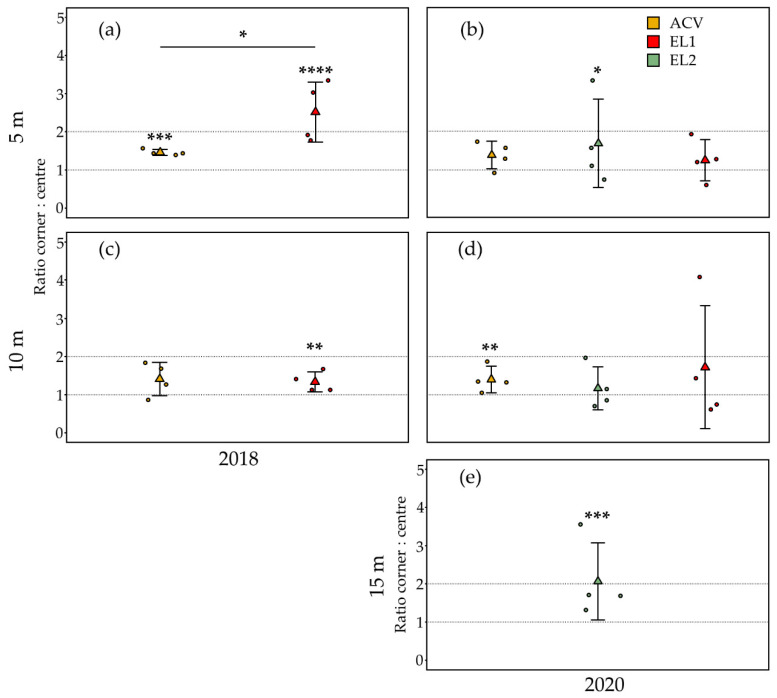
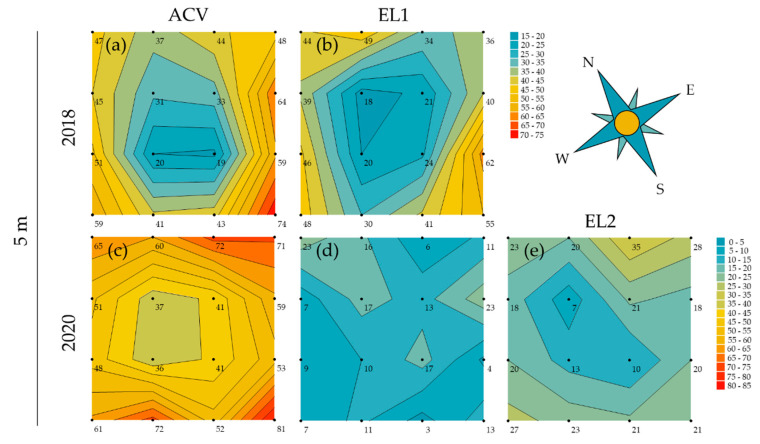
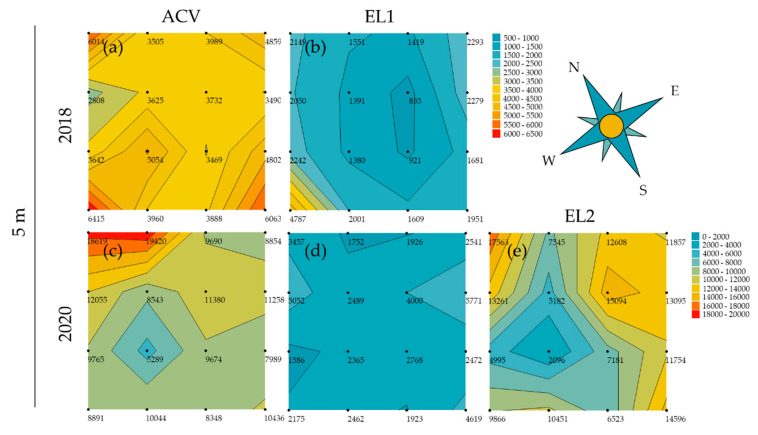
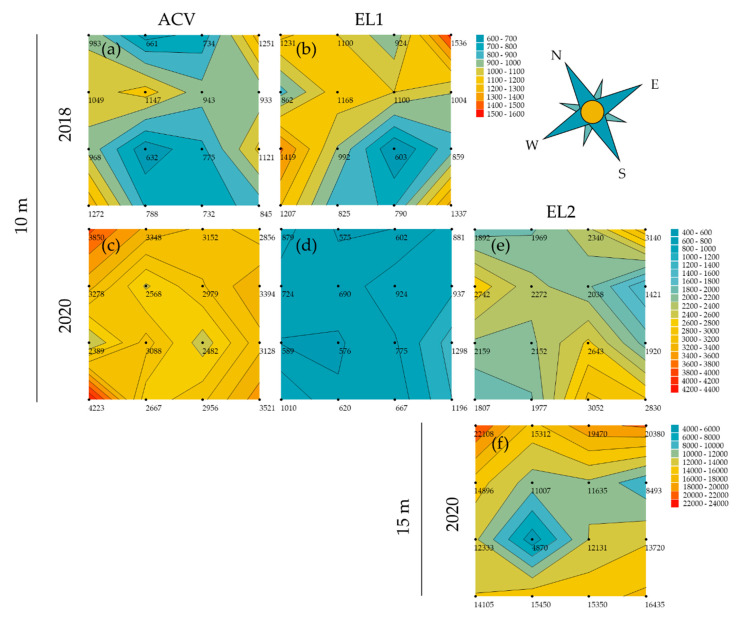
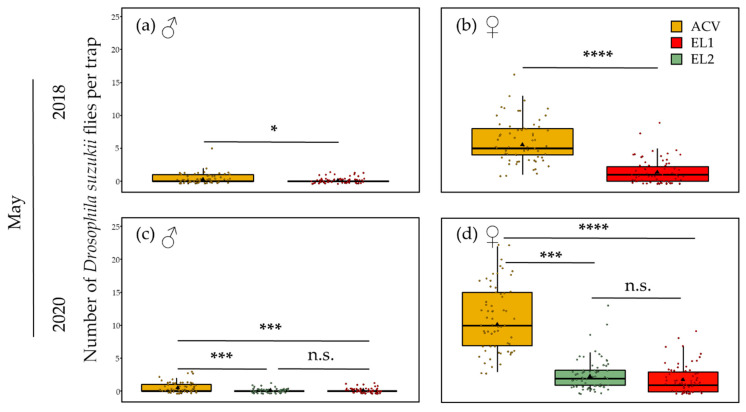
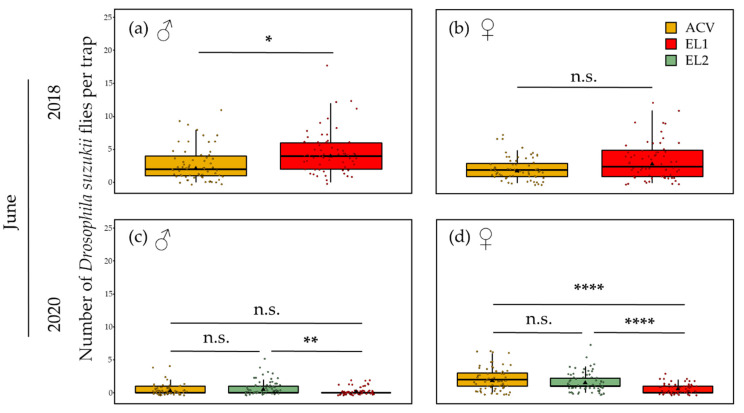
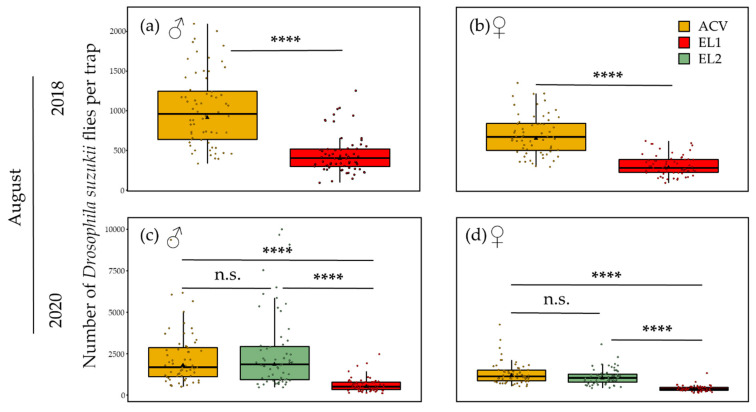
The invasion of Drosophila suzukii (Matsumura) (Diptera: Drosophilidae) worldwide has disrupted existing or developing integrated pest management (IPM) programs in soft-skinned fruits. Currently, with a reliance on only broad-spectrum insecticides, there is a critical call for alternative control measures. Behavioural control is one of the pillars of IPM, and, in the present study, it is investigated whether mass trapping could be viable for D. suzukii management. By quantifying trap interference in 4 × 4 replicate trapping grids, an estimate of the attraction radius for a certain attractant and context can be obtained. Traps designed for dry trapping (no drowning solution, but a killing agent inside) and synthetic controlled released experimental lures were tested in a two-year field study. Apple cider vinegar (ACV) was included as a reference bait and trials were performed with 5, 10 and 15 m inter-trap spacings at different seasonal timings. Clear trap interference and, hence, overlapping attraction radii were observed both in spring and summer for both the synthetic lures and ACV. In early spring, ACV shows the most potential for mass trapping, however from June onwards, the experimental dry lures show equal or better results than ACV. Based on our findings, workable trap densities are deemed possible, encouraging further development of mass trapping strategies for the control of D. suzukii.

Keywords: Drosophila suzukii; Prunus cerasus; apple cider vinegar; attract and kill; attraction radius; controlled release dispensers; fruit flies; semiochemicals; trap competition; trap density.


Conflict of interest statement

The authors declare no conflict of interest. The funders had no role in design, execution, interpretation, or writing of the study.

Figures

Figure 1
Figure 1
Corner to centre trap catch (D. suzukii) ratios for the two and three attractants tested in spring 2018 and 2020, respectively, at 5 m inter-trap spacing. Jittered points represent the ratio per replicate (n = 4) grid, triangles depict their mean and error bars are standard deviations. Asterisks above graphs refer to the level of significance regarding the difference in counts between corner and centre traps (n = 16) analysed for each attractant and period (GLMM, * ≤ 0.05, ** ≤ 0.01, *** ≤ 0.001, **** ≤ 0.0001). Between the attractants, no statistical differences were found in corner: centre ratios. (a) In May 2018, ACV had significantly more trap catches in the corner traps than in the centre traps. (b) In May 2020, a similar result was obtained for ACV, whereas EL1 had significant less trap catches in the corner traps than in the centre traps. (c) In June 2018, both ACV and EL1 had significantly more trap catches in the corner traps. (d) In June 2020, only EL2 had significantly higher trap catches in the corner traps than in the centre traps.
Figure 2
Figure 2
Corner to centre trap catch (D. suzukii) ratios for the two and three attractants tested in summer 2018 and 2020, respectively. Trials were conducted at an inter-trap spacings of 5 and 10 m, for EL2 15 m was tested as well. Jittered points represent the ratio per replicate (n = 4) grid, triangles depict their mean and error bars are standard deviations. Asterisks above graphs refer to the level of significance regarding the difference in counts between corner and centre traps (n= 16) analysed for each attractant and period (GLMM, * p ≤ 0.05, ** p ≤ 0.01, *** p ≤ 0.001, **** p ≤ 0.0001). Between the attractants, only a statistical difference was found in the corner: centre ratios in the trial at 5 m in 2018, shown by a line over the different attractants and an asterisk (ANOVA, F (1,6) = 7.18, p = 0.04). (a) At 5 m spacing in 2018, both ACV as EL1 showed significantly more trap catches in the corner traps than in the centre traps, but the mean corner: centre ratio of EL1 was significantly higher than that of ACV. (b) In 2020, at 5 m spacing, only EL2 showed significantly higher trap catches in the corner traps than in the centre traps. (c) When spacing the traps at 10 m in 2018, EL1 caught significantly more flies in the corner traps than in the centre traps, whereas ACV did not. (d) In 2020, at 10 m the opposite was observed: significantly higher trap catches in the corner traps than in the centre traps for ACV, but not for both experimental lures. (e) When spacing the EL2 traps 15 m in 2020, significantly more flies were caught in the corner traps than in the centre traps.
Figure 3
Figure 3
Contour plots for the trials in spring at 5 m inter-trap spacing. Each point of the 4 × 4 grids represents the pooled D. suzukii (male and female) trap catches for a trap position over the whole spring (May and June) trial period and the four replicate grids. The contour plots for (a) ACV and (b) EL1 in 2018 both show a clear depression in the centre of the grid. The plots are relatively symmetrical and there is no evident relation with the mean NNW winds. In 2020, the contour plots of (c) ACV and (e) EL2 again show a similar depression in the centre whereas this is not seen for (d) EL1. Additionally, here no evident relation with the mean wind direction (WSW) can be observed.
Figure 4
Figure 4
Contour plots for the trials in summer at 5 m inter-trap spacing. Each point of the 4 × 4 grids represents the pooled D. suzukii (male and female) trap catches for a trap position over the whole trial period (August) and the four replicate grids. The contour plots for (a) ACV and (b) EL1 in 2018 both show a clear depression in the centre of the grid and peaks on the corners. For both plots, the highest peak is on the most western (corner) trap position. The mean wind direction in this period was SW. In 2020, the contour plots of (c) ACV and (e) EL2 again show a depression in the centre, while this is not seen for (d) EL1. Here, for ACV, the plot is asymmetrical, with mainly one centre and one corner trap position causing the contrast. For both ACV and EL2 in 2020, the highest peak is seen on the most northern (corner) trap position and the least captures are observed on the same western centre trap position. Mean wind direction during this period was SSE.
Figure 5
Figure 5
Contour plots for the trials in summer at 10 and 15 m inter-trap spacing. Each point of the 4 × 4 grids represents the pooled D. suzukii (male and female) trap catches for a trap position over the whole trial period (August/September) and the four replicate grids. The contour plots for (a) ACV and (b) EL1 in 2018 both show a similar depression in the southwestern centre trap positions. For EL1, there is a pattern of peaks on the corner trap positions; for ACV this is less evident. The mean wind direction in this period was SSW. In 2020, the contour plot of (c) ACV shows a depression in the centre and peaks on the corner trap positions. This pattern is not as clear for (d) EL1 and absent for (e) EL2. Mean wind direction during the corresponding period was SW. (f) The plot for EL2 at 15 m inter-trap spacing shows a clear depression in the centre with peaks on the corner trap positions. The mean wind direction was SSE during this trial.
Figure 6
Figure 6
Number of D. suzukii flies per trap per sex and attractant in May. Jittered points and boxplots represent the 64 replicate traps and their distribution, respectively. Black triangles represent the estimated marginal mean number of D. suzukii flies per trap (GLMM). Lines connecting boxplots with asterisks above indicate the level of significance regarding the difference in the estimated marginal means of different attractants (GLMM, * p ≤ 0.05, ** p ≤ 0.01, *** p ≤ 0.001, **** p ≤ 0.0001, n.s.: not significant). (a) For the males in May 2018, regardless of the low proportion of overwintering males, significantly more flies were caught with ACV than with EL1. (b) For the females, the same is observed. (c,d) In 2020 for both males and females, ACV caught significantly more D. suzukii than both EL1 and EL2, with the latter two not significantly difference.
Figure 7
Figure 7
Number of D. suzukii flies per trap per sex and attractant in June. Jittered points and boxplots represent the 64 replicate traps and their distribution, respectively. Black triangles represent the estimated marginal mean number of D. suzukii flies per trap (GLMM). Lines connecting boxplots with asterisks above indicate the level of significance regarding the difference in the estimated marginal means of different attractants (GLMM, * p ≤ 0.05, ** p ≤ 0.01, *** p ≤ 0.001, **** p ≤ 0.0001, n.s.: not significant). (a) In June 2018, significantly more males were caught with EL1 than with ACV. (b) For the females, the difference was not significant. (c) In 2020, EL2 caught significantly more male D. suzukii flies than EL1. The number of males caught by ACV did not significantly differ from that of both EL1 and EL2. (d) For the females in June 2020, ACV and EL2 did not significantly differ in fly catches, but both caught significantly more flies than EL1.
Figure 8
Figure 8
Number of D. suzukii flies per trap per sex and attractant in August. Jittered points and boxplots represent the 64 replicate traps and their distribution, respectively. Black triangles represent the estimated marginal mean number of D. suzukii flies per trap (GLMM). Lines connecting boxplots with asterisks above indicate the level of significance regarding the difference in the estimated marginal means of different attractants (GLMM, * p ≤ 0.05, ** p ≤ 0.01, *** p ≤ 0.001, **** p ≤ 0.0001, n.s.: not significant). (a) In August 2018, significantly more males were caught with ACV than with EL1. (b) For the females, the same was observed. (c,d) In 2020, for both males and females, ACV and EL2 did not significantly differ in fly catches, but both caught significantly more flies than EL1.

Similar articles

Cited by

References

    1. Asplen M.K., Anfora G., Biondi A., Choi D.S., Chu D., Daane K.M., Gibert P., Gutierrez A.P., Hoelmer K.A., Hutchison W.D., et al. Invasion biology of spotted wing Drosophila (Drosophila suzukii): A global perspective and future priorities. J. Pest Sci. 2015;88:469–494. doi: 10.1007/s10340-015-0681-z. - DOI
    1. Ometto L., Cestaro A., Ramasamy S., Grassi A., Revadi S., Siozios S., Moretto M., Fontana P., Varotto C., Pisani D., et al. Linking genomics and ecology to investigate the complex evolution of an invasive Drosophila pest. Genome Biol. Evol. 2013;5:745–757. doi: 10.1093/gbe/evt034. - DOI - PMC - PubMed
    1. Adrion J.R., Kousathanas A., Pascual M., Burrack H.J., Haddad N.M., Bergland A.O., Machado H., Sackton T.B., Schlenke T.A., Watada M., et al. Drosophila suzukii: The genetic footprint of a recent, worldwide invasion. Mol. Biol. Evol. 2014;31:3148–3163. doi: 10.1093/molbev/msu246. - DOI - PMC - PubMed
    1. Mortelmans J., Casteels H., Beliën T. Drosophila suzukii (Diptera: Drosophilidae): A pest species new to Belgium. Belgian J. Zool. 2012;142:143–146.
    1. Cini A., Ioriatti C., Anfora G. A review of the invasion of Drosophila suzukii in Europe and a draft research agenda for integrated pest management. Bull. Insectology. 2012;65:149–160.

LinkOut - more resources