JPA: Joint Metabolic Feature Extraction Increases the Depth of Chemical Coverage for LC-MS-Based Metabolomics and Exposomics
- PMID: 35323655
- PMCID: PMC8952385
- DOI: 10.3390/metabo12030212
JPA: Joint Metabolic Feature Extraction Increases the Depth of Chemical Coverage for LC-MS-Based Metabolomics and Exposomics
Abstract
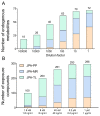
Extracting metabolic features from liquid chromatography-mass spectrometry (LC-MS) data has been a long-standing bioinformatic challenge in untargeted metabolomics. Conventional feature extraction algorithms fail to recognize features with low signal intensities, poor chromatographic peak shapes, or those that do not fit the parameter settings. This problem also poses a challenge for MS-based exposome studies, as low-abundant metabolic or exposomic features cannot be automatically recognized from raw data. To address this data processing challenge, we developed an R package, JPA (short for Joint Metabolomic Data Processing and Annotation), to comprehensively extract metabolic features from raw LC-MS data. JPA performs feature extraction by combining a conventional peak picking algorithm and strategies for (1) recognizing features with bad peak shapes but that have tandem mass spectra (MS2) and (2) picking up features from a user-defined targeted list. The performance of JPA in global metabolomics was demonstrated using serial diluted urine samples, in which JPA was able to rescue an average of 25% of metabolic features that were missed by the conventional peak picking algorithm due to dilution. More importantly, the chromatographic peak shapes, analytical accuracy, and precision of the rescued metabolic features were all evaluated. Furthermore, owing to its sensitive feature extraction, JPA was able to achieve a limit of detection (LOD) that was up to thousands of folds lower when automatically processing metabolomics data of a serial diluted metabolite standard mixture analyzed in HILIC(-) and RP(+) modes. Finally, the performance of JPA in exposome research was validated using a mixture of 250 drugs and 255 pesticides at environmentally relevant levels. JPA detected an average of 2.3-fold more exposure compounds than conventional peak picking only.
Keywords: data processing; exposomics; feature extraction; metabolite annotation; untargeted metabolomics.
Conflict of interest statement
The authors declare no conflict of interest.
Figures


References
-
- Huan T., Palermo A., Ivanisevic J., Rinehart D., Edler D., Phommavongsay T., Benton H.P., Guijas C., Domingo-Almenara X., Warth B. Autonomous multimodal metabolomics data integration for comprehensive pathway analysis and systems biology. Anal. Chem. 2018;90:8396–8403. doi: 10.1021/acs.analchem.8b00875. - DOI - PMC - PubMed
-
- Vineis P., Chadeau-Hyam M., Gmuender H., Gulliver J., Herceg Z., Kleinjans J., Kogevinas M., Kyrtopoulos S., Nieuwenhuijsen M., Phillips D.H. The exposome in practice: Design of the EXPOsOMICS project. Int. J. Hyg. Environ. Health. 2017;220:142–151. doi: 10.1016/j.ijheh.2016.08.001. - DOI - PMC - PubMed
Grants and funding
LinkOut - more resources
Full Text Sources
Research Materials

