

A Novel Methodology to Obtain the Mechanical Properties of Membranes by Means of Dynamic Tests
- PMID: 35323765
- PMCID: PMC8951155
- DOI: 10.3390/membranes12030288
A Novel Methodology to Obtain the Mechanical Properties of Membranes by Means of Dynamic Tests
Abstract
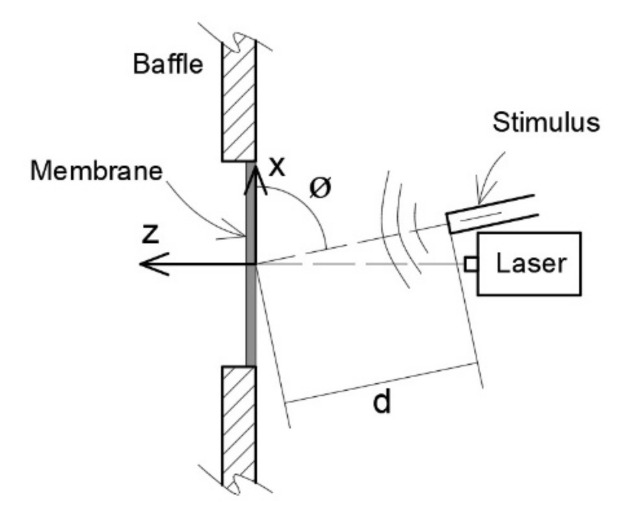
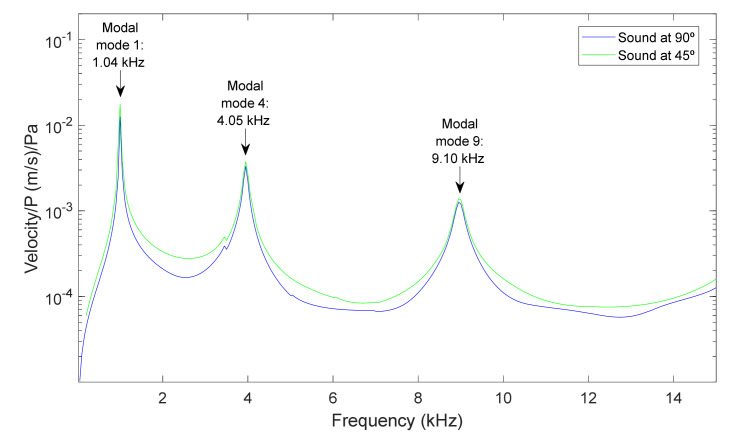
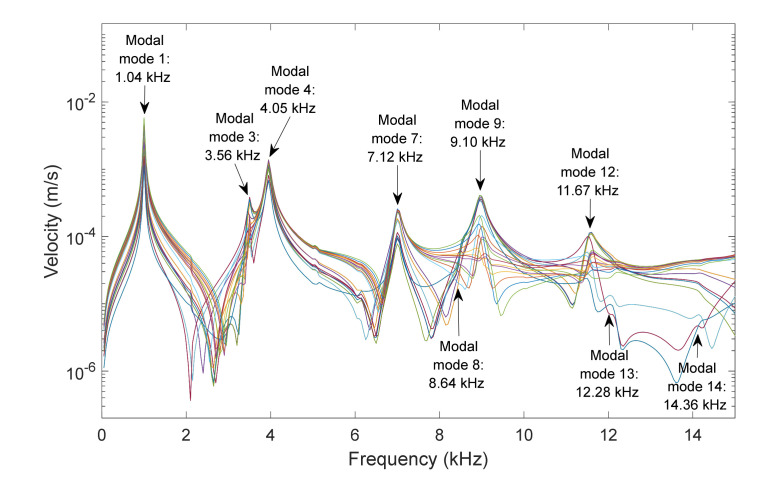
A new, non-destructive methodology is proposed in this work in order to determine the mechanical properties of membrane using vibro-acoustic tests. This procedure is based on the dynamic analysis of the behavior of the membrane. When the membrane is subjected to a sound excitation it responds by vibrating based on its modal characteristics and this modal parameter is directly related to its mechanical properties. The paper is structured in two parts. First, the theoretical bases of the test are presented. The interaction between the sound waves and the membrane (mechano-acoustic coupling) is complex and requires meticulous study. It was broadly studied by means of numerical simulations. A summary of this study is shown. Aspects, such as the position of the sound source, the measuring points, the dimensions of the membrane, the frequency range, and the magnitudes to be measured, among others, were evaluated. The validity of modal analysis curve-fitting techniques to extract the modal parameter from the data measures was also explored. In the second part, an experimental test was performed to evaluate the validity of the method. A membrane of the same material with three different diameters was measured with the aim of estimating the value of the Young's modulus. The procedure was applied and satisfactory results were obtained. Additionally, the experiment shed light on aspects that must be taken account in future experiments.
Keywords: experiment; finite element model; membrane characterization.
Conflict of interest statement
The authors declare no conflict of interest. The funders had no role in the design of the study; in the collection, analyses, or interpretation of data; in the writing of the manuscript, or in the decision to publish the results.
Figures


References
-
- Ding X., Ko W.H., Mansour J.M. Residual stress and mechanical properties of boron-doped p+-silicon films. Sens. Actuators A Phys. 1990;23:866–871. doi: 10.1016/0924-4247(90)87048-N. - DOI
-
- Ye X.Y., Zhang J.H., Zhou Z.Y., Yang Y. Measurement of Young’s modulus and residual stress of micromembranes; Proceedings of the MHS’96 Seventh International Symposium on Micro Machine and Human Science; Nagoya, Japan. 2–4 October 1996; pp. 125–129.
-
- Tabata O., Kawahata K., Sugiyama S., Igarashi I. Mechanical property measurements of thin films using load-deflection of composite rectangular membrane. Micromech. MEMS Class. Semin. Pap. 1990. 1997;20:667–671. doi: 10.1109/9780470545263.sect14. - DOI
-
- Petersen K.E., Guarnieri C.R. Young’s modulus measurements of thin films using micromechanics. J. Appl. Phys. 1979;50:6761–6766. doi: 10.1063/1.325870. - DOI
Grants and funding
LinkOut - more resources
Full Text Sources
